Ansible部署prometheus
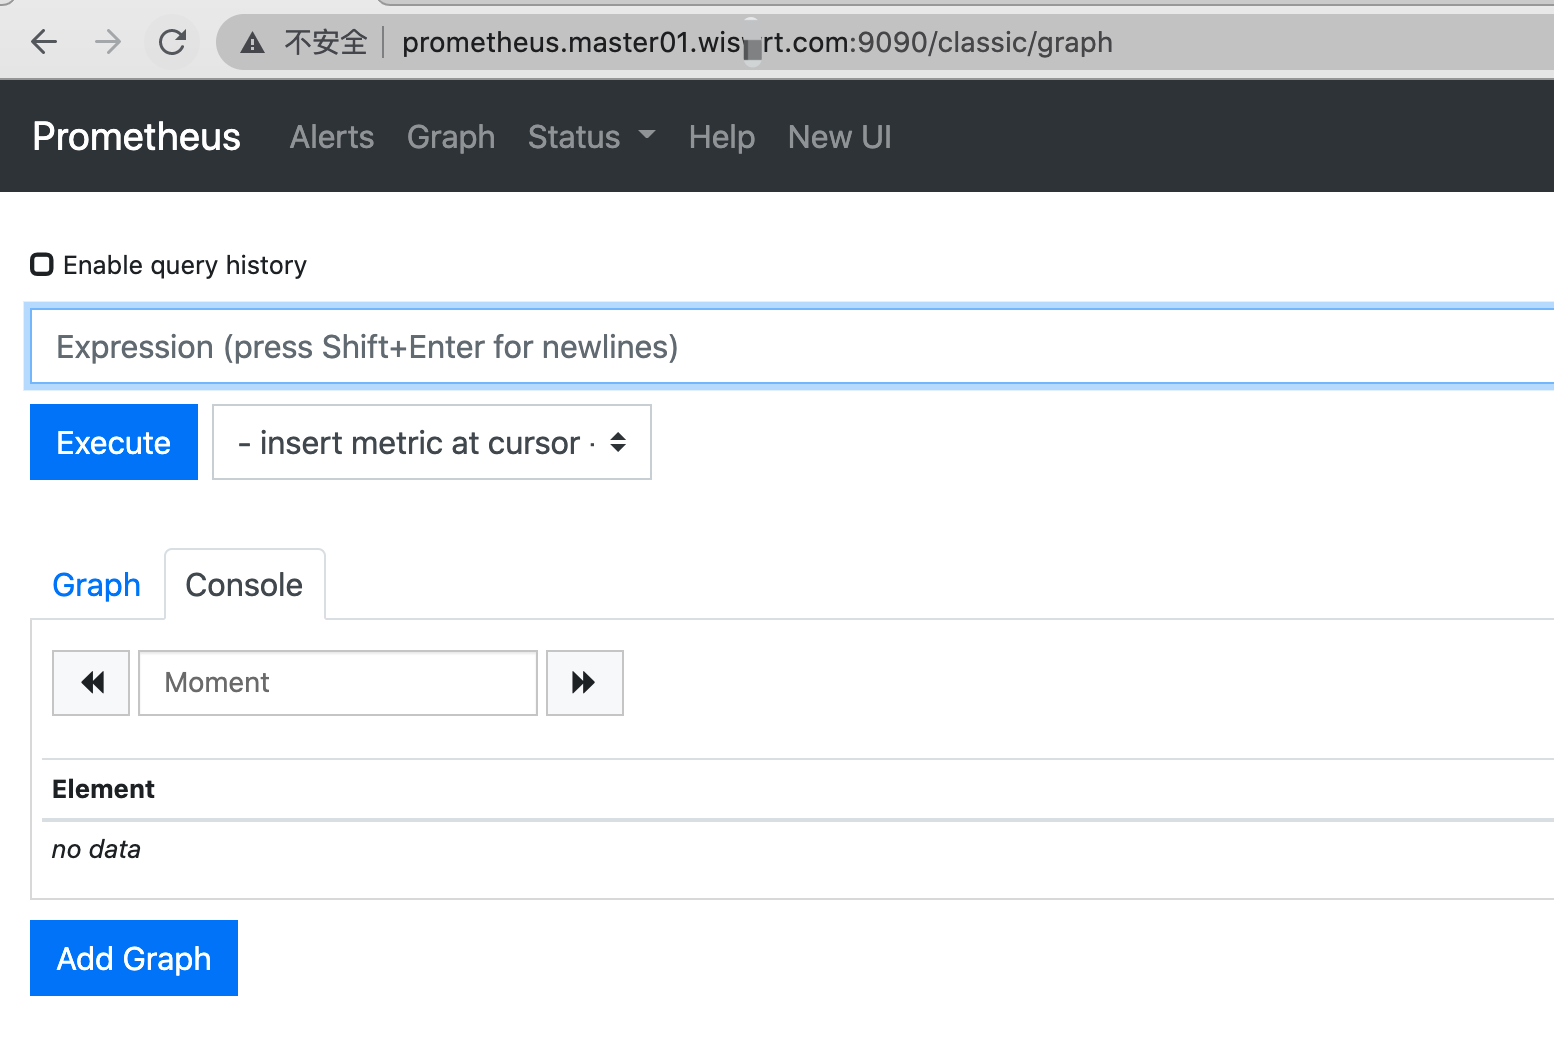
ansible-playbook -i host_file service_deploy.yaml -e "tgz=prometheus-2.25.2.linux-amd64.tar.gz" -e "app=prometheus"查看页面
prometheus配置文件解析
# 全局配置段global:# 采集间隔scrape_interval: 15s # Set the scrape interval to every 15 seconds. Default is every 1 minute.# 计算报警和预聚合间隔evaluation_interval: 15s # Evaluate rules every 15 seconds. The default is every 1 minute.# 采集超时时间scrape_timeout: 10s# 查询日志,包含各阶段耗时统计query_log_file: /opt/logs/prometheus_query_log# 全局标签组# 通过本实例采集的数据都会叠加下面的标签external_labels:account: 'huawei-main'region: 'beijng-01'# Alertmanager信息段alerting:alertmanagers:- scheme: httpstatic_configs:- targets:- "localhost:9093"# 告警、预聚合配置文件段rule_files:- /etc/prometheus/rules/record.yml- /etc/prometheus/rules/alert.yml# 采集配置段scrape_configs:# The job name is added as a label `job=<job_name>` to any timeseries scraped from this config.- job_name: 'prometheus'# metrics_path defaults to '/metrics'# scheme defaults to 'http'.static_configs:- targets: ['localhost:9090']# 远程查询段remote_read:# prometheus- url: http://prometheus/v1/readread_recent: true# m3db- url: "http://m3coordinator-read:7201/api/v1/prom/remote/read"read_recent: true# 远程写入段remote_write:- url: "http://m3coordinator-write:7201/api/v1/prom/remote/write"queue_config:capacity: 10000max_samples_per_send: 60000write_relabel_configs:- source_labels: [__name__]separator: ;# 标签key前缀匹配到的dropregex: '(kubelet_|apiserver_|container_fs_).*'replacement: $1action: drop
所以prometheus实例可以用来做下列用
对应的配置段 |
用途 |
|---|---|
| 采集配置段 | 做采集器,数据保存在本地 |
| 采集配置段 + 远程写入段 | 做采集器+传输器,数据保存在本地+远端存储 |
| 远程查询段 | 做查询器,查询远端存储数据 |
| 采集配置段 + 远程查询段 | 做采集器+查询器,查询本地数据+远端存储数据 |
| 采集配置段 + Alertmanager信息段 + 告警配置文件段 | 做采集器+告警触发器,查询本地数据生成报警发往Alertmanager |
| 远程查询段 + Alertmanager信息段 + 告警配置文件段 | 做远程告警触发器,查询远端数据生成报警发往Alertmanager |
| 远程查询段+远程写入段 + 预聚合配置文件段 | 做预聚合指标,生成的结果集指标写入远端存储 |
准备prometheus配置文件,配置采集两个node_exporter
global:scrape_interval: 15sscrape_timeout: 10sevaluation_interval: 15salerting:alertmanagers:- scheme: httptimeout: 10sapi_version: v1static_configs:- targets: []scrape_configs:- job_name: prometheushonor_timestamps: truescrape_interval: 15sscrape_timeout: 10smetrics_path: /metricsscheme: httpstatic_configs:- targets:- localhost:9090- job_name: node_exporterhonor_timestamps: truescrape_interval: 15sscrape_timeout: 10smetrics_path: /metricsscheme: httpstatic_configs:- targets:- 172.16.58.79:9100- 172.16.58.78:9100热更新配置# 命令行开启 --web.enable-lifecyclecurl -X POST http://localhost:9090/-/reload页面查看targets up情况

解说targets页面
- job分组情况
- endpoint实例地址
- state采集是否成功
- label标签组
- Last Scrape 上次采集到现在的间隔时间
- Scrape Duration 上次采集耗时
- Error 采集错误
通过api获取targets 详情
```yamlcoding=UTF-8
import requests
def print_targets(targets): index = 1 all = len(targets) for i in targets: scrapeUrl = i.get(“scrapeUrl”) state = i.get(“health”) labels = i.get(“labels”) lastScrape = i.get(“lastScrape”) lastScrapeDuration = i.get(“lastScrapeDuration”) lastError = i.get(“lastError”) if state==”up”: up_type = “正常” else: up_type = “异常” msg = “状态:{} num:{}/{} endpoint:{} state:{} labels:{} lastScrape:{} lastScrapeDuration:{} lastError:{}”.format(
up_type,index,all,scrapeUrl,state,str(labels),lastScrape,lastScrapeDuration,lastError,)print(msg)index+=1
def get_targets(t): f_data = {} try: uri = ‘http://{}/api/v1/targets'.format(t) res = requests.get(uri)
data = res.json().get("data")activeTargets = data.get("activeTargets")droppedTargets = data.get("droppedTargets")ups = []downs = []print_targets(activeTargets)print_targets(droppedTargets)except Exception as e:print(e)
get_targets(“prometheus.master01.wiswrt.com:9090”)
```


若有收获,就点个赞吧
0 人点赞
