- 基础设置
- master安装ansible
- 浏览器访问
- 本机访问数据
- 默认开启的采集项目介绍
- 关闭默认开启采集项
- 关闭默认采集器项而开机器某些采集
- 禁用golang sdk 指标
- HELP go_goroutines Number of goroutines that currently exist.
- TYPE go_goroutines gauge
- HELP go_info Information about the Go environment.
- TYPE go_info gauge
- HELP go_memstats_alloc_bytes Number of bytes allocated and still in use.
- TYPE go_memstats_alloc_bytes gauge
- 创建目录
- 准备 prom文件
- HELP nyy_test_metric just test
- TYPE nyy_test_metric gauge
- 启动服务
- curl查看数据
- HELP nyy_test_metric just test
- TYPE nyy_test_metric gauge
基础设置
配置hosts172.16.58.78 prome-master01172.16.58.79 prome-node01master上生成ssh key 并拷贝到node上ssh-keygenssh-copy-id prome_node_01# 测试ssh联通ssh prome_node_01
master安装ansible
yum install -y ansible# 关闭hostcheckvim /etc/ansible/ansible.cfgssh_args = -o ControlMaster=auto -o ControlPersist=60s -o StrictHostKeyChecking=noplaybook执行时需要设置机器文件cat <<EOF > /opt/tgzs/host_fileprome-master01prome-node01EOF设置syslog 和logrotate服务ansible-playbook -i host_file init_syslog_logrotate.yaml编写ansible 发布服务脚本ansible-playbook -i host_file service_deploy.yaml -e "tgz=node_exporter-1.1.2.linux-amd64.tar.gz" -e "app=node_exporter"检查node_exporter服务状态ansible -i host_file all -m shell -a " ps -ef |grep node_exporter|grep -v grep "
init_syslog_logrotate.yaml
service_deploy.yaml
浏览器访问
IP:9100/metricsIP:9100/metrics
本机访问数据
[root@prome_master_01 tgzs]# curl -s localhost:9100/metrics |grep node_ |head -20# HELP node_arp_entries ARP entries by device# TYPE node_arp_entries gaugenode_arp_entries{device="eth0"} 3# HELP node_boot_time_seconds Node boot time, in unixtime.# TYPE node_boot_time_seconds gaugenode_boot_time_seconds 1.616987084e+09# HELP node_context_switches_total Total number of context switches.# TYPE node_context_switches_total counternode_context_switches_total 2.105979e+06# HELP node_cooling_device_cur_state Current throttle state of the cooling device# TYPE node_cooling_device_cur_state gaugenode_cooling_device_cur_state{name="0",type="Processor"} 0node_cooling_device_cur_state{name="1",type="Processor"} 0node_cooling_device_cur_state{name="2",type="Processor"} 0node_cooling_device_cur_state{name="3",type="Processor"} 0# HELP node_cooling_device_max_state Maximum throttle state of the cooling device# TYPE node_cooling_device_max_state gaugenode_cooling_device_max_state{name="0",type="Processor"} 0node_cooling_device_max_state{name="1",type="Processor"} 0node_cooling_device_max_state{name="2",type="Processor"} 0
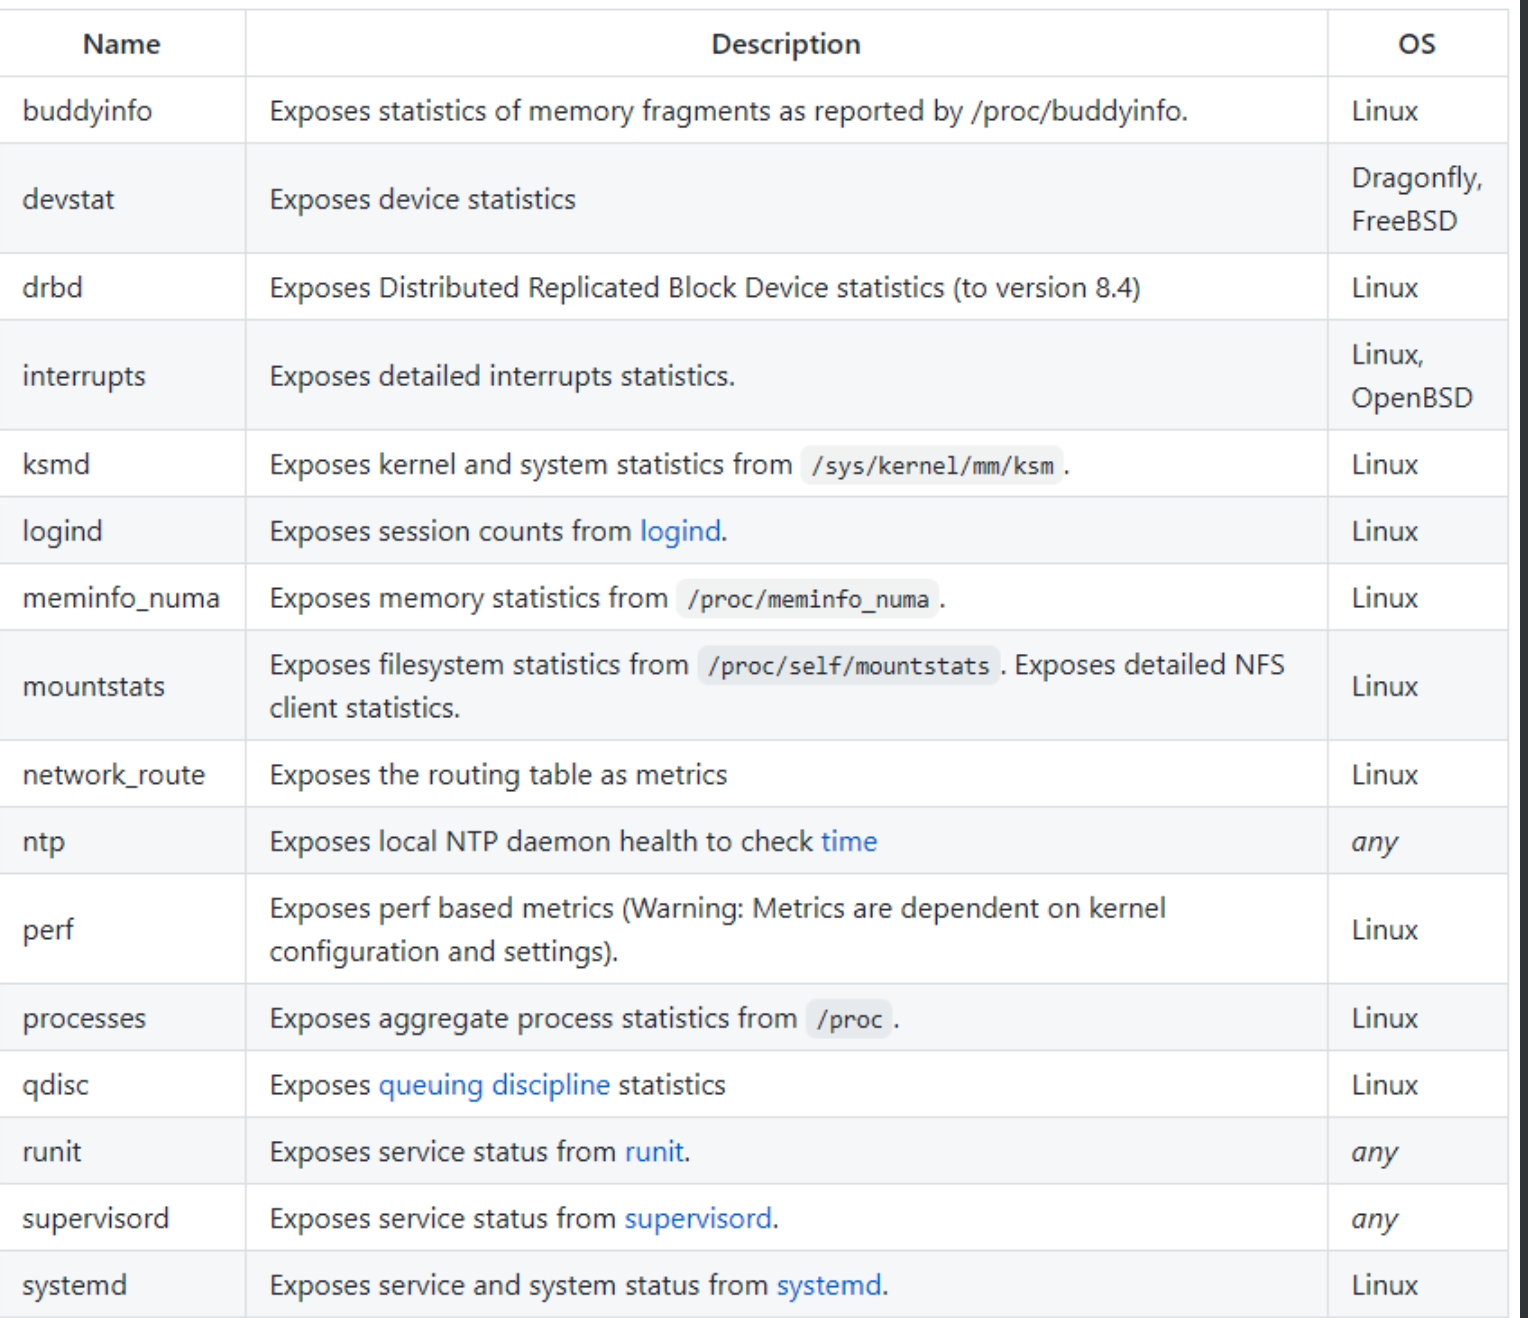
默认开启的采集项目介绍

关闭默认开启采集项
--no-collector.<name> flag# 未开启前[root@prome_master_01 node_exporter]# curl -s localhost:9100/metrics |grep node_cpu# HELP node_cpu_guest_seconds_total Seconds the CPUs spent in guests (VMs) for each mode.# TYPE node_cpu_guest_seconds_total counternode_cpu_guest_seconds_total{cpu="0",mode="nice"} 0node_cpu_guest_seconds_total{cpu="0",mode="user"} 0node_cpu_guest_seconds_total{cpu="1",mode="nice"} 0node_cpu_guest_seconds_total{cpu="1",mode="user"} 0node_cpu_guest_seconds_total{cpu="2",mode="nice"} 0node_cpu_guest_seconds_total{cpu="2",mode="user"} 0node_cpu_guest_seconds_total{cpu="3",mode="nice"} 0node_cpu_guest_seconds_total{cpu="3",mode="user"} 0# HELP node_cpu_seconds_total Seconds the CPUs spent in each mode.# TYPE node_cpu_seconds_total counternode_cpu_seconds_total{cpu="0",mode="idle"} 17691.27node_cpu_seconds_total{cpu="0",mode="iowait"} 8.9node_cpu_seconds_total{cpu="0",mode="irq"} 0node_cpu_seconds_total{cpu="0",mode="nice"} 0.32node_cpu_seconds_total{cpu="0",mode="softirq"} 0.28node_cpu_seconds_total{cpu="0",mode="steal"} 2.7# 关闭cpu采集./node_exporter --no-collector.cpucurl -s localhost:9100/metrics |grep node_cpu
关闭默认采集器项而开机器某些采集
--collector.disable-defaults --collector.<name> .# 只开启mem采集./node_exporter --collector.disable-defaults --collector.meminfo# 只开启mem 和cpu 采集./node_exporter --collector.disable-defaults --collector.meminfo --collector.cpu
默认关闭的关闭原因
- 太重
- 太慢
- 太多的开销
禁用golang sdk 指标
- 使用
--web.disable-exporter-metrics promhttp_代表访问/metrics的http情况
go_代表goruntime信息等 ```bash[root@prome_master_01 tgzs]# curl -s localhost:9100/metrics |grep promhttp_# HELP promhttp_metric_handler_errors_total Total number of internal errors encountered by the promhttp metric handler.# TYPE promhttp_metric_handler_errors_total counterpromhttp_metric_handler_errors_total{cause="encoding"} 0promhttp_metric_handler_errors_total{cause="gathering"} 0# HELP promhttp_metric_handler_requests_in_flight Current number of scrapes being served.# TYPE promhttp_metric_handler_requests_in_flight gaugepromhttp_metric_handler_requests_in_flight 1# HELP promhttp_metric_handler_requests_total Total number of scrapes by HTTP status code.# TYPE promhttp_metric_handler_requests_total counterpromhttp_metric_handler_requests_total{code="200"} 8promhttp_metric_handler_requests_total{code="500"} 0promhttp_metric_handler_requests_total{code="503"} 0
HELP go_goroutines Number of goroutines that currently exist.
TYPE go_goroutines gauge
go_goroutines 7HELP go_info Information about the Go environment.
TYPE go_info gauge
go_info{version=”go1.15.8”} 1HELP go_memstats_alloc_bytes Number of bytes allocated and still in use.
TYPE go_memstats_alloc_bytes gauge
go_memstats_alloc_bytes 2.781752e+06
- process 代表进程信息等```bash# HELP process_cpu_seconds_total Total user and system CPU time spent in seconds.# TYPE process_cpu_seconds_total counterprocess_cpu_seconds_total 0.54# HELP process_max_fds Maximum number of open file descriptors.# TYPE process_max_fds gaugeprocess_max_fds 1024# HELP process_open_fds Number of open file descriptors.# TYPE process_open_fds gaugeprocess_open_fds 9# HELP process_resident_memory_bytes Resident memory size in bytes.# TYPE process_resident_memory_bytes gaugeprocess_resident_memory_bytes 1.5720448e+07
节点上自打点数据上报
- —collector.textfile.directory=”” 配置本地采集目录
- 在采集目录里创建.prom文件
```bash
创建目录
mkdir ./text_file_dir准备 prom文件
cat <./text_file_dir/test.prom HELP nyy_test_metric just test
TYPE nyy_test_metric gauge
nyy_test_metric{method=”post”,code=”200”} 1027 EOF
启动服务
./node_exporter —collector.textfile.directory=./text_file_dir
curl查看数据
[root@prome_master_01 tgzs]# curl -s localhost:9100/metrics |grep nyy
HELP nyy_test_metric just test
TYPE nyy_test_metric gauge
nyy_test_metric{code=”200”,method=”post”} 1027
http传入参数,按采集器过滤指标原理:通过http请求参数过滤采集器```gofunc (h *handler) ServeHTTP(w http.ResponseWriter, r *http.Request) {filters := r.URL.Query()["collect[]"]level.Debug(h.logger).Log("msg", "collect query:", "filters", filters)if len(filters) == 0 {// No filters, use the prepared unfiltered handler.h.unfilteredHandler.ServeHTTP(w, r)return}// To serve filtered metrics, we create a filtering handler on the fly.filteredHandler, err := h.innerHandler(filters...)if err != nil {level.Warn(h.logger).Log("msg", "Couldn't create filtered metrics handler:", "err", err)w.WriteHeader(http.StatusBadRequest)w.Write([]byte(fmt.Sprintf("Couldn't create filtered metrics handler: %s", err)))return}filteredHandler.ServeHTTP(w, r)}
http访问
# 只看cpu采集器的指标http://IP:9100/metrics?collect[]=cpu# 只看cpu和mem采集器的指标http://IP:9100/metrics?collect[]=cpu&collect[]=meminfo
prometheus配置
params:collect[]:- cpu- meminfo两种导入模式- url导入- json文件导入
- 和prometheus
relabel_config的区别 :按采集器过滤 VS 按metric_name 或label过滤 - 导入dashboard商城中的node_exporter模板
- 地址 https://grafana.com/grafana/dashboards
两种导入模式
- url导入
- json文件导入
https://grafana.com/grafana/dashboards/8919
配置数据源


验证


手动安装node exporter
上传软件包到/server下
tar xf node_exporter-1.1.2.linux-amd64.tar.gz -C /optcd /opt/node_exporter-1.1.2.linux-amd64/mv node_exporter /usr/local/bin/cat /etc/systemd/system/node_exporter.service[Unit]Description=Node ExporterAfter=network.target[Service]User=rootGroup=rootType=simpleExecStart=/usr/local/bin/node_exporter[Install]WantedBy=multi-user.target1016 systemctl daemon-reload1017 systemctl start node_exporter1018 systemctl status node_exporter.service1019 systemctl enable node_exporter1020 curl localhost:9100/metrics
普罗米修斯端配置
[root@Server-d0449e6d-d612-49ba-80cc-070b579955d6 prometheus-2.25.2.linux-amd64]# cat prometheus.yml- job_name: node_exporterhonor_timestamps: truescrape_interval: 15sscrape_timeout: 10smetrics_path: /metricsscheme: http 采集方式默认httpstatic_configs:- targets: 采集两台node- 192.168.0.107:7100- 192.168.0.56:9100

targets解说
- job 分组情况- endpoint 实例地址- state 采集是否成功- label 标签组- Last Scrape 上次采集到现在的间隔时间- Scrape Duration 上次采集耗时- Error 采集错误

若有收获,就点个赞吧
0 人点赞
