mBlock-Python Editor support Python 3 programming. You can use it like other Python editors to create and run a Python 3 project.
This section uses a liquid chart as an example.
- Install the Python library required.
In this example, the pyecharts library is required. For details about how to install a Python library, see “Install or Uninstall Python Libraries.”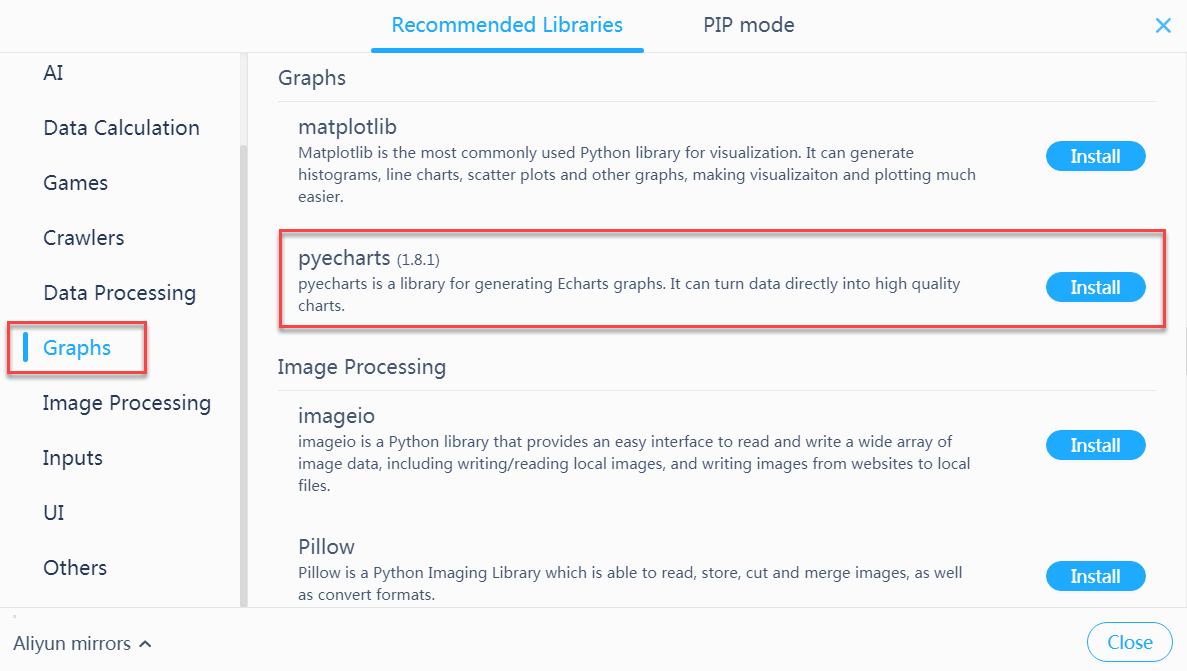
2. Choose File > New project, and enter your code in the project file editing area.
Enter the following code: ```python from pyecharts import options as opts from pyecharts.charts import Liquid, Page from pyecharts.globals import SymbolType import os def liquid() -> Liquid: c = (
) return cLiquid().add("lq", [0.67, 0.30, 0.15]).set_global_opts(title_opts=opts.TitleOpts(title="Liquid"))
liquid().render(‘liquid.html’)
os.system(“open liquid.html”)
```
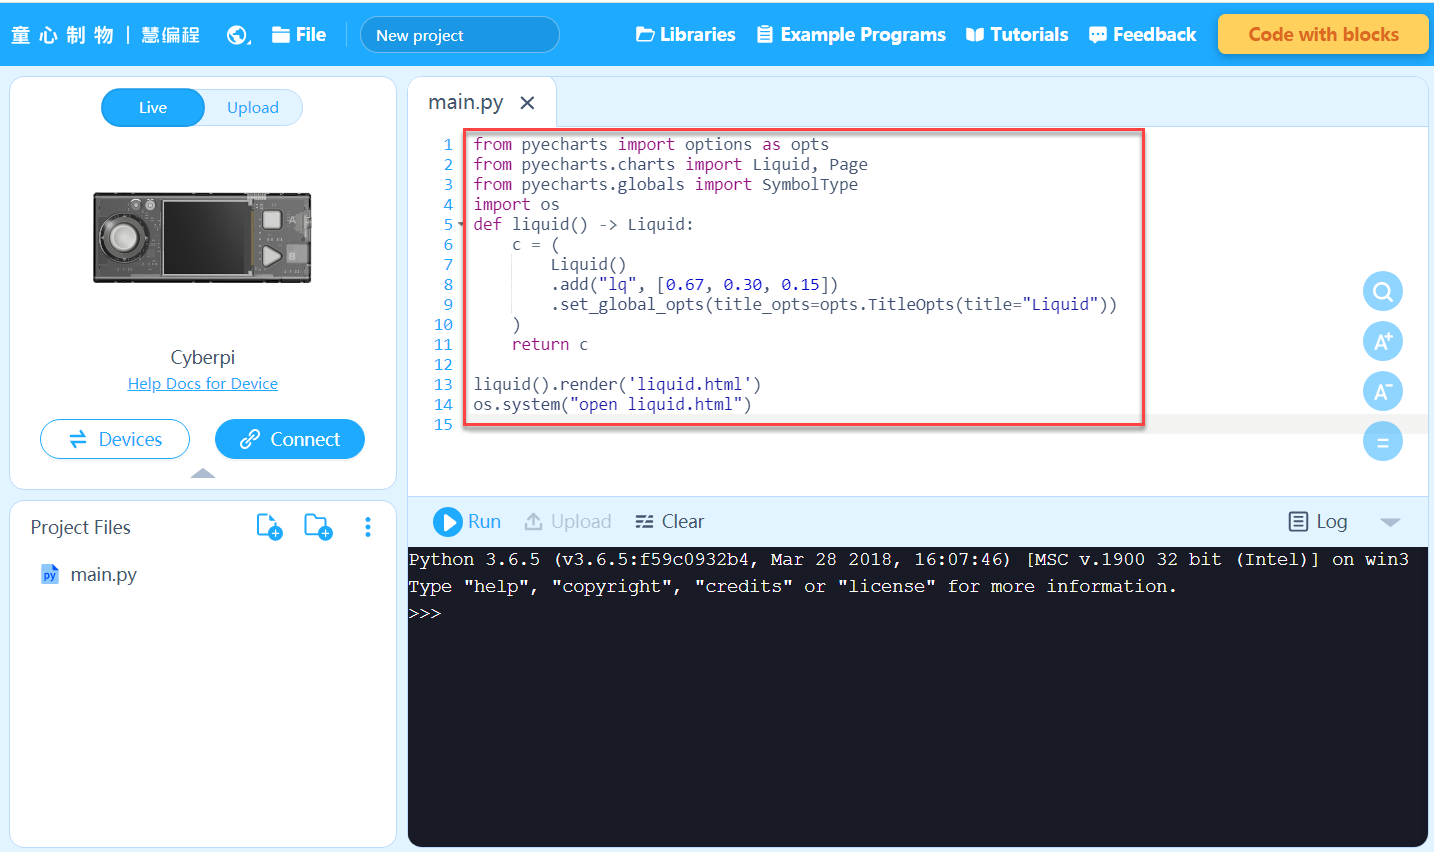
3. Click Run.
An HTML file is generated in the Project Files area.
Open the file. You can see a dynamic liquid chart.
For more details about Python 3, see “Python Learning.”

若有收获,就点个赞吧
0 人点赞
