The pyecharts library is used to visualize data.
The following shows a liquid chart.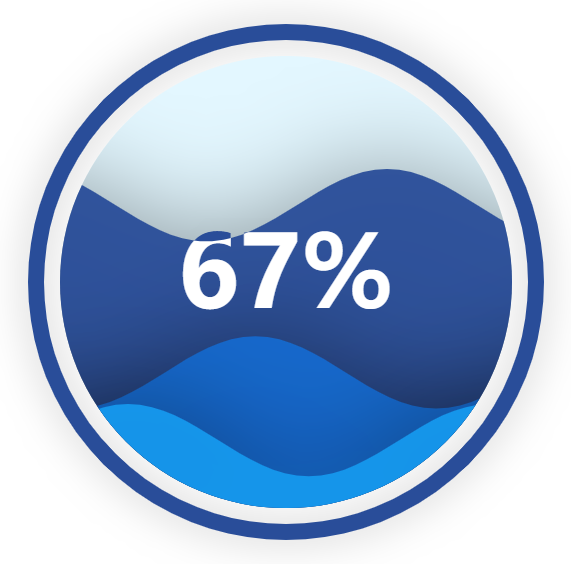
from pyecharts import options as optsfrom pyecharts.charts import Liquid, Pagefrom pyecharts.globals import SymbolTypeimport osdef liquid() -> Liquid:c = (Liquid().add("lq", [0.67, 0.30, 0.15]).set_global_opts(title_opts=opts.TitleOpts(title="Liquid")))return cliquid().render('liquid.html')os.system("open liquid.html")
The pyecharts library provides many other functions. You can download the following example programs to view data into various charts.

若有收获,就点个赞吧
0 人点赞
