https://github.com/prometheus-operator
https://prometheus.fuckcloudnative.io
https://yunlzheng.gitbook.io/prometheus-book
helm
https://github.com/prometheus-community/helm-charts
kube-prometheus
https://github.com/prometheus-operator/kube-prometheus
- The Prometheus Operator
- Highly available Prometheus
- Highly available Alertmanager
- Prometheus node-exporter
- Prometheus Adapter for Kubernetes Metrics APIs
- kube-state-metrics
Prometheus
- Alertmanager
- ServiceMonitor
- PodMonitor
- Probe
- ThanosRuler
- PrometheusRule
- AlertmanagerConfig
告警规则
https://github.com/junotx/mixin
CRD组件:
prometheus-operator
prometheus-operated
alertmanager-operated
thanos-ruler-operated
notification-manager-operator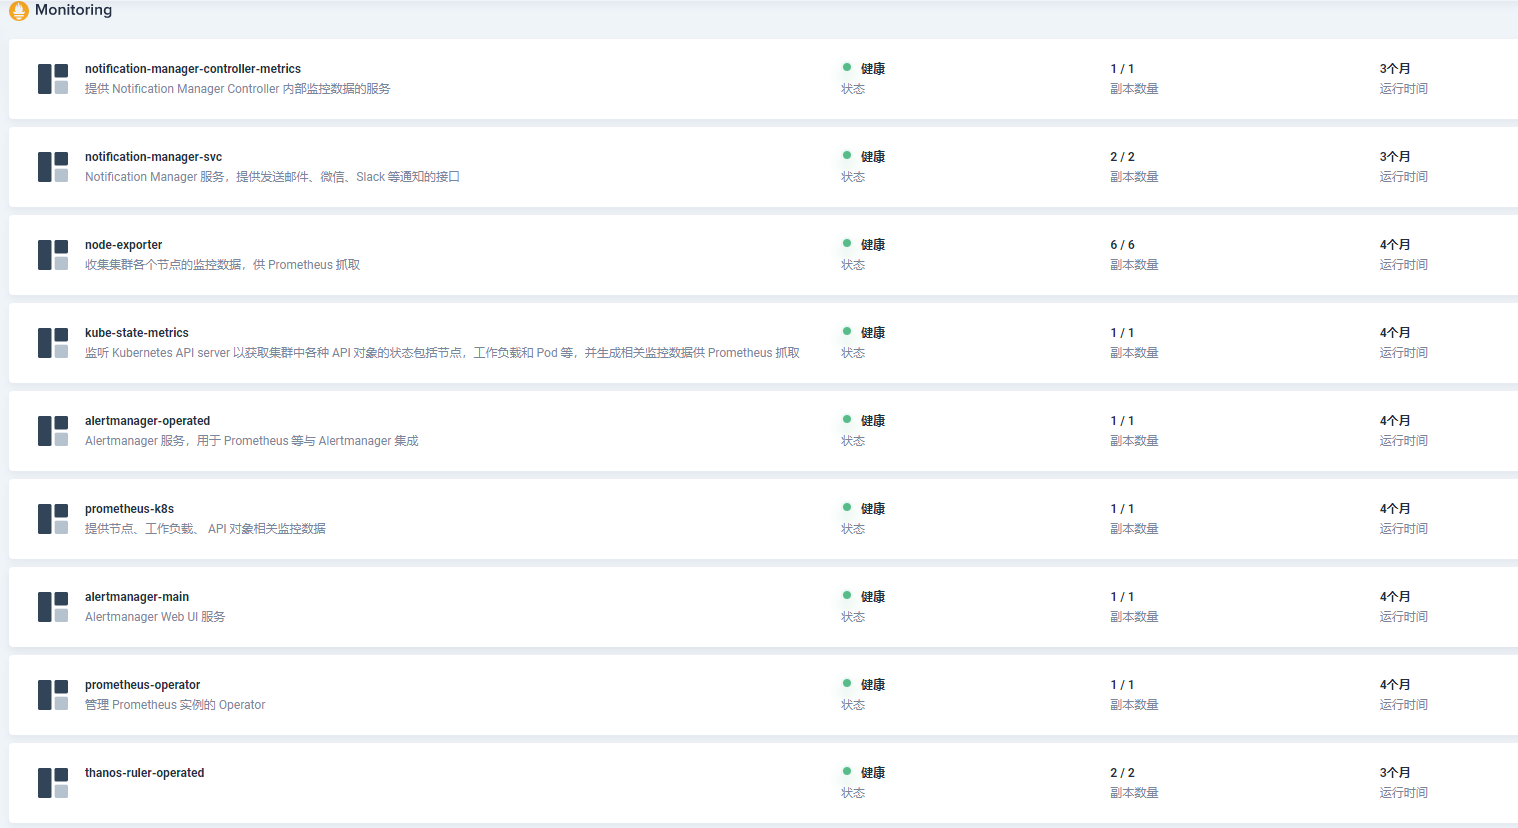

[root@UR-20210425NAMA ~]# kubectl -n kubesphere-monitoring-system get allNAME READY STATUS RESTARTS AGEpod/alertmanager-main-0 2/2 Running 0 16dpod/kube-state-metrics-7f65879cfd-txvh8 3/3 Running 0 4d14hpod/node-exporter-c44m7 2/2 Running 0 19mpod/node-exporter-l9sws 2/2 Running 0 20mpod/node-exporter-lk7b9 2/2 Running 0 20mpod/node-exporter-wshw5 2/2 Running 0 19mpod/node-exporter-zk466 2/2 Running 0 20mpod/node-exporter-znd6l 2/2 Running 0 20mpod/notification-manager-deployment-674dddcbd9-cwwx6 1/1 Running 1 16dpod/notification-manager-deployment-674dddcbd9-z8f2j 1/1 Running 0 4d14hpod/notification-manager-operator-7877c6574f-ns68t 2/2 Running 3 4d14hpod/prometheus-k8s-0 3/3 Running 1 16dpod/prometheus-operator-7d7684fc68-chjl2 2/2 Running 1 16dpod/thanos-ruler-kubesphere-0 2/2 Running 0 4d13hpod/thanos-ruler-kubesphere-1 2/2 Running 0 34dNAME TYPE CLUSTER-IP EXTERNAL-IP PORT(S) AGEservice/alertmanager-main ClusterIP 172.26.94.130 <none> 9093/TCP 125dservice/alertmanager-operated ClusterIP None <none> 9093/TCP,9094/TCP,9094/UDP 125dservice/kube-state-metrics ClusterIP None <none> 8443/TCP,9443/TCP 125dservice/node-exporter ClusterIP None <none> 9100/TCP 125dservice/notification-manager-controller-metrics ClusterIP 172.26.201.224 <none> 8443/TCP96dservice/notification-manager-svc ClusterIP 172.26.224.139 <none> 19093/TCP96dservice/prometheus-k8s NodePort 172.26.128.137 <none> 9090:30890/TCP125dservice/prometheus-operated ClusterIP None <none> 9090/TCP125dservice/prometheus-operator ClusterIP None <none> 8443/TCP125dservice/thanos-ruler-operated ClusterIP None <none> 10902/TCP,10901/TCP 96dNAME DESIRED CURRENT READY UP-TO-DATE AVAILABLE NODE SELECTOR AGEdaemonset.apps/node-exporter 6 6 6 6 6 kubernetes.io/os=linux 125dNAME READY UP-TO-DATE AVAILABLE AGEdeployment.apps/kube-state-metrics 1/1 1 1 125ddeployment.apps/notification-manager-deployment 2/2 2 2 96ddeployment.apps/notification-manager-operator 1/1 1 1 96ddeployment.apps/prometheus-operator 1/1 1 1 125dNAME DESIRED CURRENT READY AGEreplicaset.apps/kube-state-metrics-7f65879cfd 1 1 1 96dreplicaset.apps/kube-state-metrics-95c974544 0 0 0 125dreplicaset.apps/notification-manager-deployment-674dddcbd9 2 2 2 96dreplicaset.apps/notification-manager-operator-7877c6574f 1 1 1 96dreplicaset.apps/prometheus-operator-7d7684fc68 1 1 1 96dreplicaset.apps/prometheus-operator-84d58bf775 0 0 0 125dNAME READY AGEstatefulset.apps/alertmanager-main 1/1 125dstatefulset.apps/prometheus-k8s 1/1 125dstatefulset.apps/thanos-ruler-kubesphere 2/2 96dNAME COMPLETIONS DURATION AGEjob.batch/prometheus-pvc-cleanup-1624634100 0/1 89d 89dNAME SCHEDULE SUSPEND ACTIVE LAST SCHEDULE AGEcronjob.batch/prometheus-pvc-cleanup 15 23 25 6 * False 0 89d 125d[root@UR-20210425NAMA ~]#[root@UR-20210425NAMA ~]# kubectl -n kubesphere-monitoring-system get allNAME READY STATUS RESTARTS AGEpod/alertmanager-main-0 2/2 Running 0 16dpod/kube-state-metrics-7f65879cfd-txvh8 3/3 Running 0 4d14hpod/node-exporter-c44m7 2/2 Running 0 24mpod/node-exporter-l9sws 2/2 Running 0 25mpod/node-exporter-lk7b9 2/2 Running 0 25mpod/node-exporter-wshw5 2/2 Running 0 24mpod/node-exporter-zk466 2/2 Running 0 25mpod/node-exporter-znd6l 2/2 Running 0 25mpod/notification-manager-deployment-674dddcbd9-cwwx6 1/1 Running 1 16dpod/notification-manager-deployment-674dddcbd9-z8f2j 1/1 Running 0 4d14hpod/notification-manager-operator-7877c6574f-ns68t 2/2 Running 3 4d14hpod/prometheus-k8s-0 3/3 Running 1 16dpod/prometheus-operator-7d7684fc68-chjl2 2/2 Running 1 16dpod/thanos-ruler-kubesphere-0 2/2 Running 0 4d14hpod/thanos-ruler-kubesphere-1 2/2 Running 0 34dNAME TYPE CLUSTER-IP EXTERNAL-IP PORT(S) AGEservice/alertmanager-main ClusterIP 172.26.94.130 <none> 9093/TCP 125dservice/alertmanager-operated ClusterIP None <none> 9093/TCP,9094/TCP,9094/UDP 125dservice/kube-state-metrics ClusterIP None <none> 8443/TCP,9443/TCP 125dservice/node-exporter ClusterIP None <none> 9100/TCP 125dservice/notification-manager-controller-metrics ClusterIP 172.26.201.224 <none> 8443/TCP96dservice/notification-manager-svc ClusterIP 172.26.224.139 <none> 19093/TCP96dservice/prometheus-k8s NodePort 172.26.128.137 <none> 9090:30890/TCP125dservice/prometheus-operated ClusterIP None <none> 9090/TCP125dservice/prometheus-operator ClusterIP None <none> 8443/TCP125dservice/thanos-ruler-operated ClusterIP None <none> 10902/TCP,10901/TCP 96dNAME DESIRED CURRENT READY UP-TO-DATE AVAILABLE NODE SELECTOR AGEdaemonset.apps/node-exporter 6 6 6 6 6 kubernetes.io/os=linux 125dNAME READY UP-TO-DATE AVAILABLE AGEdeployment.apps/kube-state-metrics 1/1 1 1 125ddeployment.apps/notification-manager-deployment 2/2 2 2 96ddeployment.apps/notification-manager-operator 1/1 1 1 96ddeployment.apps/prometheus-operator 1/1 1 1 125dNAME DESIRED CURRENT READY AGEreplicaset.apps/kube-state-metrics-7f65879cfd 1 1 1 96dreplicaset.apps/kube-state-metrics-95c974544 0 0 0 125dreplicaset.apps/notification-manager-deployment-674dddcbd9 2 2 2 96dreplicaset.apps/notification-manager-operator-7877c6574f 1 1 1 96dreplicaset.apps/prometheus-operator-7d7684fc68 1 1 1 96dreplicaset.apps/prometheus-operator-84d58bf775 0 0 0 125dNAME READY AGEstatefulset.apps/alertmanager-main 1/1 125dstatefulset.apps/prometheus-k8s 1/1 125dstatefulset.apps/thanos-ruler-kubesphere 2/2 96dNAME COMPLETIONS DURATION AGEjob.batch/prometheus-pvc-cleanup-1624634100 0/1 89d 89dNAME SCHEDULE SUSPEND ACTIVE LAST SCHEDULE AGEcronjob.batch/prometheus-pvc-cleanup 15 23 25 6 * False 0 89d 125d[root@UR-20210425NAMA ~]#
[root@UR-20210425NAMA ~]# kubectl -n kubesphere-monitoring-system get podNAME READY STATUS RESTARTS AGEalertmanager-main-0 2/2 Running 0 16dkube-state-metrics-7f65879cfd-txvh8 3/3 Running 0 4d14hnode-exporter-c44m7 2/2 Running 0 25mnode-exporter-l9sws 2/2 Running 0 25mnode-exporter-lk7b9 2/2 Running 0 25mnode-exporter-wshw5 2/2 Running 0 25mnode-exporter-zk466 2/2 Running 0 25mnode-exporter-znd6l 2/2 Running 0 25mnotification-manager-deployment-674dddcbd9-cwwx6 1/1 Running 1 16dnotification-manager-deployment-674dddcbd9-z8f2j 1/1 Running 0 4d14hnotification-manager-operator-7877c6574f-ns68t 2/2 Running 3 4d14hprometheus-k8s-0 3/3 Running 1 16dprometheus-operator-7d7684fc68-chjl2 2/2 Running 1 16dthanos-ruler-kubesphere-0 2/2 Running 0 4d14hthanos-ruler-kubesphere-1 2/2 Running 0 34d[root@UR-20210425NAMA ~]#
[root@UR-20210425NAMA ~]# kubectl -n kubesphere-monitoring-system get statefulsetNAME READY AGEalertmanager-main 1/1 125dprometheus-k8s 1/1 125dthanos-ruler-kubesphere 2/2 96d[root@UR-20210425NAMA ~]# kubectl -n kubesphere-monitoring-system get deploymentNAME READY UP-TO-DATE AVAILABLE AGEkube-state-metrics 1/1 1 1 125dnotification-manager-deployment 2/2 2 2 96dnotification-manager-operator 1/1 1 1 96dprometheus-operator 1/1 1 1 125d
CRD 资源
[root@UR-20210425NAMA ~]# kubectl get crd | grep coreosalertmanagers.monitoring.coreos.com 2021-05-20T10:26:22Zpodmonitors.monitoring.coreos.com 2021-05-20T10:26:22Zprobes.monitoring.coreos.com 2021-06-18T14:55:50Zprometheuses.monitoring.coreos.com 2021-05-20T10:26:23Zprometheusrules.monitoring.coreos.com 2021-05-20T10:26:23Zservicemonitors.monitoring.coreos.com 2021-05-20T10:26:24Zthanosrulers.monitoring.coreos.com 2021-05-20T10:26:24Z[root@UR-20210425NAMA ~]#
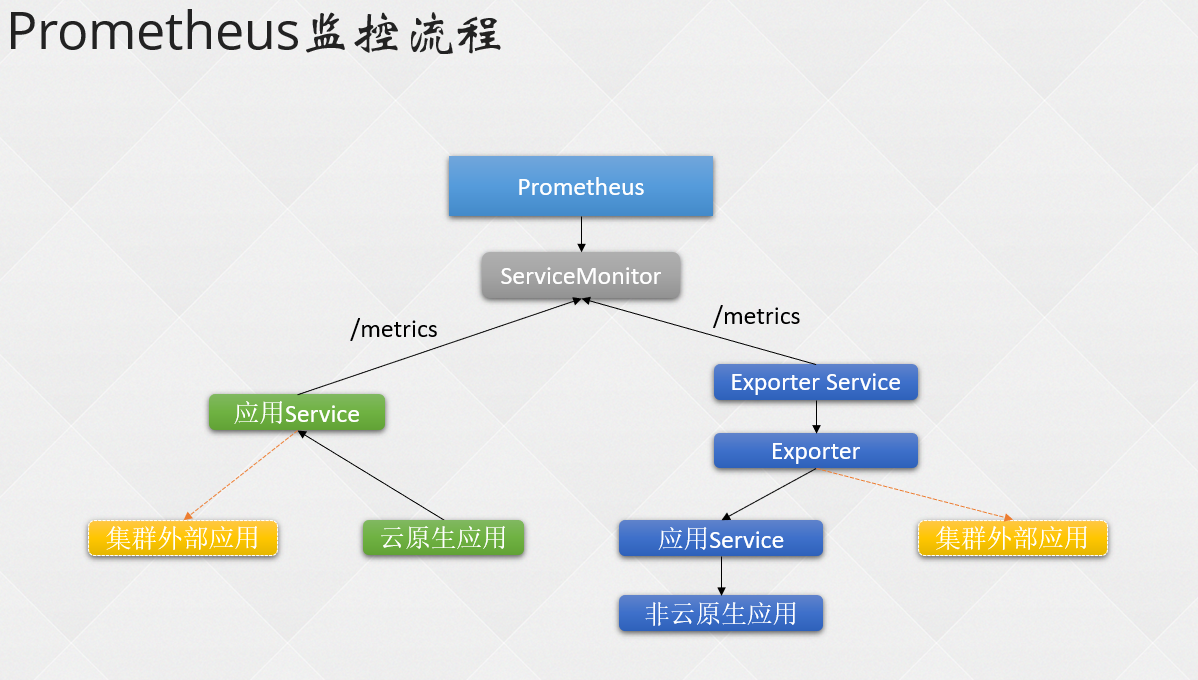
ServiceMonitor —/metrics —-service
apiVersion: monitoring.coreos.com/v1kind: ServiceMonitormetadata:labels:k8s-app: kube-schedulername: kube-schedulernamespace: monitoringspec:endpoints:- interval: 30s # 每30s获取一次信息port: http-metrics # 对应service的端口名jobLabel: k8s-appnamespaceSelector: # 表示去匹配某一命名空间中的service,如果想从所有的namespace中匹配用any: truematchNames:- kube-systemselector: # 匹配的 Service 的labels,如果使用mathLabels,则下面的所有标签都匹配时才会匹配该service,如果使用matchExpressions,则至少匹配一个标签的service都会被选择matchLabels:k8s-app: kube-scheduler
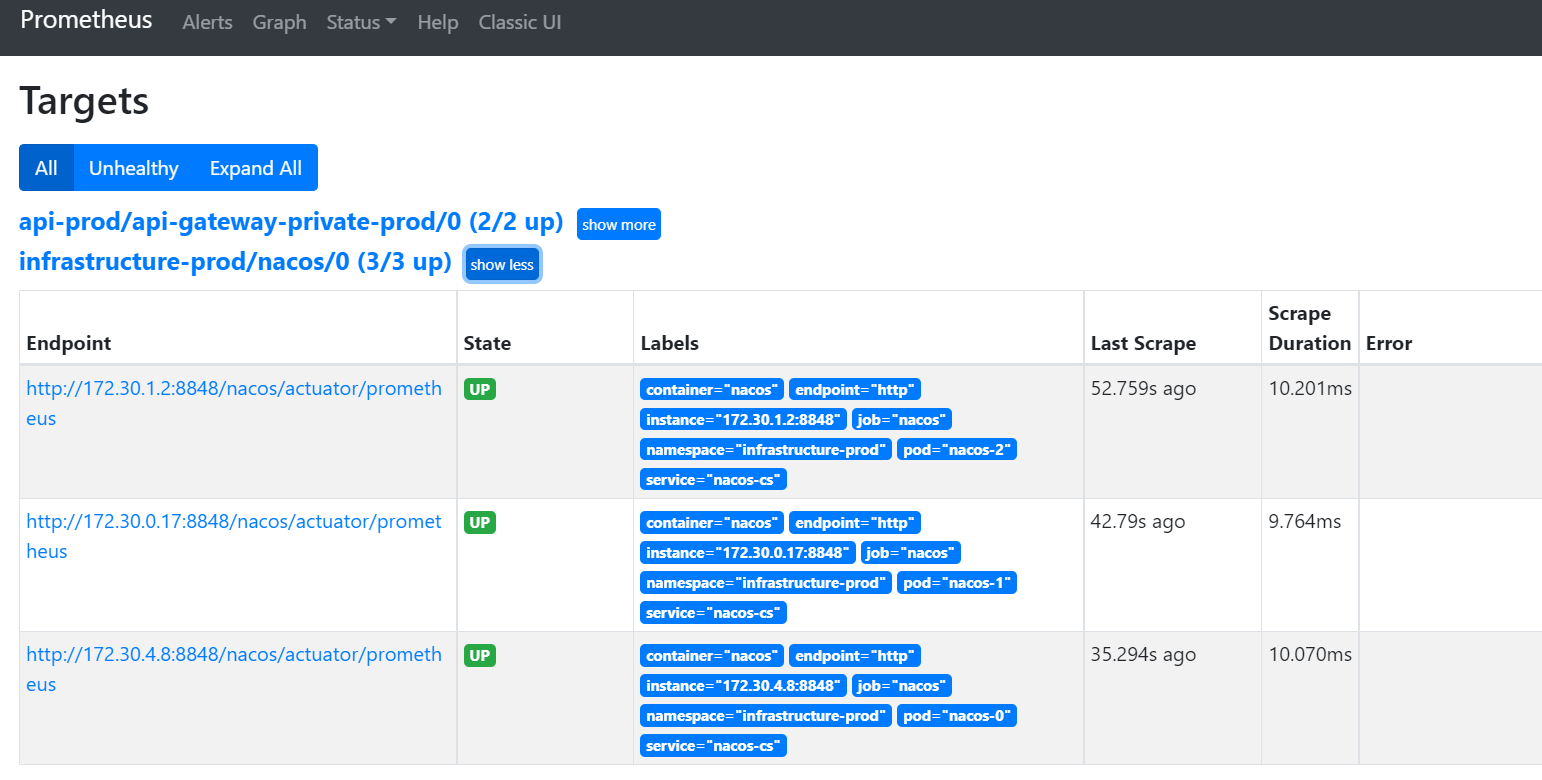
[root@UR-20210425NAMA ~]# kubectl get servicemonitor -ANAMESPACE NAME AGEkubesphere-monitoring-system alertmanager 126dkubesphere-monitoring-system coredns 126dkubesphere-monitoring-system etcd 126dkubesphere-monitoring-system grafana 7h15mkubesphere-monitoring-system kube-apiserver 126dkubesphere-monitoring-system kube-controller-manager 126dkubesphere-monitoring-system kube-scheduler 126dkubesphere-monitoring-system kube-state-metrics 126dkubesphere-monitoring-system kubelet 126dkubesphere-monitoring-system node-exporter 126dkubesphere-monitoring-system prometheus 126dkubesphere-monitoring-system prometheus-operator 126dkubesphere-monitoring-system s2i-operator 126dur-api-dev-test-project api-dev-test 8hur-api-dev-test-project ur-api-gateway-test-project 8hur-api-esb-test-project api-esb-test 29dur-api-gateway-test-project api-gateway-private-test 27dur-api-gateway-test-project api-gateway-public-test 8h[root@UR-20210425NAMA ~]#
[root@UR-20210425NAMA ~]# kubectl -n kubesphere-monitoring-system get prometheusrulesNAME AGEcustom-alerting-rule-zpnmw 99dprometheus-k8s-etcd-rules 128dprometheus-k8s-rules 128d[root@UR-20210425NAMA ~]#
PromQL数据类型
即时向量 instant vector
区间向量 range vector
标量 scalar
字符串 string
Metric类型
Conter
Gauge
Histogram
Summary
PromQL聚合操作
- sum (求和)
- min (最小值)
- max (最大值)
- avg (平均值)
- stddev (标准差)
- stdvar (标准差异)
- count (计数)
- count_values (对value进行计数)
- bottomk (后n条时序)
- topk (前n条时序)
- quantile (分布统计) ```yaml PromQL操作符 一、二元操作符 Prometheus的查询语言支持基本的逻辑运算和算术运算。对于两个瞬时向量, 匹配行为可以被改变。
1.1 算术二元运算符 在Prometheus支持下面的二元算术操作符:
- 加法 – 减法
- 乘法 / 除法 % 模 ^ 幂等 二元运算操作符定义在scalar/scalar(标量/标量)、vector/scalar(向量/标量)、和vector/vector(向量/向量)之间。
在两个标量之间:评估另一个标量,这是运算符应用于两个标量操作数的结果。 在瞬时向量和标量之间:将运算符应用于向量中的每个数据样本的值。 如果时间序列即时向量乘以2,则结果是另一个向量,其中原始向量的每个样本值乘以2。 在两个瞬时向量之间:应用于左侧向量中的每个条目及其右侧向量中的匹配元素。 结果将传播到结果向量中。 右侧向量中(没有匹配条目)不是结果的一部分。 1.2 比较二元操作符 在Prometheus系统中,比较二元操作符有:
== 等于 != 不等于
大于 < 小于 = 大于等于 <= 小于等于 比较二元操作符定义在scalar/scalar(标量/标量)、vector/scalar(向量/标量),和vector/vector(向量/向量)。默认情况下过滤。 可以通过在运算符之后提供bool来修改它们的行为,这将为值返回0或1而不是过滤。
在两个标量之间:必须提供bool修饰符,并且这些运算符会产生另一个标量,即0(假)或1(真),具体取决于比较结果。 在瞬时向量和标量之间:将这些运算符应用于向量中的每个数据样本的值,并且从结果向量中删除比较结果为假的向量元素。 如果提供了bool修饰符,则将被删除的向量元素的值为0,而将保留的向量元素的值为1。 在两个瞬时向量之间:这些运算符默认表现为过滤器,应用于匹配条目。 表达式不正确或在表达式的另一侧找不到匹配项的向量元素将从结果中删除,而其他元素将传播到具有其原始(左侧)度量标准名称的结果向量中 标签值。 如果提供了bool修饰符,则已经删除的向量元素的值为0,而保留的向量元素的值为1,左侧标签值为1。 如:
3 > 2
报错 “comparisons between scalars must use BOOL modifier”
3 > bool 2
返回 scalar 1
1 > bool 2 1.3 逻辑/集合二元操作符 逻辑/集合二元操作符只能作用在即时向量, 包括:
and 交集 or 并集 unless 补集 vector1 and vector2: 得到一个由vector1元素组成的向量,其中vector2中的元素具有完全匹配的标签集,其他元素被删除。
vector1 or vector2:得到包含vector1的所有原始元素(标签集+值)的向量以及vector2中vector1中没有匹配标签集的所有元素。
vector1 unless vector2:得到一个由vector1元素组成的向量,其中vector2中没有元素,具有完全匹配的标签集。 两个向量中的所有匹配元素都被删除。
二、向量匹配 向量之间的操作尝试在左侧的每个条目的右侧向量中找到匹配元素。 匹配行为有两种基本类型:一对一和多对一/一对多。
一对一从操作的每一侧找到一对唯一条目。 在默认情况下,这是格式为vector1
[vector expr] [bin-op] on([lable list]) [vector expr] 例如样本数据:
method_code:http_errors:rate5m{method=”get”, code=”500”} 24 method_code:http_errors:rate5m{method=”get”, code=”404”} 30 method_code:http_errors:rate5m{method=”put”, code=”501”} 3 method_code:http_errors:rate5m{method=”post”, code=”404”} 21
method:http_requests:rate5m{method=”get”} 600 method:http_requests:rate5m{method=”delete”} 34 method:http_requests:rate5m{method=”post”} 120 查询例子:
method_code:http_errors:rate5m{code=”500”} / ignoring(code) method:http_requests:rate5m 这将返回一个结果向量,其中包含每个方法的状态代码为500的HTTP请求部分,在过去的5分钟内进行测量。 没有ignoring(code)就没有匹配,因为度量标准不共享同一组标签。 方法put和del的条目没有匹配,并且不会显示在结果中: {method=”get”} 0.04 // 24 / 600 {method=”post”} 0.05 // 6 / 120 2.2 多对一和一对多向量匹配 多对一和一对多匹配指的是“一”侧的每个向量元素可以与“多”侧的多个元素匹配的情况。 必须使用group_left或group_right修饰符明确请求,其中left/right确定哪个向量具有更高的基数。
method_code:http_errors:rate5m / ignoring(code) group_left method:http_requests:rate5m 在这种情况下,左向量每个method标签值包含多个条目。 因此,我们使用group_left表明这一点。 右侧的元素现在与多个元素匹配,左侧具有相同的method标签:
{method=”get”, code=”500”} 0.04 // 24 /600 {method=”get”, code=”404”} 0.05 // 30 /600
{method=”post”, code=”500”} 0.05 // 6 /600
{method=”post”, code=”404”} 0.175 // 21 /600
多对一和一对多匹配是高级用例,应该仔细考虑。 通常正确使用忽略ignoring(
三、聚合操作符 Prometheus支持以下内置聚合运算符,这些运算符可用于聚合单个即时向量的元素,从而生成具有聚合值的较少元素的新向量:
sum (在维度上求和) max (在维度上求最大值) min (在维度上求最小值) avg (在维度上求平均值) stddev (求标准差) stdvar (求方差) count (统计向量元素的个数) count_values (统计相同数据值的元素数量) bottomk (样本值第k个最小值) topk (样本值第k个最大值) quantile (统计分位数) 这些运算符可以用于聚合所有标签维度,也可以通过包含without或by子句来保留不同的维度。
count_values输出每个唯一样本值的一个时间序列。每个序列都有一个额外的标签。该标签的名称由聚合参数给出,标签值是唯一的样本值。每个时间序列的值是样本值存在的次数。
topk和bottomk与其他聚合器的不同之处在于,输入样本的子集(包括原始标签)在结果向量中返回。 by和without仅用于存储输入向量。
例:如果度量标准http_requests_total具有按应用程序,实例和组标签扇出的时间序列,我们可以通过以下方式计算每个应用程序和组在所有实例上看到的HTTP请求总数:
sum(http_requests_total) without (instance) 等价于:
sum(http_requests_total) 要计算运行每个构建版本的二进制文件的数量,我们可以编写:
count_values(“version”, build_version) 要在所有实例中获取5个最大的HTTP请求计数,我们可以编写:
topk(5, http_requests_total) 四、二元运算符优先级 以下列表显示了Prometheus中二进制运算符的优先级,从最高到最低。
^ , /, % +, – ==, !=, <=, <, >=, > and, unless or 具有相同优先级的运算符是左关联的。 例如,2 3%2相当于(2 * 3)%2。但是^是右关联的,因此2 ^ 3 ^ 2相当于2 ^(3 ^ 2)。
PromQL函数 一些函数有默认的参数,例如:year(v=vector(time()) instant-vector)。意思是有一个参数v是一个瞬时向量,如果没有提供,它将默认为表达式vector(time())的值。可参考:Prometheus监控学习笔记之PromQL 内置函数 一、abs() abs(v instant-vector)返回输入向量,所有样本值都转换为其绝对值。
二、absent() absent(v instant-vector)如果传递给它的向量具有任何元素,则返回空向量;如果传递给它的向量没有元素,则返回为1的值。这对于在给定度量标准名称和标签组合不存在时间序列时发出警报非常有用。
absent(nonexistent{job=”myjob”})
=> {job=”myjob”}
absent(nonexistent{job=”myjob”, instance=~”.*”})
=> {job=”myjob”}
absent(sum(nonexistent{job=”myjob”}))
=> {}
在第二个例子中,absent()试图从输入向量中导出1元素输出向量的标签。
三、ceil() ceil(v instant-vector) 将v中所有元素的样本值四舍五入到最接近的整数。如:
node_load5{instance=”192.168.1.75:9100”} # 结果为 2.79 ceil(node_load5{instance=”192.168.1.75:9100”}) # 结果为 3 四、changes() 输入一个区间向量, 返回这个区间向量内每个样本数据值变化的次数(瞬时向量)。如:
如果样本数据值没有发生变化,则返回结果为 1 changes(node_load5{instance=”192.168.1.75:9100”}[1m]) # 结果为 1 五、clamp_max() clamp_max(v instant-vector, max scalar) 函数,输入一个瞬时向量和最大值,样本数据值若大于 max,则改为 max,否则不变。如:
node_load5{instance=”192.168.1.75:9100”} # 结果为 2.79 clamp_max(node_load5{instance=”192.168.1.75:9100”}, 2) # 结果为 2 六、clamp_min() clamp_min(v instant-vector, min scalar) 函数,输入一个瞬时向量和最小值,样本数据值若小于 min,则改为 min,否则不变。如:
node_load5{instance=”192.168.1.75:9100”} # 结果为 2.79 clamp_min(node_load5{instance=”192.168.1.75:9100”}, 3) # 结果为 3 七、day_of_month() day_of_month(v=vector(time()) instant-vector)返回UTC中每个给定时间的月中的某天。 返回值为1到31。
八、day_of_week() day_of_week(v=vector(time()) instant-vector)返回UTC中每个给定时间的星期几。 返回值为0到6,其中0表示星期日等。
九、days_in_month() days_in_month(v=vector(time()) instant-vector)返回UTC中每个给定时间的月中天数。 返回值为28到31。
十、delta() delta(v range-vector) 的参数是一个区间向量,返回一个瞬时向量。它计算一个区间向量 v 的第一个元素和最后一个元素之间的差值。由于这个值被外推到指定的整个时间范围,所以即使样本值都是整数,你仍然可能会得到一个非整数值。 如以下示例表达式返回现在和2小时之前CPU温度的差异:
delta(cpu_temp_celsius{host=”zeus”}[2h]) 这个函数一般只用在 Gauge 类型的时间序列上。
十一、deriv() deriv(v range-vector) 的参数是一个区间向量,返回一个瞬时向量。它使用简单的线性回归计算区间向量 v 中各个时间序列的导数。这个函数一般只用在 Gauge 类型的时间序列上。
十二、exp() exp(v instant-vector) 函数,输入一个瞬时向量,返回各个样本值的 e 的指数值,即 e 的 N 次方。当 N 的值足够大时会返回 +Inf。特殊情况为:
Exp(+inf) = +Inf Exp(NaN) = NaN 十三、floor() floor(v instant-vector)函数与 ceil() 函数相反,将 v 中所有元素的样本值向下四舍五入到最接近的整数。
十四、histogram_quantile() histogram_quatile(φ float, b instant-vector) 计算b向量的φ-直方图 (0 ≤ φ ≤ 1) 。(有关φ-分位数的详细解释和直方图度量类型的使用,请参见直方图和摘要。)b中的样本是每个桶中的观察计数。 每个样本必须具有标签le,其中标签值表示桶的包含上限。 (没有这种标签的样本会被忽略。)直方图度量标准类型自动提供带有_bucket后缀和相应标签的时间序列。使用rate()函数指定分位数计算的时间窗口。
示例:直方图度量标准称为http_request_duration_seconds。 要计算过去10m内请求持续时间的第90个百分位数,请使用以下表达式:
histogram_quantile(0.9, rate(http_request_duration_seconds_bucket[10m])) 在http_request_duration_seconds中为每个标签组合计算分位数。 要聚合,请在rate()函数周围使用sum()聚合器。 由于histogram_quantile()需要le标签,因此必须将其包含在by子句中。 以下表达式按作业聚合第90个百分点: histogram_quantile(0.9, sum(rate(http_request_duration_seconds_bucket[10m])) by (job, le)) 要聚合所有内容,请仅指定le标签:
histogram_quantile(0.9, sum(rate(http_request_duration_seconds_bucket[10m])) by (le)) histogram_quantile()函数通过假设桶内的线性分布来插值分位数值。 最高桶必须具有+Inf的上限。 (否则,返回NaN。)如果分位数位于最高桶中,则返回第二个最高桶的上限。 如果该桶的上限大于0,则假设最低桶的下限为0.在这种情况下,在该桶内应用通常的线性插值。 否则,对于位于最低桶中的分位数,返回最低桶的上限。
如果b包含少于两个桶,则返回NaN。 对于φ<0,返回-Inf。 对于φ> 1,返回+Inf。
十五、holt_winters() holt_winters(v range-vector, sf scalar, tf scalar) 函数基于区间向量 v,生成时间序列数据平滑值。平滑因子 sf 越低, 对旧数据的重视程度越高。趋势因子 tf 越高,对数据的趋势的考虑就越多。其中,0< sf, tf <=1。仅适用于 Gauge 类型的时间序列。
十六、hour() hour(v=vector(time()) instant-vector)返回UTC中每个给定时间的一天中的小时。 返回值为0到23。
十七、idelta() idelta(v range-vector) 的参数是一个区间向量, 返回一个瞬时向量。它计算最新的 2 个样本值之间的差值。这个函数一般只用在 Gauge 类型的时间序列上。
十八、increase() increase(v range-vector) 函数获取区间向量中的第一个和最后一个样本并返回其增长量, 它会在单调性发生变化时(如由于采样目标重启引起的计数器复位)自动中断。由于这个值被外推到指定的整个时间范围,所以即使样本值都是整数,你仍然可能会得到一个非整数值。如以下表达式返回区间向量中每个时间序列过去 5 分钟内 HTTP 请求数的增长数:
increase(http_requests_total{job=”api-server”}[5m]) increase 的返回值类型只能是计数器类型,主要作用是增加图表和数据的可读性。使用 rate 函数记录规则的使用率,以便持续跟踪数据样本值的变化。
十九、irate irate(v range-vector) 函数用于计算区间向量的增长率,但是其反应出的是瞬时增长率。irate 函数是通过区间向量中最后两个样本数据来计算区间向量的增长速率,它会在单调性发生变化时(如由于采样目标重启引起的计数器复位)自动中断。这种方式可以避免在时间窗口范围内的“长尾问题”,并且体现出更好的灵敏度,通过irate函数绘制的图标能够更好的反应样本数据的瞬时变化状态。如,以下表达式返回区间向量中每个时间序列过去 5 分钟内最后两个样本数据的 HTTP 请求数的增长率:
irate(http_requests_total{job=”api-server”}[5m]) irate 只能用于绘制快速变化的计数器,在长期趋势分析或者告警中更推荐使用 rate 函数。因为使用 irate 函数时,速率的简短变化会重置 FOR 语句,形成的图形有很多波峰,难以阅读。
注意,当将irate()与聚合运算符(例如sum())或随时间聚合的函数(任何以_over_time结尾的函数)组合时,请始终首先采用irate(),然后进行聚合。 否则,当目标重新启动时,irate()无法检测计数器重置。
二十、label_join() 函数可以将时间序列 v 中多个标签 src_label 的值,通过 separator 作为连接符写入到一个新的标签 dst_label 中。可以有多个 src_label 标签。如,以下表达式返回的时间序列多了一个 foo 标签,标签值为 etcd,etcd-k8s:
up{endpoint=”api”,instance=”192.168.123.248:2379”,job=”etcd”,namespace=”monitoring”,service=”etcd-k8s”} => up{endpoint=”api”,instance=”192.168.123.248:2379”,job=”etcd”,namespace=”monitoring”,service=”etcd-k8s”} 1
label_join(up{endpoint=”api”,instance=”192.168.123.248:2379”,job=”etcd”,namespace=”monitoring”,service=”etcd-k8s”}, “foo”, “,”, “job”, “service”) => up{endpoint=”api”,foo=”etcd,etcd-k8s”,instance=”192.168.123.248:2379”,job=”etcd”,namespace=”monitoring”,service=”etcd-k8s”} 1 label_replace() 二十一、label_replace() 为了能够让客户端的图标更具有可读性,可以通过 label_replace 函数为时间序列添加额外的标签。label_replace 的具体参数如下:
label_replace(v instant-vector, dst_label string, replacement string, src_label string, regex string) 该函数会依次对 v 中的每一条时间序列进行处理,通过 regex 匹配 src_label 的值,并将匹配部分 relacement 写入到 dst_label 标签中。如下所示:
label_replace(up, “host”, “$1”, “instance”, “(.):.“) 函数处理后,时间序列将包含一个 host 标签,host 标签的值为 Exporter 实例的 IP 地址:
up{host=”localhost”,instance=”localhost:8080”,job=”cadvisor”} 1 up{host=”localhost”,instance=”localhost:9090”,job=”prometheus”} 1 up{host=”localhost”,instance=”localhost:9100”,job=”node”} 1 二十二、ln() 计算瞬时向量 v 中所有样本数据的自然对数。特殊情况:
ln(+Inf) = +Inf ln(0) = -Inf ln(x<0) = NaN ln(NaN) = NaN 二十三、log2() log2(v instant-vector)计算v中所有元素的二进制对数。特殊情况等同于ln中的特殊情况。
二十四、log10() log10(v instant-vector)计算v中所有元素的10进制对数。特殊情况等同于ln中的特殊情况。
二十五、minute() minute(v=vector(time()) instant-vector)以UTC为单位返回每个给定时间的分钟。 返回值为0到59。
二十六、month() month(v=vector(time()) instant-vector)返回UTC中每个给定时间的一年中的月份。 返回值为1到12,其中1表示1月等。
二十七、predict_linear() predict_linear(v range-vector, t scalar) 函数可以预测时间序列 v 在 t 秒后的值。它基于简单线性回归的方式,对时间窗口内的样本数据进行统计,从而可以对时间序列的变化趋势做出预测。该函数的返回结果不带有度量指标,只有标签列表。如,基于 2 小时的样本数据,来预测主机可用磁盘空间的是否在 4 个小时候被占满,可以使用如下表达式:
predict_linear(node_filesystem_free{job=”node”}[2h], 4 * 3600) < 0 通过下面的例子来观察返回值:
predict_linear(http_requests_total{code=”200”,instance=”120.77.65.193:9090”,job=”prometheus”,method=”get”}[5m], 5) 结果: {code=”200”,handler=”query_range”,instance=”120.77.65.193:9090”,job=”prometheus”,method=”get”} 1 {code=”200”,handler=”prometheus”,instance=”120.77.65.193:9090”,job=”prometheus”,method=”get”} 4283.449995397104 {code=”200”,handler=”static”,instance=”120.77.65.193:9090”,job=”prometheus”,method=”get”} 22.99999999999999 … 二十八、rate() rate(v range-vector) 函数可以直接计算区间向量 v 在时间窗口内平均增长速率,它会在单调性发生变化时(如由于采样目标重启引起的计数器复位)自动中断。该函数的返回结果不带有度量指标,只有标签列表。
例如,以下表达式返回区间向量中每个时间序列过去 5 分钟内 HTTP 请求数的每秒增长率:
rate(http_requests_total{job=”api-server”}[5m]) rate() 函数返回值类型只能用计数器,在长期趋势分析或者告警中推荐使用这个函数。
注意,当将 rate() 函数与聚合运算符(例如 sum())或随时间聚合的函数(任何以 _over_time 结尾的函数)一起使用时,必须先执行 rate 函数,然后再进行聚合操作,否则当采样目标重新启动时 rate() 无法检测到计数器是否被重置。
二十九、resets() resets(v range-vector) 的参数是一个区间向量。对于每个时间序列,它都返回一个计数器重置的次数。两个连续样本之间的值的减少被认为是一次计数器重置。
这个函数一般只用在计数器类型的时间序列上。
三十、round() round(v instant-vector, to_nearest=1 scalar) 函数与 ceil 和 floor 函数类似,返回向量中所有样本值的最接近的整数。to_nearest 参数是可选的,默认为 1,表示样本返回的是最接近 1 的整数倍的值。你也可以将该参数指定为任意值(也可以是小数),表示样本返回的是最接近它的整数倍的值。
三十一、scalar() scalar(v instant-vector) 函数的参数是一个单元素的瞬时向量,它返回其唯一的时间序列的值作为一个标量。如果度量指标的样本数量大于 1 或者等于 0, 则返回 NaN。
三十二、sort() sort(v instant-vector) 函数对向量按元素的值进行升序排序,返回结果:key: value = 度量指标:样本值[升序排列]。
三十三、sort_desc() sort(v instant-vector) 函数对向量按元素的值进行降序排序,返回结果:key: value = 度量指标:样本值[降序排列]。
三十四、sqrt() sqrt(v instant-vector) 函数计算向量 v 中所有元素的平方根。
三十五、time() time() 函数返回从 1970-01-01 到现在的秒数。注意:它不是直接返回当前时间,而是时间戳三十六、timestamp()
三十七、vector() vector(s scalar) 函数将标量 s 作为没有标签的向量返回,即返回结果为:key: value= {}, s。
三十八、year() year(v=vector(time()) instant-vector)以UTC格式返回每个给定时间的年份。
三十九、
avg_over_time(range-vector) : 区间向量内每个度量指标的平均值。
min_over_time(range-vector) : 区间向量内每个度量指标的最小值。
max_over_time(range-vector) : 区间向量内每个度量指标的最大值。
sum_over_time(range-vector) : 区间向量内每个度量指标的求和。
count_over_time(range-vector) : 区间向量内每个度量指标的样本数据个数。
quantile_over_time(scalar, range-vector) : 区间向量内每个度量指标的样本数据值分位数,φ-quantile (0 ≤ φ ≤ 1)。
stddev_over_time(range-vector) : 区间向量内每个度量指标的总体标准差。
stdvar_over_time(range-vector) : 区间向量内每个度量指标的总体标准方差。
请注意,即使值在整个时间间隔内的间隔不均匀,指定时间间隔内的所有值在聚合中都具有相同的权重。注意:即使区间向量内的值分布不均匀,它们在聚合时的权重也是相同的。
PromQL例子 一、简单的时间序列选择 使用度量标准http_requests_total返回所有时间序列:
http_requests_total 使用度量标准http_requests_total以及给定的job和handler标签返回所有时间系列:
http_requests_total{job=”apiserver”, handler=”/api/comments”} 返回相同向量的整个时间范围(在本例中为5分钟),使其成为范围向量:
http_requests_total{job=”apiserver”, handler=”/api/comments”}[5m] 请注意,导致范围向量的表达式不能直接绘制,而是在表达式浏览器的表格(”Console”)视图中查看。
使用正则表达式,您只能为名称与特定模式匹配的作业选择时间序列,在本例中为所有以server结尾的作业。 请注意,这会进行子字符串匹配,而不是完整的字符串匹配:
http_requests_total{job=~”server$”} 要选择除4xx之外的所有HTTP状态代码,您可以运行:
http_requests_total{status!~”^4..$”} 二、子查询 此查询返回过去30分钟的5分钟http_requests_total指标率,分辨率为1分钟:
rate(http_requests_total[5m])[30m:1m] 这是嵌套子查询的示例。 deri函数的子查询使用默认分辨率。 请注意,不必要地使用子查询是不明智的。
max_over_time(deriv(rate(distance_covered_total[5s])[30s:5s])[10m:]) 三、使用函数,操作符等 使用http_requests_total指标名称返回所有时间序列的每秒速率,在过去5分钟内的增长率:
rate(http_requests_total[5m]) 假设http_requests_total时间序列都有标签job(按作业名称扇出)和instance(按作业实例扇出),我们可能想要总结所有实例的速率,因此我们得到的输出时间序列更少,但仍然 保留job维度 sum(rate(http_requests_total)[5m]) by (job) 如果我们有两个具有相同维度标签的不同指标,我们可以对它们应用二元运算符,并且两侧具有相同标签集的元素将匹配并传播到输出。 例如,此表达式为每个实例返回MiB中未使用的内存(在虚构的群集调度程序上公开它运行的实例的这些度量标准): (instance_memory_limit_byte - instant_memory_usage_bytes) / 1024 / 1024 相同的表达式,但由应用程序总结,可以这样写:
sum( instance_memory_limit_bytes - instance_memory_usage_bytes) by (app, proc) / 1024 / 1024 如果相同的虚构集群调度程序为每个实例公开了如下所示的CPU使用率指标:
instance_cpu_time_ns{app=”lion”, pro=”web”, rev=”34d0f99”, env=”prod”, job=”cluster-manager”} instance_cpu_time_ns{app=”elephant”, proc=”worker”, rev=”34d0f99”, env=”prod”, job=”cluster-manager”} instance_cpu_time_ns{app=”turtle”, proc=”api”, rev=”4d3a513”, env=”prod”, job=”cluster-manager”} … 我们可以按应用程序(app)和进程类型(proc)分组排名前3位的CPU用户:
topk(3, sum(rate(instance_cpu_time_ns[5m])) by(app, proc)) 假设此度量标准包含每个运行实例的一个时间系列,您可以计算每个应用程序运行实例的数量,如下所示:
count(instance_cpu_time_ns) by (app)
<a name="Kx3LA"></a>### PromQL内置函数[https://www.cnblogs.com/JetpropelledSnake/p/10446878.html#top](https://www.cnblogs.com/JetpropelledSnake/p/10446878.html#top)```yaml概述Prometheus 提供了其它大量的内置函数,可以对时序数据进行丰富的处理。某些函数有默认的参数,例如:year(v=vector(time()) instant-vector)。其中参数 v 是一个瞬时向量,如果不提供该参数,将使用默认值 vector(time())。instant-vector 表示参数类型。abs()abs(v instant-vector) 返回输入向量的所有样本的绝对值。absent()absent(v instant-vector),如果传递给它的向量参数具有样本数据,则返回空向量;如果传递的向量参数没有样本数据,则返回不带度量指标名称且带有标签的时间序列,且样本值为1。当监控度量指标时,如果获取到的样本数据是空的, 使用 absent 方法对告警是非常有用的。例如:复制代码# 这里提供的向量有样本数据absent(http_requests_total{method="get"}) => no dataabsent(sum(http_requests_total{method="get"})) => no data# 由于不存在度量指标 nonexistent,所以 返回不带度量指标名称且带有标签的时间序列,且样本值为1absent(nonexistent{job="myjob"}) => {job="myjob"} 1# 正则匹配的 instance 不作为返回 labels 中的一部分absent(nonexistent{job="myjob",instance=~".*"}) => {job="myjob"} 1# sum 函数返回的时间序列不带有标签,且没有样本数据absent(sum(nonexistent{job="myjob"})) => {} 1复制代码ceil()ceil(v instant-vector) 将 v 中所有元素的样本值向上四舍五入到最接近的整数。例如:node_load5{instance="192.168.1.75:9100"} # 结果为 2.79ceil(node_load5{instance="192.168.1.75:9100"}) # 结果为 3changes()changes(v range-vector) 输入一个区间向量, 返回这个区间向量内每个样本数据值变化的次数(瞬时向量)。例如# 如果样本数据值没有发生变化,则返回结果为 1changes(node_load5{instance="192.168.1.75:9100"}[1m]) # 结果为 1clamp_max()clamp_max(v instant-vector, max scalar) 函数,输入一个瞬时向量和最大值,样本数据值若大于 max,则改为 max,否则不变。例如:node_load5{instance="192.168.1.75:9100"} # 结果为 2.79clamp_max(node_load5{instance="192.168.1.75:9100"}, 2) # 结果为 2clamp_min()clamp_min(v instant-vector, min scalar) 函数,输入一个瞬时向量和最小值,样本数据值若小于 min,则改为 min,否则不变。例如:node_load5{instance="192.168.1.75:9100"} # 结果为 2.79clamp_min(node_load5{instance="192.168.1.75:9100"}, 3) # 结果为 3day_of_month()day_of_month(v=vector(time()) instant-vector) 函数,返回被给定 UTC 时间所在月的第几天。返回值范围:1~31。day_of_week()day_of_week(v=vector(time()) instant-vector) 函数,返回被给定 UTC 时间所在周的第几天。返回值范围:0~6,0 表示星期天。days_in_month()days_in_month(v=vector(time()) instant-vector) 函数,返回当月一共有多少天。返回值范围:28~31。delta()delta(v range-vector) 的参数是一个区间向量,返回一个瞬时向量。它计算一个区间向量 v 的第一个元素和最后一个元素之间的差值。由于这个值被外推到指定的整个时间范围,所以即使样本值都是整数,你仍然可能会得到一个非整数值。例如,下面的例子返回过去两小时的 CPU 温度差:delta(cpu_temp_celsius{host="zeus"}[2h])这个函数一般只用在 Gauge 类型的时间序列上。deriv()deriv(v range-vector) 的参数是一个区间向量,返回一个瞬时向量。它使用简单的线性回归计算区间向量 v 中各个时间序列的导数。这个函数一般只用在 Gauge 类型的时间序列上。exp()exp(v instant-vector) 函数,输入一个瞬时向量,返回各个样本值的 e 的指数值,即 e 的 N 次方。当 N 的值足够大时会返回 +Inf。特殊情况为:Exp(+Inf) = +InfExp(NaN) = NaNfloor()floor(v instant-vector) 函数与 ceil() 函数相反,将 v 中所有元素的样本值向下四舍五入到最接近的整数。histogram_quantile()histogram_quantile(φ float, b instant-vector) 从 bucket 类型的向量 b 中计算 φ (0 ≤ φ ≤ 1) 分位数(百分位数的一般形式)的样本的最大值。(有关 φ 分位数的详细说明以及直方图指标类型的使用,请参阅直方图和摘要)。向量 b 中的样本是每个 bucket 的采样点数量。每个样本的 labels 中必须要有 le 这个 label 来表示每个 bucket 的上边界,没有 le 标签的样本会被忽略。直方图指标类型自动提供带有 _bucket 后缀和相应标签的时间序列。可以使用 rate() 函数来指定分位数计算的时间窗口。例如,一个直方图指标名称为 employee_age_bucket_bucket,要计算过去 10 分钟内 第 90 个百分位数,请使用以下表达式:histogram_quantile(0.9, rate(employee_age_bucket_bucket[10m]))返回:{instance="10.0.86.71:8080",job="prometheus"} 35.714285714285715这表示最近 10 分钟之内 90% 的样本的最大值为 35.714285714285715。这个计算结果是每组标签组合成一个时间序列。我们可能不会对所有这些维度(如 job、instance 和 method)感兴趣,并希望将其中的一些维度进行聚合,则可以使用 sum() 函数。例如,以下表达式根据 job 标签来对第 90 个百分位数进行聚合:# histogram_quantile() 函数必须包含 le 标签histogram_quantile(0.9, sum(rate(employee_age_bucket_bucket[10m])) by (job, le))如果要聚合所有的标签,则使用如下表达式:histogram_quantile(0.9,sum(rate(employee_age_bucket_bucket[10m])) by (le))[info] 注意histogram_quantile 这个函数是根据假定每个区间内的样本分布是线性分布来计算结果值的(也就是说它的结果未必准确),最高的 bucket 必须是 le="+Inf" (否则就返回 NaN)。如果分位数位于最高的 bucket(+Inf) 中,则返回第二个最高的 bucket 的上边界。如果该 bucket 的上边界大于 0,则假设最低的 bucket 的的下边界为 0,这种情况下在该 bucket 内使用常规的线性插值。如果分位数位于最低的 bucket 中,则返回最低 bucket 的上边界。如果 b 含有少于 2 个 buckets,那么会返回 NaN,如果 φ < 0 会返回 -Inf,如果 φ > 1 会返回 +Inf。holt_winters()holt_winters(v range-vector, sf scalar, tf scalar) 函数基于区间向量 v,生成时间序列数据平滑值。平滑因子 sf 越低, 对旧数据的重视程度越高。趋势因子 tf 越高,对数据的趋势的考虑就越多。其中,0< sf, tf <=1。holt_winters 仅适用于 Gauge 类型的时间序列。hour()hour(v=vector(time()) instant-vector) 函数返回被给定 UTC 时间的当前第几个小时,时间范围:0~23。idelta()idelta(v range-vector) 的参数是一个区间向量, 返回一个瞬时向量。它计算最新的 2 个样本值之间的差值。这个函数一般只用在 Gauge 类型的时间序列上。increase()increase(v range-vector) 函数获取区间向量中的第一个和最后一个样本并返回其增长量, 它会在单调性发生变化时(如由于采样目标重启引起的计数器复位)自动中断。由于这个值被外推到指定的整个时间范围,所以即使样本值都是整数,你仍然可能会得到一个非整数值。例如,以下表达式返回区间向量中每个时间序列过去 5 分钟内 HTTP 请求数的增长数:increase(http_requests_total{job="apiserver"}[5m])increase 的返回值类型只能是计数器类型,主要作用是增加图表和数据的可读性。使用 rate 函数记录规则的使用率,以便持续跟踪数据样本值的变化。irate()irate(v range-vector) 函数用于计算区间向量的增长率,但是其反应出的是瞬时增长率。irate 函数是通过区间向量中最后两个两本数据来计算区间向量的增长速率,它会在单调性发生变化时(如由于采样目标重启引起的计数器复位)自动中断。这种方式可以避免在时间窗口范围内的“长尾问题”,并且体现出更好的灵敏度,通过irate函数绘制的图标能够更好的反应样本数据的瞬时变化状态。例如,以下表达式返回区间向量中每个时间序列过去 5 分钟内最后两个样本数据的 HTTP 请求数的增长率:irate(http_requests_total{job="api-server"}[5m])irate 只能用于绘制快速变化的计数器,在长期趋势分析或者告警中更推荐使用 rate 函数。因为使用 irate 函数时,速率的简短变化会重置 FOR 语句,形成的图形有很多波峰,难以阅读。[info] 注意当将 irate() 函数与聚合运算符(例如 sum())或随时间聚合的函数(任何以 _over_time 结尾的函数)一起使用时,必须先执行 irate 函数,然后再进行聚合操作,否则当采样目标重新启动时 irate() 无法检测到计数器是否被重置。label_join()label_join(v instant-vector, dst_label string, separator string, src_label_1 string, src_label_2 string, ...)函数可以将时间序列 v 中多个标签 src_label 的值,通过 separator 作为连接符写入到一个新的标签 dst_label 中。可以有多个 src_label 标签。例如,以下表达式返回的时间序列多了一个 foo 标签,标签值为 etcd,etcd-k8s:复制代码up{endpoint="api",instance="192.168.123.248:2379",job="etcd",namespace="monitoring",service="etcd-k8s"}=> up{endpoint="api",instance="192.168.123.248:2379",job="etcd",namespace="monitoring",service="etcd-k8s"} 1label_join(up{endpoint="api",instance="192.168.123.248:2379",job="etcd",namespace="monitoring",service="etcd-k8s"}, "foo", ",", "job", "service")=> up{endpoint="api",foo="etcd,etcd-k8s",instance="192.168.123.248:2379",job="etcd",namespace="monitoring",service="etcd-k8s"} 1label_replace()复制代码为了能够让客户端的图标更具有可读性,可以通过 label_replace 函数为时间序列添加额外的标签。label_replace 的具体参数如下:label_replace(v instant-vector, dst_label string, replacement string, src_label string, regex string)该函数会依次对 v 中的每一条时间序列进行处理,通过 regex 匹配 src_label 的值,并将匹配部分 relacement 写入到 dst_label 标签中。如下所示:label_replace(up, "host", "$1", "instance", "(.*):.*")函数处理后,时间序列将包含一个 host 标签,host 标签的值为 Exporter 实例的 IP 地址:up{host="localhost",instance="localhost:8080",job="cadvisor"} 1up{host="localhost",instance="localhost:9090",job="prometheus"} 1up{host="localhost",instance="localhost:9100",job="node"} 1ln()ln(v instant-vector) 计算瞬时向量 v 中所有样本数据的自然对数。特殊情况:ln(+Inf) = +Infln(0) = -Infln(x < 0) = NaNln(NaN) = NaNlog2()log2(v instant-vector) 函数计算瞬时向量 v 中所有样本数据的二进制对数。特殊情况同上。log10()log10(v instant-vector) 计算瞬时向量 v 中所有样本数据的十进制对数。特殊情况同上。minute()minute(v=vector(time()) instant-vector) 函数返回给定 UTC 时间当前小时的第多少分钟。结果范围:0~59。month()month(v=vector(time()) instant-vector) 函数返回给定 UTC 时间当前属于第几个月,结果范围:0~12。predict_linear()predict_linear(v range-vector, t scalar) 函数可以预测时间序列 v 在 t 秒后的值。它基于简单线性回归的方式,对时间窗口内的样本数据进行统计,从而可以对时间序列的变化趋势做出预测。该函数的返回结果不带有度量指标,只有标签列表。例如,基于 2 小时的样本数据,来预测主机可用磁盘空间的是否在 4 个小时候被占满,可以使用如下表达式:predict_linear(node_filesystem_free{job="node"}[2h], 4 * 3600) < 0通过下面的例子来观察返回值:复制代码predict_linear(http_requests_total{code="200",instance="120.77.65.193:9090",job="prometheus",method="get"}[5m], 5)结果:{code="200",handler="query_range",instance="120.77.65.193:9090",job="prometheus",method="get"} 1{code="200",handler="prometheus",instance="120.77.65.193:9090",job="prometheus",method="get"} 4283.449995397104{code="200",handler="static",instance="120.77.65.193:9090",job="prometheus",method="get"} 22.99999999999999...复制代码这个函数一般只用在 Gauge 类型的时间序列上。rate()rate(v range-vector) 函数可以直接计算区间向量 v 在时间窗口内平均增长速率,它会在单调性发生变化时(如由于采样目标重启引起的计数器复位)自动中断。该函数的返回结果不带有度量指标,只有标签列表。例如,以下表达式返回区间向量中每个时间序列过去 5 分钟内 HTTP 请求数的每秒增长率:复制代码rate(http_requests_total[5m])结果:{code="200",handler="label_values",instance="120.77.65.193:9090",job="prometheus",method="get"} 0{code="200",handler="query_range",instance="120.77.65.193:9090",job="prometheus",method="get"} 0{code="200",handler="prometheus",instance="120.77.65.193:9090",job="prometheus",method="get"} 0.2...复制代码rate() 函数返回值类型只能用计数器,在长期趋势分析或者告警中推荐使用这个函数。[info] 注意当将 rate() 函数与聚合运算符(例如 sum())或随时间聚合的函数(任何以 _over_time 结尾的函数)一起使用时,必须先执行 rate 函数,然后再进行聚合操作,否则当采样目标重新启动时 rate() 无法检测到计数器是否被重置。resets()resets(v range-vector) 的参数是一个区间向量。对于每个时间序列,它都返回一个计数器重置的次数。两个连续样本之间的值的减少被认为是一次计数器重置。这个函数一般只用在计数器类型的时间序列上。round()round(v instant-vector, to_nearest=1 scalar) 函数与 ceil 和 floor 函数类似,返回向量中所有样本值的最接近的整数。to_nearest 参数是可选的,默认为 1,表示样本返回的是最接近 1 的整数倍的值。你也可以将该参数指定为任意值(也可以是小数),表示样本返回的是最接近它的整数倍的值。scalar()scalar(v instant-vector) 函数的参数是一个单元素的瞬时向量,它返回其唯一的时间序列的值作为一个标量。如果度量指标的样本数量大于 1 或者等于 0, 则返回 NaN。sort()sort(v instant-vector) 函数对向量按元素的值进行升序排序,返回结果:key: value = 度量指标:样本值[升序排列]。sort_desc()sort(v instant-vector) 函数对向量按元素的值进行降序排序,返回结果:key: value = 度量指标:样本值[降序排列]。sqrt()sqrt(v instant-vector) 函数计算向量 v 中所有元素的平方根。time()time() 函数返回从 1970-01-01 到现在的秒数。注意:它不是直接返回当前时间,而是时间戳timestamp()timestamp(v instant-vector) 函数返回向量 v 中的每个样本的时间戳(从 1970-01-01 到现在的秒数)。该函数从 Prometheus 2.0 版本开始引入。vector()vector(s scalar) 函数将标量 s 作为没有标签的向量返回,即返回结果为:key: value= {}, s。year()year(v=vector(time()) instant-vector) 函数返回被给定 UTC 时间的当前年份。<aggregation>_over_time()下面的函数列表允许传入一个区间向量,它们会聚合每个时间序列的范围,并返回一个瞬时向量:avg_over_time(range-vector) : 区间向量内每个度量指标的平均值。min_over_time(range-vector) : 区间向量内每个度量指标的最小值。max_over_time(range-vector) : 区间向量内每个度量指标的最大值。sum_over_time(range-vector) : 区间向量内每个度量指标的求和。count_over_time(range-vector) : 区间向量内每个度量指标的样本数据个数。quantile_over_time(scalar, range-vector) : 区间向量内每个度量指标的样本数据值分位数,φ-quantile (0 ≤ φ ≤ 1)。stddev_over_time(range-vector) : 区间向量内每个度量指标的总体标准差。stdvar_over_time(range-vector) : 区间向量内每个度量指标的总体标准方差。[info] 注意即使区间向量内的值分布不均匀,它们在聚合时的权重也是相同的。
Prometheus Operator 自动发现
Alertmanager
Alertmanager主要负责对Prometheus产生的告警进行统一处理,因此在Alertmanager配置中一般会包含以下几个主要部分:
- 全局配置(global):用于定义一些全局的公共参数,如全局的SMTP配置,Slack配置等内容;
- 模板(templates):用于定义告警通知时的模板,如HTML模板,邮件模板等;
- 告警路由(route):根据标签匹配,确定当前告警应该如何处理;
- 接收人(receivers):接收人是一个抽象的概念,它可以是一个邮箱也可以是微信,Slack或者Webhook等,接收人一般配合告警路由使用;
- 抑制规则(inhibit_rules):合理设置抑制规则可以减少垃圾告警的产生
alertmanager
# global块配置下的配置选项在本配置文件内的所有配置项下可见global:# 在Alertmanager内管理的每一条告警均有两种状态: "resolved"或者"firing". 在altermanager首次发送告警通知后, 该告警会一直处于firing状态,设置resolve_timeout可以指定处于firing状态的告警间隔多长时间会被设置为resolved状态, 在设置为resolved状态的告警后,altermanager不会再发送firing的告警通知.resolve_timeout: 1h# 邮件告警配置smtp_smarthost: 'smtp.exmail.qq.com:25'smtp_from: 'dukuan@xxx.com'smtp_auth_username: 'dukuan@xxx.com'smtp_auth_password: 'DKxxx'# HipChat告警配置# hipchat_auth_token: '123456789'# hipchat_auth_url: 'https://hipchat.foobar.org/'wechat_api_url: 'https://qyapi.weixin.qq.com/cgi-bin/'wechat_api_secret: 'JJ'wechat_api_corp_id: 'ww'# 告警通知模板templates:- '/etc/alertmanager/config/*.tmpl'# route: 根路由,该模块用于该根路由下的节点及子路由routes的定义. 子树节点如果不对相关配置进行配置,则默认会从父路由树继承该配置选项。每一条告警都要进入route,即要求配置选项group_by的值能够匹配到每一条告警的至少一个labelkey(即通过POST请求向altermanager服务接口所发送告警的labels项所携带的<labelname>),告警进入到route后,将会根据子路由routes节点中的配置项match_re或者match来确定能进入该子路由节点的告警(由在match_re或者match下配置的labelkey: labelvalue是否为告警labels的子集决定,是的话则会进入该子路由节点,否则不能接收进入该子路由节点).route:# 例如所有labelkey:labelvalue含cluster=A及altertname=LatencyHigh labelkey的告警都会被归入单一组中group_by: ['job', 'altername', 'cluster', 'service','severity']# 若一组新的告警产生,则会等group_wait后再发送通知,该功能主要用于当告警在很短时间内接连产生时,在group_wait内合并为单一的告警后再发送group_wait: 30s# 再次告警时间间隔group_interval: 5m# 如果一条告警通知已成功发送,且在间隔repeat_interval后,该告警仍然未被设置为resolved,则会再次发送该告警通知repeat_interval: 12h# 默认告警通知接收者,凡未被匹配进入各子路由节点的告警均被发送到此接收者receiver: 'wechat'# 上述route的配置会被传递给子路由节点,子路由节点进行重新配置才会被覆盖# 子路由树routes:# 该配置选项使用正则表达式来匹配告警的labels,以确定能否进入该子路由树# match_re和match均用于匹配labelkey为service,labelvalue分别为指定值的告警,被匹配到的告警会将通知发送到对应的receiver- match_re:service: ^(foo1|foo2|baz)$receiver: 'wechat'# 在带有service标签的告警同时有severity标签时,他可以有自己的子路由,同时具有severity != critical的告警则被发送给接收者team-ops-mails,对severity == critical的告警则被发送到对应的接收者即team-ops-pagerroutes:- match:severity: criticalreceiver: 'wechat'# 比如关于数据库服务的告警,如果子路由没有匹配到相应的owner标签,则都默认由team-DB-pager接收- match:service: databasereceiver: 'wechat'# 我们也可以先根据标签service:database将数据库服务告警过滤出来,然后进一步将所有同时带labelkey为database- match:severity: criticalreceiver: 'wechat'# 抑制规则,当出现critical告警时 忽略warninginhibit_rules:- source_match:severity: 'critical'target_match:severity: 'warning'# Apply inhibition if the alertname is the same.# equal: ['alertname', 'cluster', 'service']## 收件人配置receivers:- name: 'team-ops-mails'email_configs:- to: 'dukuan@xxx.com'- name: 'wechat'wechat_configs:- send_resolved: truecorp_id: 'ww'api_secret: 'JJ'to_tag: '1'agent_id: '1000002'api_url: 'https://qyapi.weixin.qq.com/cgi-bin/'message: '{{ template "wechat.default.message" . }}'#- name: 'team-X-pager'# email_configs:# - to: 'team-X+alerts-critical@example.org'# pagerduty_configs:# - service_key: <team-X-key>##- name: 'team-Y-mails'# email_configs:# - to: 'team-Y+alerts@example.org'##- name: 'team-Y-pager'# pagerduty_configs:# - service_key: <team-Y-key>##- name: 'team-DB-pager'# pagerduty_configs:# - service_key: <team-DB-key>##- name: 'team-X-hipchat'# hipchat_configs:# - auth_token: <auth_token># room_id: 85# message_format: html# notify: true
内置规则调整
# 内置告警规则调整参考## 默认调整这里对KubeSphere的内置告警规则进行了适应性调整,指标类告警规则保留了平台资源和配额、节点资源类告警规则,kube-apiserver、kubelet、kube-scheduler、kube-controller-manager、prometheus等平台组件的告警规则,以及k8s应用类的告警规则。事件告警规则仅保留启用了集群关键事件的告警规则。请参考以下步骤更新到集群。1. 内置指标告警规则如果k8s版本大于等于v1.16,使用如下命令更新:kubectl apply -f https://raw.githubusercontent.com/junotx/mixin/main/ks/ee/kuais/rules/prometheus-rules-v1.16+.yaml否则,请使用下列命令:kubectl apply -f https://raw.githubusercontent.com/junotx/mixin/main/ks/ee/kuais/rules/prometheus-rules.yaml2. 内置事件告警规则kubectl apply -f https://raw.githubusercontent.com/junotx/mixin/main/prom/rules/kuais/ks-events-cluster-rules-default.yaml## 自定义调整https://github.com/junotx/mixin/blob/main/ks/ee/kuais/builtin_rules_refer.md
KubeSphere内置规则参考
https://github.com/junotx/mixin/blob/main/ks/ee/kuais/doc.md
1 指标规则
指标规则用来对平台物理资源、应用资源和关键性组件的各类指标(Prometheus格式的指标)进行评估和告警。
1.1 规则结构
指标规则即Prometheus规则,在KubeSphere平台存储在prometheusrules.monitoring.coreos.com所定义的资源中,其Spec结构如下:
spec└──groups|| ┌──name (group name)0──|| └──rules| || | ┌──expr| 0——|──labels (recording rule)| | └──record| || 1,2...||| ┌──name (group name)1——|| └──rules| || | ┌──alert| | |──annotations| 0——|——expr (alerting rule)| | |——for| | └──labels| || 1,2...|2,3...
一个规则组中的规则通常只包括recording rules或只包括alerting rules
1.2 内置规则更新
这里仅针对用于告警目的的内置指标规则进行操作
KubeSphere内置了一些必要的指标告警规则,对平台物理资源、应用资源、关键性组件的各类指标进行告警。各内置告警规则的含义请参考附录中的内置指标告警规则。
规则主要位于kubesphere-monitoring-system项目下的prometheus-k8s-rules资源中,通过以下命令可修改其中的规则:
kubectl -n kubesphere-monitoring-system edit prometheusrules.monitoring.coreos.com prometheus-k8s-rules
该命令会进入到资源的编辑界面,编辑用法与linux中编辑文件的
vim命令类似。
请参考前文的指标规则结构,对需要调整的告警规则进行操作,比如更新、删除等,然后保存后(同vim命令的保存操作)即可自动同步更新至Prometheus组件。
当只针对个别的告警规则进行删除操作时,可以参考使用以下删除单个告警规则的快捷命令:
# 这里将删除prometheus-k8s-rules资源中名称为KubePodCrashLooping、级别为warning的告警规则# 若要删除其他规则,请调整命令中相应位置处的规则名称和规则级别kubectl -n kubesphere-monitoring-system get prometheusrules.monitoring.coreos.com prometheus-k8s-rules -ojson | jq 'delpaths([path(..|select(.alert?=="KubePodCrashLooping" and .labels.severity?=="warning"))])' | kubectl apply -f -
2 事件规则
事件规则用来对K8S中的Event资源进行评估和告警
2.1 规则结构
事件规则在KubeSphere平台存储在rules.events.kubesphere.io所定义的资源中,其Spec结构如下:
spec└──rules|| ┌──annotations| |——condition0——|——enable (取值true或false来启用或禁用规则,默认false)| |——labels| |——name| └──type (取值alert或notification表示规则的类型)||1,2...
对于type=notification的非告警规则在当前的KubeSphere版本中未有应用,暂可忽略。
2.2 内置规则更新
这里仅针对用于告警目的的内置事件规则进行操作
KubeSphere内置了一些必要的事件告警规则,对平台各类事件进行告警。各内置事件告警规则的定义请参考附录中的内置事件告警规则。
基本规则位于kubesphere-logging-system项目下的ks-events-cluster-rules-default资源中,通过以下命令可修改其中的规则:
kubectl -n kubesphere-logging-system edit rules.events.kubesphere.io ks-events-cluster-rules-default
该命令会进入到资源的编辑界面,编辑用法与linux中编辑文件的
vim命令类似。
请参考前文的事件规则结构,对需要调整的告警规则进行操作,比如规则禁用、更新、删除等,然后保存后(同vim命令的保存操作)即可自动同步更新至EventsRuler组件(该组件负责加载事件规则、触发事件告警)。
当只针对个别的告警规则进行删除操作时,可以参考使用以下删除单个告警规则的快捷命令:
# 这里将删除ks-events-cluster-rules-default资源中名称为ContainerBackoff、级别为warning的告警规则# 若要删除其他规则,请调整命令中相应位置处的规则名称和规则级别kubectl -n kubesphere-logging-system get rules.events.kubesphere.io ks-events-cluster-rules-default -ojson | jq 'delpaths([path(..|select(.type?=="alert" and .name?=="ContainerBackoff" and .labels.severity?=="warning"))])' | kubectl apply -f -
3 附录
3.1 内置指标告警规则
| 组 | 规则名称 | 级别 | 说明 |
|---|---|---|---|
| kube-state-metrics | KubeStateMetricsListErrors | critical | kube-state-metrics执行k8s资源的list操作异常,可能无法导出对应资源的指标数据 |
| KubeStateMetricsWatchErrors | critical | kube-state-metrics执行k8s资源的watch操作异常,可能无法导出对应资源的指标数据 | |
| node-exporter | NodeFilesystemSpaceFillingUp | warning | 节点存储空间即将用尽 |
| NodeFilesystemSpaceFillingUp | critical | 节点存储空间即将用尽 | |
| NodeFilesystemAlmostOutOfSpace | warning | 节点存储空间几乎用尽 | |
| NodeFilesystemAlmostOutOfSpace | critical | 节点存储空间几乎用尽 | |
| NodeFilesystemFilesFillingUp | warning | 节点inodes即将用尽 | |
| NodeFilesystemFilesFillingUp | critical | 节点inodes即将用尽 | |
| NodeFilesystemAlmostOutOfFiles | warning | 节点inodes几乎用尽 | |
| NodeFilesystemAlmostOutOfFiles | critical | 节点inodes几乎用尽 | |
| NodeNetworkReceiveErrs | warning | 节点接收网络数据异常多 | |
| NodeNetworkTransmitErrs | warning | 节点发送网络数据异常多 | |
| NodeHighNumberConntrackEntriesUsed | warning | 节点conntrack使用量接近限制 | |
| NodeClockSkewDetected | warning | 节点时钟倾斜 | |
| kubernetes-apps | KubePodCrashLooping | warning | 容器组频繁重启 |
| KubePodNotReady | warning | 容器组长时间未就绪 | |
| KubeDeploymentGenerationMismatch | warning | Deployment版本号不匹配 | |
| KubeDeploymentReplicasMismatch | warning | Deployment副本数不匹配 | |
| KubeStatefulSetReplicasMismatch | warning | StatefulSet副本数不匹配 | |
| KubeStatefulSetGenerationMismatch | warning | StatefulSet版本号不匹配 | |
| KubeStatefulSetUpdateNotRolledOut | warning | StatefulSet更新未被回滚 | |
| KubeDaemonSetRolloutStuck | warning | DaemonSet回滚阻塞 | |
| KubeContainerWaiting | warning | 容器长时间处于等待状态 | |
| KubeDaemonSetNotScheduled | warning | DaemonSet的pod未调度 | |
| KubeDaemonSetMisScheduled | warning | DaemonSet的pod调度位置不对 | |
| KubeCronJobRunning | warning | CronJob完成任务耗时久 | |
| KubeJobCompletion | warning | Job耗时久 | |
| KubeJobFailed | warning | Job执行失败 | |
| KubeHpaReplicasMismatch | warning | HPA副本数不匹配 | |
| KubeHpaMaxedOut | warning | HPA长时间处于最大副本状态 | |
| kubernetes-resources | KubeCPUOvercommit | warning | k8s集群CPU资源请求超额,将无法容忍节点故障 |
| KubeMemoryOvercommit | warning | k8s集群内存资源请求超额,将无法容忍节点故障 | |
| KubeCPUQuotaOvercommit | warning | namespace的cpu资源请求超额 | |
| KubeMemoryQuotaOvercommit | warning | namespace的内存资源请求超额 | |
| KubeQuotaExceeded | warning | namespace的资源用量高 | |
| CPUThrottlingHigh | warning | cpu处于节制状态时间占比高 | |
| kubernetes-storage | KubePersistentVolumeFillingUp | critical | 持久化存储卷空间即将用尽 |
| KubePersistentVolumeFillingUp | warning | 持久化存储卷空间即将用尽 | |
| KubePersistentVolumeErrors | critical | 持久化存储卷状态异常 | |
| kube-apiserver-slos | KubeAPIErrorBudgetBurn | critical | kube-apiserver组件异常多 |
| KubeAPIErrorBudgetBurn | critical | kube-apiserver组件异常多 | |
| KubeAPIErrorBudgetBurn | warning | kube-apiserver组件异常多 | |
| KubeAPIErrorBudgetBurn | warning | kube-apiserver组件异常多 | |
| kubernetes-system-apiserver | KubeAPILatencyHigh | warning | KubeAPI资源请求延迟时间长 |
| KubeAPIErrorsHigh | warning | KubeAPI资源请求异常率高 | |
| KubeClientCertificateExpiration | warning | k8s客户端证书将过期 | |
| KubeClientCertificateExpiration | critical | k8s客户端证书将过期 | |
| AggregatedAPIErrors | warning | AggregatedAPI异常,异常值高表示相关服务的可用性频繁切换 | |
| AggregatedAPIDown | warning | AggregatedAPI不可用 | |
| KubeAPIDown | critical | KubeAPI不可用 | |
| kubernetes-system-kubelet | KubeNodeNotReady | warning | k8s节点长时间未就绪 |
| KubeNodeUnreachable | warning | k8s节点不可达 | |
| KubeletTooManyPods | warning | 节点的pod使用率高 | |
| KubeNodeReadinessFlapping | warning | 节点就绪状态频繁变化 | |
| KubeletPlegDurationHigh | warning | kubelet的PLEG操作耗时长 | |
| KubeletPodStartUpLatencyHigh | warning | kubelet启动pod时间长 | |
| KubeletDown | critical | kubelet不可用 | |
| kubernetes-system-scheduler | KubeSchedulerDown | critical | kube-scheduler不可用 |
| kubernetes-system-controller-manager | KubeControllerManagerDown | critical | kube-controller-manager不可用 |
| prometheus | PrometheusBadConfig | critical | prometheus加载配置文件失败 |
| PrometheusNotificationQueueRunningFull | warning | prometheus的告警通知队列将满 | |
| PrometheusErrorSendingAlertsToSomeAlertmanagers | warning | prometheus发送告警到部分alertmanager实例出错 | |
| PrometheusErrorSendingAlertsToAnyAlertmanager | critical | prometheus发送告警到所有alertmanager实例出错 | |
| PrometheusNotConnectedToAlertmanagers | warning | prometheus未连接任何alertmanager | |
| PrometheusTSDBReloadsFailing | warning | prometheus加载磁盘块数据失败 | |
| PrometheusTSDBCompactionsFailing | warning | prometheus执行compact操作失败 | |
| PrometheusNotIngestingSamples | warning | prometheus未摄入数据 | |
| PrometheusDuplicateTimestamps | warning | prometheus摄入数据的时间戳重复,重复时间戳的数据将被丢弃 | |
| PrometheusOutOfOrderTimestamps | warning | prometheus摄入数据的时间戳出现乱序,相应的数据将被丢弃 | |
| PrometheusRemoteStorageFailures | critical | prometheus写远程数据失败 | |
| PrometheusRemoteWriteBehind | critical | prometheus写远程数据滞后时间长 | |
| PrometheusRemoteWriteDesiredShards | warning | prometheus写远程需要更多shards。prometheus写远程时会启用多个shards并行写,当计算的最优shards数大于配置shards数时,会触发该告警 | |
| PrometheusRuleFailures | critical | prometheus规则评估异常 | |
| PrometheusMissingRuleEvaluations | warning | prometheus错过规则评估,一般是由于规则评估过慢 | |
| alertmanager.rules | AlertmanagerConfigInconsistent | critical | alertmanager配置不同步 |
| AlertmanagerFailedReload | warning | alertmanager加载配置失败 | |
| AlertmanagerMembersInconsistent | critical | alertmanager节点状态不一致,找不到集群内其他节点 | |
| general.rules | TargetDown | warning | Target服务的副本不可用率高 |
| Watchdog | none | ||
| node-network | NodeNetworkInterfaceFlapping | warning | 节点网络接口状态频繁变化 |
| prometheus-operator | PrometheusOperatorReconcileErrors | warning | prometheus-operator reconcile操作异常 |
| PrometheusOperatorNodeLookupErrors | warning | prometheus-operator reconcile prometheus异常 |
3.2 内置事件告警规则
| 规则名称 | 级别 | 说明 |
|---|---|---|
| ContainerFailed | warning | 容器失败 |
| ContainerPreempting | warning | 容器抢占中 |
| ContainerBackoff | warning | 容器回退 |
| ContainerUnhealthy | warning | 容器状态不良 |
| ContainerProbeWarning | warning | 容器探测警告 |
| PodKillingExceededGracePeriod | warning | pod终止超时 |
| PodKillFailed | warning | pod终止失败 |
| PodContainerCreateFailed | warning | pod容器创建失败 |
| PodFailed | warning | pod失败 |
| PodNetworkNotReady | warning | Pod网络异常 |
| ImagePullPolicyError | warning | 镜像拉取策略错误 |
| ImageInspectFailed | warning | 镜像检查失败 |
| KubeletSetupFailed | warning | kubelet安装失败 |
| VolumeAttachFailed | warning | 存储卷装载失败 |
| VolumeMountFailed | warning | 存储卷挂载失败 |
| VolumeResizeFailed | warning | 存储卷扩缩容失败 |
| FileSystemResizeFailed | warning | 文件系统扩缩容失败 |
| VolumeMapFailed | warning | 存储卷映射失败 |
| VolumeAlreadyMounted | warning | 存储卷已被挂载 |
| NodeRebooted | warning | 节点重启 |
| ContainerGCFailed | warning | 容器GC失败 |
| ImageGCFailed | warning | 镜像GC失败 |
| NodeAllocatableEnforcementFailed | warning | 节点可分配资源更新失败 |
| SandboxCreateFailed | warning | Sandbox创建失败 |
| SandboxStatusFailed | warning | 获取Sandbox状态错误 |
| DiskCapacityInvalid | warning | 磁盘容量配置不合法 |
| DiskSpaceFreeFailed | warning | 磁盘空间释放失败 |
| PodStatusSyncFailed | warning | Pod状态同步失败 |
| ConfigurationValidationFailed | warning | 配置验证失败 |
| LifecycleHookPostStartFailed | warning | 容器启动后的生命周期钩子运行失败 |
| LifecycleHookPreStopFailed | warning | 容器停止前的生命周期钩子运行失败 |
| HPASelectorError | warning | HPA选择器错误 |
| HPAMetricError | warning | HPA对象指标错误 |
| HPAConvertFailed | warning | HPA转换失败 |
| HPAGetScaleFailed | warning | HPA规模获取失败 |
| HPAComputeReplicasFailed | warning | HPA副本计算失败 |
| HPARescaleFailed | warning | HPA规模调整失败 |
| NodeSystemOOM | warning | 节点内存溢出 |
| VolumeBindingFailed | warning | 存储卷绑定失败 |
| VolumeMismatch | warning | 存储卷不匹配 |
| VolumeRecycleFailed | warning | 存储卷回收失败 |
| VolumeRecyclerPodError | warning | 存储卷回收器错误 |
| VolumeDeleteFailed | warning | 存储卷删除失败 |
| VolumeProvisionFailed | warning | 存储申请失败 |
| VolumeProvisionCleanupFailed | warning | 清理存储失败 |
| VolumeExternalExpandingError | warning | 存储外部扩展错误 |
| PodScheduleFailed | warning | pod调度失败 |
| PodCreateFailed | warning | pod创建失败 |
| PodDeleteFailed | warning | pod删除失败 |
| ReplicaSetCreateError | warning | 副本集创建错误 |
| DeploymentRollbackFailed | warning | 部署回滚失败 |
| DeploySelectorAll | warning | deploy选择了所有pod |
| DaemonSelectorAll | warning | daemonset选择了所有pod |
| DaemonPodFailed | warning | daemonset的pod失败 |
| LoadBalancerSyncFailed | warning | 负载据衡器不可用 |
| LoadBalancerUnAvailable | warning | 负载据衡器不可用 |
| LoadBalancerUpdateFailed | warning | 更新负载据衡器失败 |
| LoadBalancerDeleteFailed | warning | 负载据衡器删除失败 |
| JobGetFailed | warning | 任务获取失败 |
| JobCreateFailed | warning | 任务创建失败 |
| JobDeleteFailed | warning | 任务删除失败 |
| JobUnexpected | warning | 任务非预期 |
| JobScheduleFailed | warning | 任务调度失败 |
# 调整 Alertmanager replicakubectl -n kubesphere-monitoring-system edit alertmanagers.monitoring.coreos.com main# 调整 Alertmanager 配置 , 需要把内容拷贝出来 base64 解码,改完后再base64编码写进去kubectl -n kubesphere-monitoring-system edit secrets alertmanager-main# 修改 rule 也要改crdkubectl -n kubesphere-monitoring-system edit prometheusrules.monitoring.coreos.com prometheus-k8s-rules
Inactive:非活动状态,表示正在监控,但是还未有任何警报触发。
Pending:表示这个警报必须被触发。由于警报可以被分组、压抑/抑制或静默/静音,所以等待验证,一旦所有的验证都通过,则将转到 Firing 状态。
Firing:将警报发送到 AlertManager,它将按照配置将警报的发送给所有接收者。一旦警报解除,则将状态转到 Inactive,如此循环
KubeSphere平台从3.1版本开始重新调整了告警系统的设计,可以兼容Prometheus风格的告警规则。这里所提及的告警仅针对各类资源的指标进行告警。
KubeSphere定义了自定义告警策略的API,并提供了界面化的交互式UI,方便用户对自定义告警策略的增删改查操作。区别于自定义告警策略,3.1版本之前Prometheus所内置的告警规则保留为内置告警策略,为兼容平台外部Prometheus,Console仅提供了内置告警策略的查看功能。
为支持多租户场景,自定义告警策略分为了集群和项目两个层级。这两个层级都针对常用的指标告警场景提供了便捷的模板化配置,也开放了自定义PromQL来满足复杂的业务。
告警策略存储方式
无论是自定义告警策略,还是内置告警策略(这里仅指平台内置Prometheus的策略),它们都首先存储在prometheus-operator所定义的prometheusrules.monitoring.coreos.com资源中。该资源的Spec结构请参考下图。这些资源的更新将由prometheus-operator同步至告警系统中。
spec└──groups|| ┌──name (group name)0──|| └──rules| || | ┌──expr| 0——|──labels (recording rule)| | └──record| || 1,2...||| ┌──name (group name)1——|| └──rules| || | ┌──alert| | |──annotations| 0——|——expr (alerting rule)| | |——for| | └──labels| || 1,2...|2,3...
这里请只参考告警规则,即alerting rules。
一个规则组中的规则通常只包括recording rules或只包括alerting rules。
平台默认配置下,可以通过命令kubectl -n kubesphere-monitoring-system get prometheusrules -l prometheus=k8s,role=alert-rules获取所有内置告警策略存储的资源,通过命令kubectl get prometheusrules -l thanosruler=thanos-ruler,role=thanos-alerting-rules -A获取自定义告警策略存储的资源。
请勿手动修改自定义告警策略的CRD资源,而应通过Console或API调用来更新策略。
以下是单个告警策略的存储结构说明:
alert: <string>expr: <string>for: <duration>labels:[<label_name>: <label_value>...]annotations:[<annotation_name>: <annotation_value>...]
alert: 策略名称/规则名称/告警名称。expr: 规则表达式,一个合法的PromQL表达式。for: 告警持续时间。达到该持续时间的告警消息才被下发。labels: 标签集。通常会有一个名称为severity,值为warning/error/critical的标签来标识告警的严重程度。这些labels将被加入到告警消息的labels中。annotations: 注解集。用来丰富通知消息的内容。通常会有一个名称为summary的注解说明告警消息的摘要信息,和一个名称为message的注解说明告警消息的详细信息。
告警原理说明
这里以TargetDown这个内置告警策略为例,进行告警原理的说明。
该策略的目的是,针对Prometheus的抓取目标服务异常情况进行告警,当某个目标服务的副本不可用率大于10%,且持续超过10分钟时,发送告警消息。
alert: TargetDownannotations:message: >-{{ printf "%.4g" $value }}% of the {{ $labels.job }}/{{$labels.service }} targets in {{ $labels.namespace }} namespaceare down.expr: >-100 * (count(up == 0) BY (job, namespace, service) / count(up) BY(job, namespace, service)) > 10for: 10mlabels:severity: warning
告警系统在发现该策略后,将通过expr表达式来周期性地查询指标系统,结果集将是副本不可用率大于10%的那些目标服务。如果在for所指定的时间范围内,每次查询的结果集之中都包含目标服务A,那么,以TargetDown命名且包含服务A属性的告警消息,就将被发送到下游通知系统。这之后,如果查询结果集中继续包含A服务,相应的告警消息将继续发送,反之则在下次查询结果集中出现服务A时进行重新计时,直到再次满足for所指定的时间范围。
告警消息主要包括alertname,labels和annotations三个属性。alertname来自于告警策略名称,labels包含了表达式查询结果中的labels和告警策略中的labels,annotations来自于告警策略的annotations。
告警策略中的
annotaions支持配置模板,具体请参考这里,模板执行后的结果会放在告警消息中的annotations。持续时间未设置或被设置为0时,告警系统通过expr查询到结果后,将不等待就发送告警消息到下游。
自定义告警策略
配置说明
具体的配置步骤请参考集群告警策略配置文档和项目告警策略配置文档。
这里针对自定义告警策略API所定义的告警策略数据传输结构与Console上的界面要素的关系进行说明。前者的结构如下:
name: <rule_name>query: <query_string>duration: <duration>labels:[<label_name>: <label_value>...]annotations:[<annotation_name>: <annotation_value>...]
这里的
name,query,duration,分别与前文告警策略存储结构中的alert,expr,for一一对应。
策略名称:自定义策略的名称要求是一个合法的k8s资源名称,这与Prometheus有所区别。
持续时间:对应到duration属性。
告警级别:将作为标签添加到labels中,标签名severity,标签值支持warning、error、critical,依次是一般告警、重要告警、危险告警,告警的严重程度或紧急程度依次递增。
规则模板和自定义规则:使用规则模板配置时,将根据输入来自动组装PromQL表达式,填充到query中。而自定义规则则是直接配置query表达式。
通知内容: 用来丰富告警消息的内容。其中的标题作为名称为summary的注解添加到annotations,消息则对应到名称为message的注解。
对query表达式和duration的评估结果,决定了告警消息是否产生和是否下发。据此,告警策略的告警状态分为了以下三种:
- 未触发:表示二者条件都不满足,此时未产生告警消息。
- 待触发:表示满足
query但不满足duration,可以认为此时已产生告警消息,但暂未下发。 - 触发中,表示二者条件都满足,此时已开始(或正准备)发送告警消息到下游通知系统。
模板规则配置参考
集群级别
Console上集群层级的告警策略提供了配置模板,可以针对节点的CPU、内存、本地磁盘、网络等各种资源类指标,进行快速的告警规则配置。下表列出了针对这些指标的建议阈值配置,提供给用户配置时参考。
| 指标名称 | 操作符 | 建议阈值 | 单位 |
|---|---|---|---|
| 容器组异常率 | >或 >= |
3 | % |
| 容器组利用率 | >或 >= |
80 | % |
| CPU利用率 | >或 >= |
80 | % |
| CPU 1分钟平均负载 | >或 >= |
- | Core |
| CPU 5分钟平均负载 | >或 >= |
- | Core |
| 可用内存 | <或 <= |
- | GB |
| 内存利用率 | >或 >= |
80 | % |
| 本地磁盘可用空间 | <或 <= |
- | GB |
| 本地磁盘空间利用率 | >或 >= |
80 | % |
| inode利用率 | >或 >= |
80 | % |
| 本地磁盘读取IOPS | >或 >= |
- | 次数/s |
| 本地磁盘写入IOPS | >或 >= |
- | 次数/s |
| 本地磁盘读取吞吐量 | >或 >= |
- | KB/s |
| 本地磁盘写入吞吐量 | >或 >= |
- | KB/s |
| 网络发送数据速率 | >或 >= |
- | Mbps |
| 网络接收数据速率 | >或 >= |
- | Mbps |
- 单位已由Console指定,配置时无需设定。
- 未给出建议阈值的指标,用户请根据平台规模和业务需要自行配置。
项目级别
Console为项目层级的告警规则配置,提供了针对部署、有状态副本集、守护进程集等工作负载,CPU用量、内存用量、网路数据收发速率、副本不可用率等指标在内的模板化告警规则配置
| 指标名称 | 操作符 | 建议阈值 | 单位 |
|---|---|---|---|
| CPU用量 | >或 >= |
- | Core |
| 内存用量 | >或 >= |
- | Mi |
| 内存用量(包含缓存) | >或 >= |
- | Mi |
| 网络发送数据速率 | >或 >= |
- | Kbps |
| 网络接收数据速率 | >或 >= |
- | Kbps |
| 副本不可用率 | >或 >= |
- | % |
- 单位已由Console指定,配置时无需设定。
- 这里未给出建议阈值,请根据实际业务需求进行配置。
内置告警策略
KubeSphere内置了一些必要的告警策略,对平台物理资源、应用资源、关键性组件的各类指标进行告警。这些内置告警策略将由Prometheus组件来评估和告警,它们的含义请参考附录一:内置告警规则表。
通过集群管理的告警策略页可以查询和查看内置告警策略。通常不建议对这些内置告警策略进行调整,若有需求,请参考后续的配置说明。
通过命令
kubectl -n kubesphere-monitoring-system get prometheusrules -l prometheus=k8s,role=alert-rules可以获取存储内置告警策略的资源。
配置说明
内置告警策略的绝大部分位于kubesphere-monitoring-system项目下的prometheus-k8s-rules资源中,该资源的结构请参考前述的告警策略存储方式。通过以下命令可修改其中的策略规则:
kubectl -n kubesphere-monitoring-system edit prometheusrules.monitoring.coreos.com prometheus-k8s-rules
该命令会进入到资源的编辑界面,编辑用法与linux中编辑文件的
vim命令类似。
请参考前文的告警策略结构,对需要调整的告警策略进行操作,比如更新、删除等,然后保存后(同vim命令的保存操作)即可自动同步更新至Prometheus组件。
当只针对个别的内置告警策略进行删除操作时,请参考使用以下删除单个告警策略的快捷命令:
# 这里将删除prometheus-k8s-rules资源中名称为KubePodCrashLooping、级别为warning的告警规则# 若要删除其他规则,请调整命令中相应位置处的规则名称和规则级别kubectl -n kubesphere-monitoring-system get prometheusrules.monitoring.coreos.com prometheus-k8s-rules -ojson | jq 'delpaths([path(..|select(.alert?=="KubePodCrashLooping" and .labels.severity?=="warning"))])' | kubectl apply -f -
etcd相关的内置告警策略位于
kubesphere-monitoring-system项目下的prometheus-k8s-etcd-rules资源中。
附录一:内置告警策略表
| 组 | 规则名称 | 持续时间 | 级别 | 说明 |
|---|---|---|---|---|
| kube-state-metrics | KubeStateMetricsListErrors | 15m | critical | kube-state-metrics执行k8s资源的list操作异常,可能无法导出对应资源的指标数据 |
| KubeStateMetricsWatchErrors | 15m | critical | kube-state-metrics执行k8s资源的watch操作异常,可能无法导出对应资源的指标数据 | |
| node-exporter | NodeFilesystemSpaceFillingUp | 1h | warning | 节点存储空间即将用尽(预计未来24小时将用尽时) |
| NodeFilesystemSpaceFillingUp | 1h | critical | 节点存储空间即将用尽(预计未来4小时将用尽时) | |
| NodeFilesystemAlmostOutOfSpace | 1h | warning | 节点存储空间几乎用尽(存储少于5%) | |
| NodeFilesystemAlmostOutOfSpace | 1h | critical | 节点存储空间几乎用尽(存储少于3%) | |
| NodeFilesystemFilesFillingUp | 1h | warning | 节点inodes即将用尽(预计未来24小时将用尽时) | |
| NodeFilesystemFilesFillingUp | 1h | critical | 节点inodes即将用尽(预计未来4小时将用尽时) | |
| NodeFilesystemAlmostOutOfFiles | 1h | warning | 节点inodes几乎用尽(inodes少于5%) | |
| NodeFilesystemAlmostOutOfFiles | 1h | critical | 节点inodes几乎用尽(inodes少于3%) | |
| NodeNetworkReceiveErrs | 1h | warning | 节点接收网络数据异常多 | |
| NodeNetworkTransmitErrs | 1h | warning | 节点发送网络数据异常多 | |
| NodeHighNumberConntrackEntriesUsed | warning | 节点conntrack使用量接近限制 | ||
| NodeClockSkewDetected | 10m | warning | 节点时钟倾斜 | |
| kubernetes-apps | KubePodCrashLooping | 15m | warning | 容器组频繁重启 |
| KubePodNotReady | 15m | warning | 容器组长时间未就绪 | |
| KubeDeploymentGenerationMismatch | 15m | warning | Deployment版本号不匹配 | |
| KubeDeploymentReplicasMismatch | 15m | warning | Deployment副本数不匹配 | |
| KubeStatefulSetReplicasMismatch | 15m | warning | StatefulSet副本数不匹配 | |
| KubeStatefulSetGenerationMismatch | 15m | warning | StatefulSet版本号不匹配 | |
| KubeStatefulSetUpdateNotRolledOut | 15m | warning | StatefulSet更新未被回滚 | |
| KubeDaemonSetRolloutStuck | 15m | warning | DaemonSet回滚阻塞 | |
| KubeContainerWaiting | 1h | warning | 容器长时间处于等待状态 | |
| KubeDaemonSetNotScheduled | 10m | warning | DaemonSet的pod未调度 | |
| KubeDaemonSetMisScheduled | 15m | warning | DaemonSet的pod调度位置不对 | |
| KubeCronJobRunning | 1h | warning | CronJob完成任务耗时久 | |
| KubeJobCompletion | 1h | warning | Job耗时久 | |
| KubeJobFailed | 15m | warning | Job执行失败 | |
| KubeHpaReplicasMismatch | 15m | warning | HPA副本数不匹配 | |
| KubeHpaMaxedOut | 15m | warning | HPA长时间处于最大副本状态 | |
| kubernetes-resources | KubeCPUOvercommit | 5m | warning | k8s集群CPU资源请求超额,将无法容忍节点故障 |
| KubeMemoryOvercommit | 5m | warning | k8s集群内存资源请求超额,将无法容忍节点故障 | |
| KubeCPUQuotaOvercommit | 5m | warning | namespace的cpu资源请求超额 | |
| KubeMemoryQuotaOvercommit | 5m | warning | namespace的内存资源请求超额 | |
| KubeQuotaExceeded | 15m | warning | namespace的资源用量高 | |
| CPUThrottlingHigh | 15m | warning | cpu处于节制状态时间占比高 | |
| kubernetes-storage | KubePersistentVolumeFillingUp | 1m | critical | 持久化存储卷空间即将用尽(存储剩余少于3%时) |
| KubePersistentVolumeFillingUp | 1h | warning | 持久化存储卷空间即将用尽(存储剩余少于15%并且预计未来4天将用尽时) | |
| KubePersistentVolumeErrors | 5m | critical | 持久化存储卷状态异常 | |
| kube-apiserver-slos | KubeAPIErrorBudgetBurn | 2m | critical | kube-apiserver组件异常多(高时延+返回码5xx的请求占比在最近1小时内和5分钟内都大于14.4%时) |
| KubeAPIErrorBudgetBurn | 15m | critical | kube-apiserver组件异常多(高时延+返回码5xx的请求占比在最近6小时内和30分钟内都大于6%时) | |
| KubeAPIErrorBudgetBurn | 1h | warning | kube-apiserver组件异常多(高时延+返回码5xx的请求占比在最近1天内和2小时内都大于3%时) | |
| KubeAPIErrorBudgetBurn | 3h | warning | kube-apiserver组件异常多(高时延+返回码5xx的请求占比在最近3天内和6小时内都大于1%时) | |
| kubernetes-system-apiserver | KubeAPILatencyHigh | 5m | warning | KubeAPI资源请求延迟时间长 |
| KubeAPIErrorsHigh | 10m | warning | KubeAPI资源请求异常率高 | |
| KubeClientCertificateExpiration | warning | k8s客户端证书将过期(距离证书过期少于7天时) | ||
| KubeClientCertificateExpiration | critical | k8s客户端证书将过期(距离证书过期少于24小时) | ||
| AggregatedAPIErrors | warning | AggregatedAPI异常,异常值高表示相关服务的可用性频繁切换 | ||
| AggregatedAPIDown | 5m | warning | AggregatedAPI不可用 | |
| KubeAPIDown | 15m | critical | KubeAPI不可用 | |
| kubernetes-system-kubelet | KubeNodeNotReady | 15m | warning | k8s节点长时间未就绪 |
| KubeNodeUnreachable | 2m | warning | k8s节点不可达 | |
| KubeletTooManyPods | 15m | warning | 节点的pod使用率高 | |
| KubeNodeReadinessFlapping | 15m | warning | 节点就绪状态频繁变化 | |
| KubeletPlegDurationHigh | 5m | warning | kubelet的PLEG操作耗时长 | |
| KubeletPodStartUpLatencyHigh | 15m | warning | kubelet启动pod时间长 | |
| KubeletDown | 15m | critical | kubelet不可用 | |
| kubernetes-system-scheduler | KubeSchedulerDown | 15m | critical | kube-scheduler不可用 |
| kubernetes-system-controller-manager | KubeControllerManagerDown | 15m | critical | kube-controller-manager不可用 |
| prometheus | PrometheusBadConfig | 10m | critical | prometheus加载配置文件失败 |
| PrometheusNotificationQueueRunningFull | 15m | warning | prometheus的告警通知队列将满 | |
| PrometheusErrorSendingAlertsToSomeAlertmanagers | 15m | warning | prometheus发送告警到部分alertmanager实例出错 | |
| PrometheusErrorSendingAlertsToAnyAlertmanager | 15m | critical | prometheus发送告警到所有alertmanager实例出错 | |
| PrometheusNotConnectedToAlertmanagers | 10m | warning | prometheus未连接任何alertmanager | |
| PrometheusTSDBReloadsFailing | 4h | warning | prometheus加载磁盘块数据失败 | |
| PrometheusTSDBCompactionsFailing | 4h | warning | prometheus执行compact操作失败 | |
| PrometheusNotIngestingSamples | 10m | warning | prometheus未摄入数据 | |
| PrometheusDuplicateTimestamps | 10m | warning | prometheus摄入数据的时间戳重复,重复时间戳的数据将被丢弃 | |
| PrometheusOutOfOrderTimestamps | 10m | warning | prometheus摄入数据的时间戳出现乱序,相应的数据将被丢弃 | |
| PrometheusRemoteStorageFailures | 15m | critical | prometheus写远程数据失败 | |
| PrometheusRemoteWriteBehind | 15m | critical | prometheus写远程数据滞后时间长 | |
| PrometheusRemoteWriteDesiredShards | 15m | warning | prometheus写远程需要更多shards。prometheus写远程时会启用多个shards并行写,当计算的最优shards数大于配置shards数时,会触发该告警 | |
| PrometheusRuleFailures | 15m | critical | prometheus规则评估异常 | |
| PrometheusMissingRuleEvaluations | 15m | warning | prometheus错过规则评估,一般是由于规则评估过慢 | |
| alertmanager.rules | AlertmanagerConfigInconsistent | 5m | critical | alertmanager配置不同步 |
| AlertmanagerFailedReload | 10m | warning | alertmanager加载配置失败 | |
| AlertmanagerMembersInconsistent | 5m | critical | alertmanager节点状态不一致,找不到集群内其他节点 | |
| general.rules | TargetDown | 10m | warning | Target服务的副本不可用率高 |
| Watchdog | none | |||
| node-network | NodeNetworkInterfaceFlapping | 2m | warning | 节点网络接口状态频繁变化 |
| prometheus-operator | PrometheusOperatorReconcileErrors | 10m | warning | prometheus-operator reconcile操作异常 |
| PrometheusOperatorNodeLookupErrors | 10m | warning | prometheus-operator reconcile prometheus异常 | |
| etcd | etcdMembersDown | 3m | critical | etcd节点不可用 |
| etcdInsufficientMembers | 3m | critical | etcd可用节点不足 | |
| etcdNoLeader | 1m | critical | etcd没有leader节点 | |
| etcdHighNumberOfLeaderChanges | 5m | warning | etcd的leader节点频繁变更 | |
| etcdHighNumberOfFailedGRPCRequests | 10m | warning | etcd的grpc请求失败率高(失败请求占比超过1%) | |
| etcdHighNumberOfFailedGRPCRequests | 5m | critical | etcd的grpc请求失败率高(失败请求占比超过5%) | |
| etcdGRPCRequestsSlow | 10m | critical | etcd处理GRPC请求慢 | |
| etcdMemberCommunicationSlow | 10m | warning | etcd节点间通信慢 | |
| etcdHighNumberOfFailedProposals | 15m | warning | etcd的proposal失败率高 | |
| etcdHighFsyncDurations | 10m | warning | etcd的fsync操作高延迟 | |
| etcdHighCommitDurations | 10m | warning | etcd的commit操作高延迟 | |
| etcdHighNumberOfFailedHTTPRequests | 10m | warning | etcd的http请求失败率高(失败请求占比超过1%) | |
| etcdHighNumberOfFailedHTTPRequests | 10m | critical | etcd的http请求失败率高(失败请求占比超过5%) | |
| etcdHTTPRequestsSlow | 10m | warning | etcd处理http请求慢 |
Notification Manager
告警通知
https://github.com/kubesphere/notification-manager
使用 Notification Manager 构建云原生通知系统.pptx
租户级别告警
https://www.yuque.com/liweiming/pguwkg/zm2nu8
参考
Prometheus Operator 介绍与配置解析
策略类型说明
Prometheus系列课程.pdf
http://www.zhaowenyu.com/prometheus-doc/operator/what-is-prometheus-operator.html
监控nacos
服务发现

apiVersion: monitoring.coreos.com/v1kind: ServiceMonitormetadata:name: nacosnamespace: infrastructure-prodspec:endpoints:- port: httpinterval: 30spath: /nacos/actuator/prometheusjobLabel: app.kubernetes.io/namenamespaceSelector:matchNames:- infrastructure-prodselector:matchLabels:app.kubernetes.io/name: nacos
监控面板
{"annotations": {"list": [{"builtIn": 1,"datasource": "-- Grafana --","enable": true,"hide": true,"iconColor": "rgba(0, 211, 255, 1)","name": "Annotations & Alerts","type": "dashboard"}]},"editable": true,"gnetId": null,"graphTooltip": 0,"id": 36,"iteration": 1653032675292,"links": [],"panels": [{"collapsed": true,"datasource": null,"gridPos": {"h": 1,"w": 24,"x": 0,"y": 0},"id": 80,"panels": [{"cacheTimeout": null,"colorBackground": false,"colorValue": false,"colors": ["#299c46","rgba(237, 129, 40, 0.89)","#d44a3a"],"datasource": "Prometheus-hw-cce-prod","fieldConfig": {"defaults": {"custom": {}},"overrides": []},"format": "none","gauge": {"maxValue": 100,"minValue": 0,"show": false,"thresholdLabels": false,"thresholdMarkers": true},"gridPos": {"h": 3,"w": 3,"x": 0,"y": 1},"id": 89,"interval": null,"links": [],"mappingType": 1,"mappingTypes": [{"name": "value to text","value": 1},{"name": "range to text","value": 2}],"maxDataPoints": 100,"nullPointMode": "connected","nullText": null,"postfix": "","postfixFontSize": "50%","prefix": "","prefixFontSize": "50%","rangeMaps": [{"from": "null","text": "N/A","to": "null"}],"sparkline": {"fillColor": "rgba(31, 118, 189, 0.18)","full": false,"lineColor": "rgb(31, 120, 193)","show": false},"tableColumn": "","targets": [{"expr": "count(nacos_monitor{name=\"configCount\"})","format": "time_series","intervalFactor": 1,"refId": "A"}],"thresholds": "","title": "UP","type": "singlestat","valueFontSize": "80%","valueMaps": [{"op": "=","text": "N/A","value": "null"}],"valueName": "current"},{"cacheTimeout": null,"colorBackground": false,"colorValue": false,"colors": ["#299c46","rgba(237, 129, 40, 0.89)","#d44a3a"],"datasource": "Prometheus-hw-cce-prod","fieldConfig": {"defaults": {"custom": {}},"overrides": []},"format": "none","gauge": {"maxValue": 100,"minValue": 0,"show": false,"thresholdLabels": false,"thresholdMarkers": true},"gridPos": {"h": 3,"w": 3,"x": 3,"y": 1},"id": 90,"interval": null,"links": [],"mappingType": 1,"mappingTypes": [{"name": "value to text","value": 1},{"name": "range to text","value": 2}],"maxDataPoints": 100,"nullPointMode": "connected","nullText": null,"postfix": "","postfixFontSize": "50%","prefix": "","prefixFontSize": "50%","rangeMaps": [{"from": "null","text": "N/A","to": "null"}],"sparkline": {"fillColor": "rgba(31, 118, 189, 0.18)","full": false,"lineColor": "rgb(31, 120, 193)","show": false},"tableColumn": "","targets": [{"expr": "max(nacos_monitor{name='serviceCount'})","format": "time_series","interval": "","intervalFactor": 1,"legendFormat": "","refId": "A"}],"thresholds": "","title": "service count","type": "singlestat","valueFontSize": "80%","valueMaps": [{"op": "=","text": "N/A","value": "null"}],"valueName": "current"},{"cacheTimeout": null,"colorBackground": false,"colorValue": false,"colors": ["#299c46","rgba(237, 129, 40, 0.89)","#d44a3a"],"datasource": "Prometheus-hw-cce-prod","fieldConfig": {"defaults": {"custom": {}},"overrides": []},"format": "none","gauge": {"maxValue": 100,"minValue": 0,"show": false,"thresholdLabels": false,"thresholdMarkers": true},"gridPos": {"h": 3,"w": 3,"x": 6,"y": 1},"id": 93,"interval": null,"links": [],"mappingType": 1,"mappingTypes": [{"name": "value to text","value": 1},{"name": "range to text","value": 2}],"maxDataPoints": 100,"nullPointMode": "connected","nullText": null,"postfix": "","postfixFontSize": "50%","prefix": "","prefixFontSize": "50%","rangeMaps": [{"from": "null","text": "N/A","to": "null"}],"sparkline": {"fillColor": "rgba(31, 118, 189, 0.18)","full": false,"lineColor": "rgb(31, 120, 193)","show": false},"tableColumn": "","targets": [{"expr": "max(nacos_monitor{name='ipCount'})","format": "time_series","intervalFactor": 1,"refId": "A"}],"thresholds": "","title": "ip count","type": "singlestat","valueFontSize": "80%","valueMaps": [{"op": "=","text": "N/A","value": "null"}],"valueName": "current"},{"cacheTimeout": null,"colorBackground": false,"colorValue": false,"colors": ["#299c46","rgba(237, 129, 40, 0.89)","#d44a3a"],"datasource": "Prometheus-hw-cce-prod","fieldConfig": {"defaults": {"custom": {}},"overrides": []},"format": "none","gauge": {"maxValue": 100,"minValue": 0,"show": false,"thresholdLabels": false,"thresholdMarkers": true},"gridPos": {"h": 3,"w": 3,"x": 9,"y": 1},"id": 92,"interval": null,"links": [],"mappingType": 1,"mappingTypes": [{"name": "value to text","value": 1},{"name": "range to text","value": 2}],"maxDataPoints": 100,"nullPointMode": "connected","nullText": null,"postfix": "","postfixFontSize": "50%","prefix": "","prefixFontSize": "50%","rangeMaps": [{"from": "null","text": "N/A","to": "null"}],"sparkline": {"fillColor": "rgba(31, 118, 189, 0.18)","full": false,"lineColor": "rgb(31, 120, 193)","show": false},"tableColumn": "","targets": [{"expr": "max(nacos_monitor{name='configCount', instance=~'$instance'})","format": "time_series","intervalFactor": 1,"refId": "A"}],"thresholds": "","title": "config count","type": "singlestat","valueFontSize": "80%","valueMaps": [{"op": "=","text": "N/A","value": "null"}],"valueName": "current"},{"cacheTimeout": null,"colorBackground": false,"colorValue": false,"colors": ["#299c46","rgba(237, 129, 40, 0.89)","#d44a3a"],"datasource": "Prometheus-hw-cce-prod","fieldConfig": {"defaults": {"custom": {}},"overrides": []},"format": "none","gauge": {"maxValue": 100,"minValue": 0,"show": false,"thresholdLabels": false,"thresholdMarkers": true},"gridPos": {"h": 3,"w": 3,"x": 12,"y": 1},"id": 91,"interval": null,"links": [],"mappingType": 1,"mappingTypes": [{"name": "value to text","value": 1},{"name": "range to text","value": 2}],"maxDataPoints": 100,"nullPointMode": "connected","nullText": null,"postfix": "","postfixFontSize": "50%","prefix": "","prefixFontSize": "50%","rangeMaps": [{"from": "null","text": "N/A","to": "null"}],"sparkline": {"fillColor": "rgba(31, 118, 189, 0.18)","full": false,"lineColor": "rgb(31, 120, 193)","show": false},"tableColumn": "","targets": [{"expr": "sum(nacos_monitor{name='longPolling'})","format": "time_series","intervalFactor": 1,"refId": "A"}],"thresholds": "","title": "long polling","type": "singlestat","valueFontSize": "80%","valueMaps": [{"op": "=","text": "N/A","value": "null"}],"valueName": "current"},{"cacheTimeout": null,"colorBackground": false,"colorValue": false,"colors": ["#299c46","rgba(237, 129, 40, 0.89)","#d44a3a"],"datasource": "Prometheus-hw-cce-prod","fieldConfig": {"defaults": {"custom": {}},"overrides": []},"format": "none","gauge": {"maxValue": 100,"minValue": 0,"show": false,"thresholdLabels": false,"thresholdMarkers": true},"gridPos": {"h": 3,"w": 3,"x": 15,"y": 1},"id": 88,"interval": null,"links": [],"mappingType": 1,"mappingTypes": [{"name": "value to text","value": 1},{"name": "range to text","value": 2}],"maxDataPoints": 100,"nullPointMode": "connected","nullText": null,"postfix": "","postfixFontSize": "50%","prefix": "","prefixFontSize": "50%","rangeMaps": [{"from": "null","text": "N/A","to": "null"}],"sparkline": {"fillColor": "rgba(31, 118, 189, 0.18)","full": false,"lineColor": "rgb(31, 120, 193)","show": false},"tableColumn": "","targets": [{"expr": "sum(nacos_monitor{name='getConfig', instance=~'$instance'}) by (name)","format": "time_series","intervalFactor": 1,"refId": "A"}],"thresholds": "","title": "config push total","type": "singlestat","valueFontSize": "80%","valueMaps": [{"op": "=","text": "N/A","value": "null"}],"valueName": "current"},{"datasource": null,"fieldConfig": {"defaults": {"custom": {}},"overrides": []},"gridPos": {"h": 3,"w": 6,"x": 18,"y": 1},"id": 82,"links": [],"options": {"content": "<a href=\"https://nacos.io\">\n<img src=\"https://nacos.io/img/nacos.png\" style=\"height: 50px;\" >\n</a>","mode": "html"},"pluginVersion": "7.4.3","title": "","type": "text"},{"cacheTimeout": null,"colorBackground": false,"colorPrefix": false,"colorValue": false,"colors": ["#299c46","rgba(237, 129, 40, 0.89)","#d44a3a"],"datasource": "Prometheus-hw-cce-prod","decimals": null,"fieldConfig": {"defaults": {"custom": {}},"overrides": []},"format": "none","gauge": {"maxValue": 100,"minValue": 0,"show": true,"thresholdLabels": false,"thresholdMarkers": true},"gridPos": {"h": 4,"w": 9,"x": 0,"y": 4},"id": 33,"interval": "","links": [],"mappingType": 1,"mappingTypes": [{"name": "value to text","value": 1},{"name": "range to text","value": 2}],"maxDataPoints": 100,"nullPointMode": "connected","nullText": null,"postfix": "%","postfixFontSize": "50%","prefix": "","prefixFontSize": "50%","rangeMaps": [{"from": "null","text": "N/A","to": "null"}],"repeat": null,"repeatDirection": "h","sparkline": {"fillColor": "rgba(31, 118, 189, 0.18)","full": false,"lineColor": "rgb(31, 120, 193)","show": false},"tableColumn": "","targets": [{"expr": "max(system_cpu_usage{instance=~'$instance'}) * 100","format": "time_series","interval": "","intervalFactor": 1,"legendFormat": "","refId": "A"}],"thresholds": "50,80","title": "cpu","type": "singlestat","valueFontSize": "70%","valueMaps": [{"op": "=","text": "N/A","value": "null"}],"valueName": "current"},{"cacheTimeout": null,"colorBackground": false,"colorPrefix": false,"colorValue": false,"colors": ["#299c46","rgba(237, 129, 40, 0.89)","#d44a3a"],"datasource": "Prometheus-hw-cce-prod","decimals": null,"fieldConfig": {"defaults": {"custom": {}},"overrides": []},"format": "none","gauge": {"maxValue": 70,"minValue": 0,"show": true,"thresholdLabels": false,"thresholdMarkers": true},"gridPos": {"h": 4,"w": 9,"x": 9,"y": 4},"id": 32,"interval": null,"links": [],"mappingType": 1,"mappingTypes": [{"name": "value to text","value": 1},{"name": "range to text","value": 2}],"maxDataPoints": 100,"nullPointMode": "connected","nullText": null,"postfix": "%","postfixFontSize": "50%","prefix": "","prefixFontSize": "50%","rangeMaps": [{"from": "null","text": "N/A","to": "null"}],"sparkline": {"fillColor": "rgba(31, 118, 189, 0.18)","full": false,"lineColor": "rgb(31, 120, 193)","show": false},"tableColumn": "","targets": [{"expr": "sum(jvm_memory_used_bytes{area=\"heap\", instance=~'$instance'})/sum(jvm_memory_max_bytes{area=\"heap\", instance=~'$instance'}) * 100","format": "time_series","intervalFactor": 1,"refId": "A"}],"thresholds": "50,70","title": "memory","type": "singlestat","valueFontSize": "70%","valueMaps": [{"op": "=","text": "N/A","value": "null"}],"valueName": "current"},{"dashboardFilter": "","dashboardTags": [],"datasource": null,"fieldConfig": {"defaults": {"custom": {}},"overrides": []},"folderId": null,"gridPos": {"h": 16,"w": 6,"x": 18,"y": 4},"id": 48,"limit": 10,"links": [],"nameFilter": "","onlyAlertsOnDashboard": false,"repeat": null,"show": "current","sortOrder": 1,"stateFilter": [],"title": "alert list","type": "alertlist"},{"cacheTimeout": null,"colorBackground": false,"colorPrefix": false,"colorValue": false,"colors": ["#299c46","rgba(237, 129, 40, 0.89)","#d44a3a"],"datasource": "Prometheus-hw-cce-prod","decimals": null,"fieldConfig": {"defaults": {"custom": {}},"overrides": []},"format": "none","gauge": {"maxValue": 1500,"minValue": 0,"show": true,"thresholdLabels": false,"thresholdMarkers": true},"gridPos": {"h": 4,"w": 9,"x": 0,"y": 8},"id": 29,"interval": null,"links": [],"mappingType": 1,"mappingTypes": [{"name": "value to text","value": 1},{"name": "range to text","value": 2}],"maxDataPoints": 100,"nullPointMode": "connected","nullText": null,"postfix": "","postfixFontSize": "50%","prefix": "","prefixFontSize": "50%","rangeMaps": [{"from": "null","text": "N/A","to": "null"}],"sparkline": {"fillColor": "rgba(31, 118, 189, 0.18)","full": false,"lineColor": "rgb(31, 120, 193)","show": false},"tableColumn": "","targets": [{"expr": "max(jvm_threads_daemon_threads{instance=~'$instance'})","format": "time_series","intervalFactor": 1,"refId": "A"}],"thresholds": "800,1500","title": "threads","type": "singlestat","valueFontSize": "70%","valueMaps": [{"op": "=","text": "N/A","value": "null"}],"valueName": "current"},{"cacheTimeout": null,"colorBackground": false,"colorPrefix": false,"colorValue": false,"colors": ["#299c46","rgba(237, 129, 40, 0.89)","#d44a3a"],"datasource": "Prometheus-hw-cce-prod","decimals": null,"fieldConfig": {"defaults": {"custom": {}},"overrides": []},"format": "none","gauge": {"maxValue": 20,"minValue": 0,"show": true,"thresholdLabels": false,"thresholdMarkers": true},"gridPos": {"h": 4,"w": 9,"x": 9,"y": 8},"id": 30,"interval": null,"links": [],"mappingType": 1,"mappingTypes": [{"name": "value to text","value": 1},{"name": "range to text","value": 2}],"maxDataPoints": 100,"nullPointMode": "connected","nullText": null,"postfix": "","postfixFontSize": "50%","prefix": "","prefixFontSize": "50%","rangeMaps": [{"from": "null","text": "N/A","to": "null"}],"sparkline": {"fillColor": "rgba(31, 118, 189, 0.18)","full": false,"lineColor": "rgb(31, 120, 193)","show": false},"tableColumn": "","targets": [{"expr": "max(system_load_average_1m{instance=~'$instance'})","format": "time_series","intervalFactor": 1,"refId": "A"}],"thresholds": "5,10","title": "load","type": "singlestat","valueFontSize": "70%","valueMaps": [{"op": "=","text": "N/A","value": "null"}],"valueName": "current"},{"cacheTimeout": null,"colorBackground": false,"colorPrefix": false,"colorValue": false,"colors": ["#299c46","rgba(237, 129, 40, 0.89)","#d44a3a"],"datasource": "Prometheus-hw-cce-prod","decimals": null,"fieldConfig": {"defaults": {"custom": {}},"overrides": []},"format": "none","gauge": {"maxValue": 5000,"minValue": 0,"show": true,"thresholdLabels": false,"thresholdMarkers": true},"gridPos": {"h": 4,"w": 9,"x": 0,"y": 12},"id": 61,"interval": null,"links": [],"mappingType": 1,"mappingTypes": [{"name": "value to text","value": 1},{"name": "range to text","value": 2}],"maxDataPoints": 100,"nullPointMode": "connected","nullText": null,"postfix": "ms","postfixFontSize": "50%","prefix": "","prefixFontSize": "50%","rangeMaps": [{"from": "null","text": "N/A","to": "null"}],"sparkline": {"fillColor": "rgba(31, 118, 189, 0.18)","full": false,"lineColor": "rgb(31, 120, 193)","show": false},"tableColumn": "","targets": [{"expr": "sum(rate(nacos_timer_seconds_sum{instance=~'$instance'}[1m]))/sum(rate(nacos_timer_seconds_count{instance=~'$instance'}[1m])) * 1000","format": "time_series","intervalFactor": 1,"legendFormat": "","refId": "A"}],"thresholds": "3000,5000","title": "notify rt","type": "singlestat","valueFontSize": "80%","valueMaps": [{"op": "=","text": "N/A","value": "null"}],"valueName": "current"},{"cacheTimeout": null,"colorBackground": false,"colorPrefix": false,"colorValue": false,"colors": ["#299c46","rgba(237, 129, 40, 0.89)","#d44a3a"],"datasource": "Prometheus-hw-cce-prod","decimals": null,"fieldConfig": {"defaults": {"custom": {}},"overrides": []},"format": "none","gauge": {"maxValue": 5000,"minValue": 0,"show": true,"thresholdLabels": false,"thresholdMarkers": true},"gridPos": {"h": 4,"w": 9,"x": 9,"y": 12},"id": 26,"interval": null,"links": [],"mappingType": 1,"mappingTypes": [{"name": "value to text","value": 1},{"name": "range to text","value": 2}],"maxDataPoints": 100,"nullPointMode": "connected","nullText": null,"postfix": "ms","postfixFontSize": "50%","prefix": "","prefixFontSize": "50%","rangeMaps": [{"from": "null","text": "N/A","to": "null"}],"sparkline": {"fillColor": "rgba(31, 118, 189, 0.18)","full": false,"lineColor": "rgb(31, 120, 193)","show": false},"tableColumn": "","targets": [{"expr": "sum(rate(http_server_requests_seconds_sum{instance=~'$instance'}[1m]))/sum(rate(http_server_requests_seconds_count{instance=~'$instance'}[1m])) * 1000","format": "time_series","intervalFactor": 1,"legendFormat": "","refId": "A"}],"thresholds": "3000,5000","title": "rt","type": "singlestat","valueFontSize": "80%","valueMaps": [{"op": "=","text": "N/A","value": "null"}],"valueName": "current"},{"cacheTimeout": null,"colorBackground": false,"colorPrefix": false,"colorValue": false,"colors": ["#299c46","rgba(237, 129, 40, 0.89)","#d44a3a"],"datasource": "Prometheus-hw-cce-prod","decimals": null,"fieldConfig": {"defaults": {"custom": {}},"overrides": []},"format": "none","gauge": {"maxValue": 2000,"minValue": 0,"show": true,"thresholdLabels": false,"thresholdMarkers": true},"gridPos": {"h": 4,"w": 9,"x": 0,"y": 16},"id": 25,"interval": null,"links": [],"mappingType": 1,"mappingTypes": [{"name": "value to text","value": 1},{"name": "range to text","value": 2}],"maxDataPoints": 100,"nullPointMode": "connected","nullText": null,"postfix": "","postfixFontSize": "50%","prefix": "","prefixFontSize": "50%","rangeMaps": [{"from": "null","text": "N/A","to": "null"}],"sparkline": {"fillColor": "rgba(31, 118, 189, 0.18)","full": false,"lineColor": "rgb(31, 120, 193)","show": false},"tableColumn": "","targets": [{"expr": "sum(rate(http_server_requests_seconds_count{instance=~'$instance'}[1m]))","format": "time_series","intervalFactor": 1,"legendFormat": "","refId": "A"}],"thresholds": "1000,2000","title": "qps","type": "singlestat","valueFontSize": "70%","valueMaps": [{"op": "=","text": "N/A","value": "null"}],"valueName": "current"},{"cacheTimeout": null,"colorBackground": false,"colorPrefix": false,"colorValue": false,"colors": ["#299c46","rgba(237, 129, 40, 0.89)","#d44a3a"],"datasource": "Prometheus-hw-cce-prod","decimals": null,"fieldConfig": {"defaults": {"custom": {}},"overrides": []},"format": "none","gauge": {"maxValue": 5000,"minValue": 0,"show": true,"thresholdLabels": false,"thresholdMarkers": true},"gridPos": {"h": 4,"w": 9,"x": 9,"y": 16},"id": 70,"interval": null,"links": [],"mappingType": 1,"mappingTypes": [{"name": "value to text","value": 1},{"name": "range to text","value": 2}],"maxDataPoints": 100,"nullPointMode": "connected","nullText": null,"postfix": "ms","postfixFontSize": "50%","prefix": "","prefixFontSize": "50%","rangeMaps": [{"from": "null","text": "N/A","to": "null"}],"sparkline": {"fillColor": "rgba(31, 118, 189, 0.18)","full": false,"lineColor": "rgb(31, 120, 193)","show": false},"tableColumn": "","targets": [{"expr": "max(nacos_monitor{name='avgPushCost', instance=~'$instance'})","format": "time_series","intervalFactor": 1,"refId": "A"}],"thresholds": "1000,5000","title": "avgPushCost","type": "singlestat","valueFontSize": "70%","valueMaps": [{"op": "=","text": "N/A","value": "null"}],"valueName": "current"}],"title": "nacos monitor","type": "row"},{"collapsed": true,"datasource": null,"gridPos": {"h": 1,"w": 24,"x": 0,"y": 1},"id": 78,"panels": [{"aliasColors": {},"bars": false,"dashLength": 10,"dashes": false,"datasource": "Prometheus-hw-cce-prod","fieldConfig": {"defaults": {"custom": {}},"overrides": []},"fill": 1,"fillGradient": 0,"gridPos": {"h": 5,"w": 8,"x": 0,"y": 2},"hiddenSeries": false,"id": 20,"legend": {"avg": false,"current": false,"max": false,"min": false,"show": true,"total": false,"values": false},"lines": true,"linewidth": 1,"links": [],"nullPointMode": "null","options": {"alertThreshold": true},"percentage": false,"pluginVersion": "7.4.3","pointradius": 5,"points": false,"renderer": "flot","seriesOverrides": [],"spaceLength": 10,"stack": false,"steppedLine": false,"targets": [{"expr": "sum(rate(http_server_requests_seconds_sum{uri=~'/v1/cs/configs|/nacos/v1/ns', instance=~'$instance'}[1m])/rate(http_server_requests_seconds_count{uri=~'/v1/cs/configs|/nacos/v1/ns/instance|/nacos/v1/ns/health', instance=~'$instance'}[1m])) by (method,uri) * 1000","format": "time_series","intervalFactor": 1,"refId": "A"},{"expr": "sum(rate(http_server_requests_seconds_sum{instance=~'$instance'}[1m]))/sum(rate(http_server_requests_seconds_count{instance=~'$instance'}[1m])) * 1000","format": "time_series","hide": false,"intervalFactor": 1,"legendFormat": "all","refId": "B"}],"thresholds": [],"timeFrom": null,"timeRegions": [],"timeShift": null,"title": "rt","tooltip": {"shared": true,"sort": 0,"value_type": "individual"},"type": "graph","xaxis": {"buckets": null,"mode": "time","name": null,"show": true,"values": []},"yaxes": [{"format": "short","label": null,"logBase": 1,"max": null,"min": null,"show": true},{"format": "short","label": null,"logBase": 1,"max": null,"min": null,"show": true}],"yaxis": {"align": false,"alignLevel": null}},{"aliasColors": {},"bars": false,"dashLength": 10,"dashes": false,"datasource": "Prometheus-hw-cce-prod","fieldConfig": {"defaults": {"custom": {}},"overrides": []},"fill": 1,"fillGradient": 0,"gridPos": {"h": 5,"w": 8,"x": 8,"y": 2},"hiddenSeries": false,"id": 41,"legend": {"avg": false,"current": false,"max": false,"min": false,"show": true,"total": false,"values": false},"lines": true,"linewidth": 1,"links": [],"nullPointMode": "null","options": {"alertThreshold": true},"percentage": false,"pluginVersion": "7.4.3","pointradius": 5,"points": false,"renderer": "flot","repeat": "group","repeatDirection": "h","seriesOverrides": [],"spaceLength": 10,"stack": false,"steppedLine": false,"targets": [{"expr": "sum(nacos_monitor{name='longPolling', instance=~'$instance'})","format": "time_series","intervalFactor": 1,"legendFormat": "","refId": "A"}],"thresholds": [],"timeFrom": null,"timeRegions": [],"timeShift": null,"title": "long polling","tooltip": {"shared": true,"sort": 0,"value_type": "individual"},"type": "graph","xaxis": {"buckets": null,"mode": "time","name": null,"show": true,"values": []},"yaxes": [{"format": "short","label": "","logBase": 1,"max": null,"min": null,"show": true},{"format": "short","label": null,"logBase": 1,"max": null,"min": null,"show": true}],"yaxis": {"align": false,"alignLevel": null}},{"aliasColors": {},"bars": false,"dashLength": 10,"dashes": false,"datasource": "Prometheus-hw-cce-prod","fieldConfig": {"defaults": {"custom": {}},"overrides": []},"fill": 1,"fillGradient": 0,"gridPos": {"h": 5,"w": 8,"x": 16,"y": 2},"hiddenSeries": false,"id": 37,"legend": {"avg": false,"current": false,"max": false,"min": false,"show": true,"total": false,"values": false},"lines": true,"linewidth": 1,"links": [],"nullPointMode": "null","options": {"alertThreshold": true},"percentage": false,"pluginVersion": "7.4.3","pointradius": 5,"points": false,"renderer": "flot","seriesOverrides": [],"spaceLength": 10,"stack": false,"steppedLine": false,"targets": [{"expr": "max(system_load_average_1m{instance=~'$instance'})","format": "time_series","intervalFactor": 1,"refId": "A"}],"thresholds": [],"timeFrom": null,"timeRegions": [],"timeShift": null,"title": "load 1m","tooltip": {"shared": true,"sort": 0,"value_type": "individual"},"type": "graph","xaxis": {"buckets": null,"mode": "time","name": null,"show": true,"values": []},"yaxes": [{"format": "short","label": null,"logBase": 1,"max": null,"min": null,"show": true},{"format": "short","label": null,"logBase": 1,"max": null,"min": null,"show": true}],"yaxis": {"align": false,"alignLevel": null}},{"aliasColors": {},"bars": false,"dashLength": 10,"dashes": false,"datasource": "Prometheus-hw-cce-prod","fieldConfig": {"defaults": {"custom": {}},"overrides": []},"fill": 1,"fillGradient": 0,"gridPos": {"h": 5,"w": 8,"x": 0,"y": 7},"hiddenSeries": false,"id": 18,"legend": {"avg": false,"current": false,"max": false,"min": false,"show": true,"total": false,"values": false},"lines": true,"linewidth": 1,"links": [],"nullPointMode": "null","options": {"alertThreshold": true},"percentage": false,"pluginVersion": "7.4.3","pointradius": 5,"points": false,"renderer": "flot","seriesOverrides": [],"spaceLength": 10,"stack": false,"steppedLine": false,"targets": [{"expr": "sum(rate(http_server_requests_seconds_count{uri=~'/v1/cs/configs|/nacos/v1/ns/instance|/nacos/v1/ns/health', instance=~'$instance'}[1m])) by (method,uri)","format": "time_series","intervalFactor": 1,"refId": "A"},{"expr": "sum(rate(http_server_requests_seconds_count[1m]))","format": "time_series","intervalFactor": 1,"refId": "B"}],"thresholds": [],"timeFrom": null,"timeRegions": [],"timeShift": null,"title": "qps","tooltip": {"shared": true,"sort": 0,"value_type": "individual"},"type": "graph","xaxis": {"buckets": null,"mode": "time","name": null,"show": true,"values": []},"yaxes": [{"format": "short","label": null,"logBase": 1,"max": null,"min": null,"show": true},{"format": "short","label": null,"logBase": 1,"max": null,"min": null,"show": true}],"yaxis": {"align": false,"alignLevel": null}},{"aliasColors": {},"bars": false,"dashLength": 10,"dashes": false,"datasource": "Prometheus-hw-cce-prod","fieldConfig": {"defaults": {"custom": {}},"overrides": []},"fill": 1,"fillGradient": 0,"gridPos": {"h": 5,"w": 8,"x": 8,"y": 7},"hiddenSeries": false,"id": 52,"legend": {"avg": false,"current": false,"max": false,"min": false,"show": true,"total": false,"values": false},"lines": true,"linewidth": 1,"links": [],"nullPointMode": "null","options": {"alertThreshold": true},"percentage": false,"pluginVersion": "7.4.3","pointradius": 5,"points": false,"renderer": "flot","seriesOverrides": [],"spaceLength": 10,"stack": false,"steppedLine": false,"targets": [{"expr": "sum(nacos_monitor{name='leaderStatus', instance=~'$instance'})","format": "time_series","intervalFactor": 1,"refId": "B"}],"thresholds": [],"timeFrom": null,"timeRegions": [],"timeShift": null,"title": "leaderStatus","tooltip": {"shared": true,"sort": 0,"value_type": "individual"},"type": "graph","xaxis": {"buckets": null,"mode": "time","name": null,"show": true,"values": []},"yaxes": [{"format": "short","label": null,"logBase": 1,"max": null,"min": null,"show": true},{"format": "short","label": null,"logBase": 1,"max": null,"min": null,"show": true}],"yaxis": {"align": false,"alignLevel": null}},{"aliasColors": {},"bars": false,"dashLength": 10,"dashes": false,"datasource": "Prometheus-hw-cce-prod","fieldConfig": {"defaults": {"custom": {}},"overrides": []},"fill": 1,"fillGradient": 0,"gridPos": {"h": 5,"w": 8,"x": 16,"y": 7},"hiddenSeries": false,"id": 50,"legend": {"avg": false,"current": false,"max": false,"min": false,"show": true,"total": false,"values": false},"lines": true,"linewidth": 1,"links": [],"nullPointMode": "null","options": {"alertThreshold": true},"percentage": false,"pluginVersion": "7.4.3","pointradius": 5,"points": false,"renderer": "flot","seriesOverrides": [],"spaceLength": 10,"stack": false,"steppedLine": false,"targets": [{"expr": "sum(nacos_monitor{name='avgPushCost', instance=~'$instance'})","format": "time_series","intervalFactor": 1,"refId": "A"}],"thresholds": [],"timeFrom": null,"timeRegions": [],"timeShift": null,"title": "avgPushCost","tooltip": {"shared": true,"sort": 0,"value_type": "individual"},"type": "graph","xaxis": {"buckets": null,"mode": "time","name": null,"show": true,"values": []},"yaxes": [{"format": "short","label": null,"logBase": 1,"max": null,"min": null,"show": true},{"format": "short","label": null,"logBase": 1,"max": null,"min": null,"show": true}],"yaxis": {"align": false,"alignLevel": null}},{"aliasColors": {},"bars": false,"dashLength": 10,"dashes": false,"datasource": "Prometheus-hw-cce-prod","fieldConfig": {"defaults": {"custom": {}},"overrides": []},"fill": 1,"fillGradient": 0,"gridPos": {"h": 5,"w": 8,"x": 0,"y": 12},"hiddenSeries": false,"id": 53,"legend": {"avg": false,"current": false,"max": false,"min": false,"show": true,"total": false,"values": false},"lines": true,"linewidth": 1,"links": [],"nullPointMode": "null","options": {"alertThreshold": true},"percentage": false,"pluginVersion": "7.4.3","pointradius": 5,"points": false,"renderer": "flot","seriesOverrides": [],"spaceLength": 10,"stack": false,"steppedLine": false,"targets": [{"expr": "max(nacos_monitor{name='maxPushCost', instance=~'$instance'})","format": "time_series","intervalFactor": 1,"refId": "A"}],"thresholds": [],"timeFrom": null,"timeRegions": [],"timeShift": null,"title": "maxPushCost","tooltip": {"shared": true,"sort": 0,"value_type": "individual"},"type": "graph","xaxis": {"buckets": null,"mode": "time","name": null,"show": true,"values": []},"yaxes": [{"format": "short","label": null,"logBase": 1,"max": null,"min": null,"show": true},{"format": "short","label": null,"logBase": 1,"max": null,"min": null,"show": true}],"yaxis": {"align": false,"alignLevel": null}},{"aliasColors": {},"bars": false,"dashLength": 10,"dashes": false,"datasource": "Prometheus-hw-cce-prod","fieldConfig": {"defaults": {"custom": {}},"overrides": []},"fill": 1,"fillGradient": 0,"gridPos": {"h": 5,"w": 8,"x": 8,"y": 12},"hiddenSeries": false,"id": 83,"legend": {"avg": false,"current": false,"max": false,"min": false,"show": true,"total": false,"values": false},"lines": true,"linewidth": 1,"links": [],"nullPointMode": "null","options": {"alertThreshold": true},"percentage": false,"pluginVersion": "7.4.3","pointradius": 5,"points": false,"renderer": "flot","seriesOverrides": [],"spaceLength": 10,"stack": false,"steppedLine": false,"targets": [{"expr": "sum(nacos_monitor{name='publish', instance=~'$instance'}) by (name)","format": "time_series","intervalFactor": 1,"legendFormat": "publish config","refId": "A"},{"expr": "sum(nacos_monitor{name='getConfig', instance=~'$instance'}) by (name)","format": "time_series","intervalFactor": 1,"legendFormat": "get config","refId": "B"}],"thresholds": [],"timeFrom": null,"timeRegions": [],"timeShift": null,"title": "config statistics","tooltip": {"shared": true,"sort": 0,"value_type": "individual"},"type": "graph","xaxis": {"buckets": null,"mode": "time","name": null,"show": true,"values": []},"yaxes": [{"format": "short","label": null,"logBase": 1,"max": null,"min": null,"show": true},{"format": "short","label": null,"logBase": 1,"max": null,"min": null,"show": true}],"yaxis": {"align": false,"alignLevel": null}},{"aliasColors": {},"bars": false,"dashLength": 10,"dashes": false,"datasource": "Prometheus-hw-cce-prod","fieldConfig": {"defaults": {"custom": {}},"overrides": []},"fill": 1,"fillGradient": 0,"gridPos": {"h": 5,"w": 8,"x": 16,"y": 12},"hiddenSeries": false,"id": 16,"legend": {"avg": false,"current": false,"max": false,"min": false,"show": true,"total": false,"values": false},"lines": true,"linewidth": 1,"links": [],"nullPointMode": "null","options": {"alertThreshold": true},"percentage": false,"pluginVersion": "7.4.3","pointradius": 5,"points": false,"renderer": "flot","seriesOverrides": [],"spaceLength": 10,"stack": false,"steppedLine": false,"targets": [{"expr": "sum(rate(nacos_monitor{name=~'.*HealthCheck', instance=~'$instance'}[1m])) by (name) * 60","format": "time_series","intervalFactor": 1,"legendFormat": "","refId": "A"}],"thresholds": [],"timeFrom": null,"timeRegions": [],"timeShift": null,"title": "health check","tooltip": {"shared": true,"sort": 0,"value_type": "individual"},"type": "graph","xaxis": {"buckets": null,"mode": "time","name": null,"show": true,"values": []},"yaxes": [{"format": "short","label": null,"logBase": 1,"max": null,"min": null,"show": true},{"format": "short","label": null,"logBase": 1,"max": null,"min": null,"show": true}],"yaxis": {"align": false,"alignLevel": null}}],"title": "nacos detail","type": "row"},{"collapsed": true,"datasource": null,"gridPos": {"h": 1,"w": 24,"x": 0,"y": 2},"id": 74,"panels": [{"alert": {"conditions": [{"evaluator": {"params": [50],"type": "gt"},"operator": {"type": "and"},"query": {"params": ["A","1m","now"]},"reducer": {"params": [],"type": "avg"},"type": "query"}],"executionErrorState": "keep_state","for": "1m","frequency": "1m","handler": 1,"name": "cpu alert","noDataState": "ok","notifications": [{"id": 1}]},"aliasColors": {},"bars": false,"dashLength": 10,"dashes": false,"datasource": "Prometheus-hw-cce-prod","fieldConfig": {"defaults": {"custom": {}},"overrides": []},"fill": 1,"fillGradient": 0,"gridPos": {"h": 5,"w": 8,"x": 0,"y": 3},"hiddenSeries": false,"id": 45,"legend": {"avg": false,"current": false,"max": false,"min": false,"show": true,"total": false,"values": false},"lines": true,"linewidth": 1,"links": [],"nullPointMode": "null","options": {"alertThreshold": true},"percentage": false,"pluginVersion": "7.4.3","pointradius": 5,"points": false,"renderer": "flot","seriesOverrides": [],"spaceLength": 10,"stack": false,"steppedLine": false,"targets": [{"expr": "max(system_cpu_usage) * 100","format": "time_series","intervalFactor": 1,"refId": "A"}],"thresholds": [{"colorMode": "critical","fill": true,"line": true,"op": "gt","value": 50,"visible": true}],"timeFrom": null,"timeRegions": [],"timeShift": null,"title": "cpu alert","tooltip": {"shared": true,"sort": 0,"value_type": "individual"},"type": "graph","xaxis": {"buckets": null,"mode": "time","name": null,"show": true,"values": []},"yaxes": [{"format": "short","label": null,"logBase": 1,"max": null,"min": null,"show": true},{"format": "short","label": null,"logBase": 1,"max": null,"min": null,"show": true}],"yaxis": {"align": false,"alignLevel": null}},{"alert": {"conditions": [{"evaluator": {"params": [15],"type": "gt"},"operator": {"type": "and"},"query": {"params": ["A","1m","now"]},"reducer": {"params": [],"type": "avg"},"type": "query"}],"executionErrorState": "keep_state","frequency": "60s","handler": 1,"name": "load 1m alert","noDataState": "ok","notifications": []},"aliasColors": {},"bars": false,"dashLength": 10,"dashes": false,"datasource": "Prometheus-hw-cce-prod","fieldConfig": {"defaults": {"custom": {}},"overrides": []},"fill": 1,"fillGradient": 0,"gridPos": {"h": 5,"w": 8,"x": 8,"y": 3},"hiddenSeries": false,"id": 86,"legend": {"avg": false,"current": false,"max": false,"min": false,"show": true,"total": false,"values": false},"lines": true,"linewidth": 1,"links": [],"nullPointMode": "null","options": {"alertThreshold": true},"percentage": false,"pluginVersion": "7.4.3","pointradius": 5,"points": false,"renderer": "flot","seriesOverrides": [],"spaceLength": 10,"stack": false,"steppedLine": false,"targets": [{"expr": "max(system_load_average_1m)","format": "time_series","intervalFactor": 1,"refId": "A"}],"thresholds": [{"colorMode": "critical","fill": true,"line": true,"op": "gt","value": 15,"visible": true}],"timeFrom": null,"timeRegions": [],"timeShift": null,"title": "load alert","tooltip": {"shared": true,"sort": 0,"value_type": "individual"},"type": "graph","xaxis": {"buckets": null,"mode": "time","name": null,"show": true,"values": []},"yaxes": [{"format": "short","label": null,"logBase": 1,"max": null,"min": null,"show": true},{"format": "short","label": null,"logBase": 1,"max": null,"min": null,"show": true}],"yaxis": {"align": false,"alignLevel": null}},{"alert": {"conditions": [{"evaluator": {"params": [60],"type": "gt"},"operator": {"type": "and"},"query": {"params": ["A","5m","now"]},"reducer": {"params": [],"type": "avg"},"type": "query"}],"executionErrorState": "keep_state","frequency": "60s","handler": 1,"name": "memory alert","noDataState": "ok","notifications": []},"aliasColors": {},"bars": false,"dashLength": 10,"dashes": false,"datasource": "Prometheus-hw-cce-prod","fieldConfig": {"defaults": {"custom": {}},"overrides": []},"fill": 1,"fillGradient": 0,"gridPos": {"h": 5,"w": 8,"x": 16,"y": 3},"hiddenSeries": false,"id": 46,"legend": {"avg": false,"current": false,"max": false,"min": false,"show": true,"total": false,"values": false},"lines": true,"linewidth": 1,"links": [],"nullPointMode": "null","options": {"alertThreshold": true},"percentage": false,"pluginVersion": "7.4.3","pointradius": 5,"points": false,"renderer": "flot","seriesOverrides": [],"spaceLength": 10,"stack": false,"steppedLine": false,"targets": [{"expr": "sum(jvm_memory_used_bytes{area=\"heap\"})/sum(jvm_memory_max_bytes{area=\"heap\"}) * 100","format": "time_series","intervalFactor": 1,"refId": "A"}],"thresholds": [{"colorMode": "critical","fill": true,"line": true,"op": "gt","value": 60,"visible": true}],"timeFrom": null,"timeRegions": [],"timeShift": null,"title": "memory alert","tooltip": {"shared": true,"sort": 0,"value_type": "individual"},"type": "graph","xaxis": {"buckets": null,"mode": "time","name": null,"show": true,"values": []},"yaxes": [{"format": "short","label": null,"logBase": 1,"max": null,"min": null,"show": true},{"format": "short","label": null,"logBase": 1,"max": null,"min": null,"show": true}],"yaxis": {"align": false,"alignLevel": null}},{"alert": {"conditions": [{"evaluator": {"params": [500],"type": "gt"},"operator": {"type": "and"},"query": {"params": ["A","1m","now"]},"reducer": {"params": [],"type": "avg"},"type": "query"}],"executionErrorState": "keep_state","frequency": "60s","handler": 1,"name": "threads alert","noDataState": "ok","notifications": []},"aliasColors": {},"bars": false,"dashLength": 10,"dashes": false,"datasource": "Prometheus-hw-cce-prod","fieldConfig": {"defaults": {"custom": {}},"overrides": []},"fill": 1,"fillGradient": 0,"gridPos": {"h": 5,"w": 8,"x": 0,"y": 8},"hiddenSeries": false,"id": 39,"legend": {"avg": false,"current": false,"max": false,"min": false,"show": true,"total": false,"values": false},"lines": true,"linewidth": 1,"links": [],"nullPointMode": "null","options": {"alertThreshold": true},"percentage": false,"pluginVersion": "7.4.3","pointradius": 5,"points": false,"renderer": "flot","seriesOverrides": [],"spaceLength": 10,"stack": false,"steppedLine": false,"targets": [{"expr": "max(jvm_threads_daemon_threads)","format": "time_series","intervalFactor": 1,"refId": "A"}],"thresholds": [{"colorMode": "critical","fill": true,"line": true,"op": "gt","value": 500,"visible": true}],"timeFrom": null,"timeRegions": [],"timeShift": null,"title": "threads alert","tooltip": {"shared": true,"sort": 0,"value_type": "individual"},"type": "graph","xaxis": {"buckets": null,"mode": "time","name": null,"show": true,"values": []},"yaxes": [{"format": "short","label": null,"logBase": 1,"max": null,"min": null,"show": true},{"format": "short","label": null,"logBase": 1,"max": null,"min": null,"show": true}],"yaxis": {"align": false,"alignLevel": null}},{"alert": {"conditions": [{"evaluator": {"params": [5],"type": "gt"},"operator": {"type": "and"},"query": {"params": ["A","1m","now"]},"reducer": {"params": [],"type": "avg"},"type": "query"}],"executionErrorState": "keep_state","for": "1m","frequency": "1m","handler": 1,"message": "too many full gc","name": "gc alert","noDataState": "ok","notifications": [{"id": 1}]},"aliasColors": {},"bars": false,"dashLength": 10,"dashes": false,"datasource": "Prometheus-hw-cce-prod","fieldConfig": {"defaults": {"custom": {}},"overrides": []},"fill": 1,"fillGradient": 0,"gridPos": {"h": 5,"w": 8,"x": 8,"y": 8},"hiddenSeries": false,"id": 38,"legend": {"avg": false,"current": false,"max": false,"min": false,"show": true,"total": false,"values": false},"lines": true,"linewidth": 1,"links": [],"nullPointMode": "null","options": {"alertThreshold": true},"percentage": false,"pluginVersion": "7.4.3","pointradius": 5,"points": false,"renderer": "flot","seriesOverrides": [],"spaceLength": 10,"stack": false,"steppedLine": false,"targets": [{"expr": "max(rate(jvm_gc_pause_seconds_count{action=\"end of major GC\"}[5m])) * 300","format": "time_series","intervalFactor": 1,"refId": "A"}],"thresholds": [{"colorMode": "critical","fill": true,"line": true,"op": "gt","value": 5,"visible": true}],"timeFrom": null,"timeRegions": [],"timeShift": null,"title": "gc alert","tooltip": {"shared": true,"sort": 0,"value_type": "individual"},"type": "graph","xaxis": {"buckets": null,"mode": "time","name": null,"show": true,"values": []},"yaxes": [{"format": "short","label": null,"logBase": 1,"max": null,"min": null,"show": true},{"format": "short","label": null,"logBase": 1,"max": null,"min": null,"show": true}],"yaxis": {"align": false,"alignLevel": null}},{"alert": {"conditions": [{"evaluator": {"params": [10],"type": "gt"},"operator": {"type": "and"},"query": {"params": ["A","1m","now"]},"reducer": {"params": [],"type": "avg"},"type": "query"}],"executionErrorState": "keep_state","frequency": "60s","handler": 1,"name": "notify task alert","noDataState": "ok","notifications": []},"aliasColors": {},"bars": false,"dashLength": 10,"dashes": false,"datasource": "Prometheus-hw-cce-prod","fieldConfig": {"defaults": {"custom": {}},"overrides": []},"fill": 1,"fillGradient": 0,"gridPos": {"h": 5,"w": 8,"x": 16,"y": 8},"hiddenSeries": false,"id": 49,"legend": {"avg": false,"current": false,"max": false,"min": false,"show": true,"total": false,"values": false},"lines": true,"linewidth": 1,"links": [],"nullPointMode": "null","options": {"alertThreshold": true},"percentage": false,"pluginVersion": "7.4.3","pointradius": 5,"points": false,"renderer": "flot","seriesOverrides": [],"spaceLength": 10,"stack": false,"steppedLine": false,"targets": [{"expr": "sum(nacos_monitor{name='notifyTask'})","format": "time_series","intervalFactor": 1,"refId": "A"}],"thresholds": [{"colorMode": "critical","fill": true,"line": true,"op": "gt","value": 10,"visible": true}],"timeFrom": null,"timeRegions": [],"timeShift": null,"title": "notify task alert","tooltip": {"shared": true,"sort": 0,"value_type": "individual"},"type": "graph","xaxis": {"buckets": null,"mode": "time","name": null,"show": true,"values": []},"yaxes": [{"format": "short","label": null,"logBase": 1,"max": null,"min": null,"show": true},{"format": "short","label": null,"logBase": 1,"max": null,"min": null,"show": true}],"yaxis": {"align": false,"alignLevel": null}},{"alert": {"conditions": [{"evaluator": {"params": [5000],"type": "gt"},"operator": {"type": "and"},"query": {"params": ["B","1m","now"]},"reducer": {"params": [],"type": "avg"},"type": "query"}],"executionErrorState": "keep_state","frequency": "60s","handler": 1,"name": "rt alert","noDataState": "ok","notifications": []},"aliasColors": {},"bars": false,"dashLength": 10,"dashes": false,"datasource": "Prometheus-hw-cce-prod","fieldConfig": {"defaults": {"custom": {}},"overrides": []},"fill": 1,"fillGradient": 0,"gridPos": {"h": 5,"w": 8,"x": 0,"y": 13},"hiddenSeries": false,"id": 85,"legend": {"avg": false,"current": false,"max": false,"min": false,"show": true,"total": false,"values": false},"lines": true,"linewidth": 1,"links": [],"nullPointMode": "null","options": {"alertThreshold": true},"percentage": false,"pluginVersion": "7.4.3","pointradius": 5,"points": false,"renderer": "flot","seriesOverrides": [],"spaceLength": 10,"stack": false,"steppedLine": false,"targets": [{"expr": "sum(rate(http_server_requests_seconds_sum[1m]))/sum(rate(http_server_requests_seconds_count[1m])) * 1000","format": "time_series","hide": false,"intervalFactor": 1,"refId": "B"}],"thresholds": [{"colorMode": "critical","fill": true,"line": true,"op": "gt","value": 5000,"visible": true}],"timeFrom": null,"timeRegions": [],"timeShift": null,"title": "rt alert","tooltip": {"shared": true,"sort": 0,"value_type": "individual"},"type": "graph","xaxis": {"buckets": null,"mode": "time","name": null,"show": true,"values": []},"yaxes": [{"format": "short","label": null,"logBase": 1,"max": null,"min": null,"show": true},{"format": "short","label": null,"logBase": 1,"max": null,"min": null,"show": true}],"yaxis": {"align": false,"alignLevel": null}},{"alert": {"conditions": [{"evaluator": {"params": [5000],"type": "gt"},"operator": {"type": "and"},"query": {"params": ["A","1m","now"]},"reducer": {"params": [],"type": "avg"},"type": "query"}],"executionErrorState": "keep_state","frequency": "60s","handler": 1,"name": "long polling alert","noDataState": "ok","notifications": []},"aliasColors": {},"bars": false,"dashLength": 10,"dashes": false,"datasource": "Prometheus-hw-cce-prod","fieldConfig": {"defaults": {"custom": {}},"overrides": []},"fill": 1,"fillGradient": 0,"gridPos": {"h": 5,"w": 8,"x": 8,"y": 13},"hiddenSeries": false,"id": 84,"legend": {"avg": false,"current": false,"max": false,"min": false,"show": true,"total": false,"values": false},"lines": true,"linewidth": 1,"links": [],"nullPointMode": "null","options": {"alertThreshold": true},"percentage": false,"pluginVersion": "7.4.3","pointradius": 5,"points": false,"renderer": "flot","repeatDirection": "h","seriesOverrides": [],"spaceLength": 10,"stack": false,"steppedLine": false,"targets": [{"expr": "max(nacos_monitor{name='longPolling'})","format": "time_series","intervalFactor": 1,"legendFormat": "","refId": "A"}],"thresholds": [{"colorMode": "critical","fill": true,"line": true,"op": "gt","value": 5000,"visible": true}],"timeFrom": null,"timeRegions": [],"timeShift": null,"title": "long polling alert","tooltip": {"shared": true,"sort": 0,"value_type": "individual"},"type": "graph","xaxis": {"buckets": null,"mode": "time","name": null,"show": true,"values": []},"yaxes": [{"format": "short","label": "","logBase": 1,"max": null,"min": null,"show": true},{"format": "short","label": null,"logBase": 1,"max": null,"min": null,"show": true}],"yaxis": {"align": false,"alignLevel": null}},{"alert": {"conditions": [{"evaluator": {"params": [1],"type": "gt"},"operator": {"type": "and"},"query": {"params": ["A","1m","now"]},"reducer": {"params": [],"type": "avg"},"type": "query"}],"executionErrorState": "keep_state","frequency": "60s","handler": 1,"name": "config unhealth exception alert","noDataState": "ok","notifications": []},"aliasColors": {},"bars": false,"dashLength": 10,"dashes": false,"datasource": "Prometheus-hw-cce-prod","fieldConfig": {"defaults": {"custom": {}},"overrides": []},"fill": 1,"fillGradient": 0,"gridPos": {"h": 5,"w": 8,"x": 16,"y": 13},"hiddenSeries": false,"id": 56,"legend": {"avg": false,"current": false,"max": false,"min": false,"show": true,"total": false,"values": false},"lines": true,"linewidth": 1,"links": [],"nullPointMode": "null","options": {"alertThreshold": true},"percentage": false,"pluginVersion": "7.4.3","pointradius": 5,"points": false,"renderer": "flot","seriesOverrides": [],"spaceLength": 10,"stack": false,"steppedLine": false,"targets": [{"expr": "sum(rate(nacos_exception_total{name='unhealth'}[1m])) * 60","format": "time_series","intervalFactor": 1,"refId": "A"}],"thresholds": [{"colorMode": "critical","fill": true,"line": true,"op": "gt","value": 1,"visible": true}],"timeFrom": null,"timeRegions": [],"timeShift": null,"title": "config unhealth exception alert","tooltip": {"shared": true,"sort": 0,"value_type": "individual"},"type": "graph","xaxis": {"buckets": null,"mode": "time","name": null,"show": true,"values": []},"yaxes": [{"format": "short","label": null,"logBase": 1,"max": null,"min": null,"show": true},{"format": "short","label": null,"logBase": 1,"max": null,"min": null,"show": true}],"yaxis": {"align": false,"alignLevel": null}},{"alert": {"conditions": [{"evaluator": {"params": [1],"type": "gt"},"operator": {"type": "and"},"query": {"params": ["A","1m","now"]},"reducer": {"params": [],"type": "avg"},"type": "query"}],"executionErrorState": "keep_state","frequency": "60s","handler": 1,"name": "db exception alert","noDataState": "ok","notifications": []},"aliasColors": {},"bars": false,"dashLength": 10,"dashes": false,"datasource": "Prometheus-hw-cce-prod","fieldConfig": {"defaults": {"custom": {}},"overrides": []},"fill": 1,"fillGradient": 0,"gridPos": {"h": 5,"w": 8,"x": 0,"y": 18},"hiddenSeries": false,"id": 54,"legend": {"avg": false,"current": false,"max": false,"min": false,"show": true,"total": false,"values": false},"lines": true,"linewidth": 1,"links": [],"nullPointMode": "null","options": {"alertThreshold": true},"percentage": false,"pluginVersion": "7.4.3","pointradius": 5,"points": false,"renderer": "flot","seriesOverrides": [],"spaceLength": 10,"stack": false,"steppedLine": false,"targets": [{"expr": "sum(rate(nacos_exception_total{name='db'}[1m])) * 60","format": "time_series","intervalFactor": 1,"refId": "A"}],"thresholds": [{"colorMode": "critical","fill": true,"line": true,"op": "gt","value": 1,"visible": true}],"timeFrom": null,"timeRegions": [],"timeShift": null,"title": "db exception alert","tooltip": {"shared": true,"sort": 0,"value_type": "individual"},"type": "graph","xaxis": {"buckets": null,"mode": "time","name": null,"show": true,"values": []},"yaxes": [{"format": "short","label": null,"logBase": 1,"max": null,"min": null,"show": true},{"format": "short","label": null,"logBase": 1,"max": null,"min": null,"show": true}],"yaxis": {"align": false,"alignLevel": null}},{"alert": {"conditions": [{"evaluator": {"params": [1],"type": "gt"},"operator": {"type": "and"},"query": {"params": ["A","1m","now"]},"reducer": {"params": [],"type": "avg"},"type": "query"}],"executionErrorState": "keep_state","frequency": "60s","handler": 1,"name": "failedPush alert","noDataState": "ok","notifications": []},"aliasColors": {},"bars": false,"dashLength": 10,"dashes": false,"datasource": "Prometheus-hw-cce-prod","fieldConfig": {"defaults": {"custom": {}},"overrides": []},"fill": 1,"fillGradient": 0,"gridPos": {"h": 5,"w": 8,"x": 8,"y": 18},"hiddenSeries": false,"id": 51,"legend": {"avg": false,"current": false,"max": false,"min": false,"show": true,"total": false,"values": false},"lines": true,"linewidth": 1,"links": [],"nullPointMode": "null","options": {"alertThreshold": true},"percentage": false,"pluginVersion": "7.4.3","pointradius": 5,"points": false,"renderer": "flot","seriesOverrides": [],"spaceLength": 10,"stack": false,"steppedLine": false,"targets": [{"expr": "sum(nacos_monitor{name='failedPush'})","format": "time_series","intervalFactor": 1,"refId": "A"}],"thresholds": [{"colorMode": "critical","fill": true,"line": true,"op": "gt","value": 1,"visible": true}],"timeFrom": null,"timeRegions": [],"timeShift": null,"title": "failed push alert","tooltip": {"shared": true,"sort": 0,"value_type": "individual"},"type": "graph","xaxis": {"buckets": null,"mode": "time","name": null,"show": true,"values": []},"yaxes": [{"format": "short","label": null,"logBase": 1,"max": null,"min": null,"show": true},{"format": "short","label": null,"logBase": 1,"max": null,"min": null,"show": true}],"yaxis": {"align": false,"alignLevel": null}},{"alert": {"conditions": [{"evaluator": {"params": [1],"type": "gt"},"operator": {"type": "and"},"query": {"params": ["A","1m","now"]},"reducer": {"params": [],"type": "avg"},"type": "query"}],"executionErrorState": "keep_state","frequency": "60s","handler": 1,"name": "illegalArgument exception alert","noDataState": "ok","notifications": []},"aliasColors": {},"bars": false,"dashLength": 10,"dashes": false,"datasource": "Prometheus-hw-cce-prod","fieldConfig": {"defaults": {"custom": {}},"overrides": []},"fill": 1,"fillGradient": 0,"gridPos": {"h": 5,"w": 8,"x": 16,"y": 18},"hiddenSeries": false,"id": 59,"legend": {"avg": false,"current": false,"max": false,"min": false,"show": true,"total": false,"values": false},"lines": true,"linewidth": 1,"links": [],"nullPointMode": "null","options": {"alertThreshold": true},"percentage": false,"pluginVersion": "7.4.3","pointradius": 5,"points": false,"renderer": "flot","seriesOverrides": [],"spaceLength": 10,"stack": false,"steppedLine": false,"targets": [{"expr": "sum(rate(nacos_exception_total{name='illegalArgument'}[1m])) * 60","format": "time_series","intervalFactor": 1,"refId": "A"}],"thresholds": [{"colorMode": "critical","fill": true,"line": true,"op": "gt","value": 1,"visible": true}],"timeFrom": null,"timeRegions": [],"timeShift": null,"title": "illegalArgument exception alert","tooltip": {"shared": true,"sort": 0,"value_type": "individual"},"type": "graph","xaxis": {"buckets": null,"mode": "time","name": null,"show": true,"values": []},"yaxes": [{"format": "short","label": null,"logBase": 1,"max": null,"min": null,"show": true},{"format": "short","label": null,"logBase": 1,"max": null,"min": null,"show": true}],"yaxis": {"align": false,"alignLevel": null}},{"alert": {"conditions": [{"evaluator": {"params": [1],"type": "gt"},"operator": {"type": "and"},"query": {"params": ["A","5m","now"]},"reducer": {"params": [],"type": "avg"},"type": "query"}],"executionErrorState": "keep_state","frequency": "60s","handler": 1,"name": "naming disk exception alert","noDataState": "ok","notifications": []},"aliasColors": {},"bars": false,"dashLength": 10,"dashes": false,"datasource": "Prometheus-hw-cce-prod","fieldConfig": {"defaults": {"custom": {}},"overrides": []},"fill": 1,"fillGradient": 0,"gridPos": {"h": 5,"w": 8,"x": 0,"y": 23},"hiddenSeries": false,"id": 57,"legend": {"avg": false,"current": false,"max": false,"min": false,"show": true,"total": false,"values": false},"lines": true,"linewidth": 1,"links": [],"nullPointMode": "null","options": {"alertThreshold": true},"percentage": false,"pluginVersion": "7.4.3","pointradius": 5,"points": false,"renderer": "flot","seriesOverrides": [],"spaceLength": 10,"stack": false,"steppedLine": false,"targets": [{"expr": "sum(rate(nacos_exception_total{name='disk'}[1m])) * 60","format": "time_series","intervalFactor": 1,"refId": "A"}],"thresholds": [{"colorMode": "critical","fill": true,"line": true,"op": "gt","value": 1,"visible": true}],"timeFrom": null,"timeRegions": [],"timeShift": null,"title": "naming disk exception alert","tooltip": {"shared": true,"sort": 0,"value_type": "individual"},"type": "graph","xaxis": {"buckets": null,"mode": "time","name": null,"show": true,"values": []},"yaxes": [{"format": "short","label": null,"logBase": 1,"max": null,"min": null,"show": true},{"format": "short","label": null,"logBase": 1,"max": null,"min": null,"show": true}],"yaxis": {"align": false,"alignLevel": null}},{"alert": {"conditions": [{"evaluator": {"params": [1],"type": "gt"},"operator": {"type": "and"},"query": {"params": ["A","1m","now"]},"reducer": {"params": [],"type": "avg"},"type": "query"}],"executionErrorState": "keep_state","frequency": "60s","handler": 1,"name": "config notify exception alert","noDataState": "ok","notifications": []},"aliasColors": {},"bars": false,"dashLength": 10,"dashes": false,"datasource": "Prometheus-hw-cce-prod","fieldConfig": {"defaults": {"custom": {}},"overrides": []},"fill": 1,"fillGradient": 0,"gridPos": {"h": 5,"w": 8,"x": 8,"y": 23},"hiddenSeries": false,"id": 55,"legend": {"avg": false,"current": false,"max": false,"min": false,"show": true,"total": false,"values": false},"lines": true,"linewidth": 1,"links": [],"nullPointMode": "null","options": {"alertThreshold": true},"percentage": false,"pluginVersion": "7.4.3","pointradius": 5,"points": false,"renderer": "flot","seriesOverrides": [],"spaceLength": 10,"stack": false,"steppedLine": false,"targets": [{"expr": "sum(rate(nacos_exception_total{name='configNotify'}[1m])) * 60","format": "time_series","intervalFactor": 1,"refId": "A"}],"thresholds": [{"colorMode": "critical","fill": true,"line": true,"op": "gt","value": 1,"visible": true}],"timeFrom": null,"timeRegions": [],"timeShift": null,"title": "config notify exception alert","tooltip": {"shared": true,"sort": 0,"value_type": "individual"},"type": "graph","xaxis": {"buckets": null,"mode": "time","name": null,"show": true,"values": []},"yaxes": [{"format": "short","label": null,"logBase": 1,"max": null,"min": null,"show": true},{"format": "short","label": null,"logBase": 1,"max": null,"min": null,"show": true}],"yaxis": {"align": false,"alignLevel": null}},{"alert": {"conditions": [{"evaluator": {"params": [1],"type": "gt"},"operator": {"type": "and"},"query": {"params": ["A","1m","now"]},"reducer": {"params": [],"type": "avg"},"type": "query"}],"executionErrorState": "keep_state","frequency": "60s","handler": 1,"name": "naming leader send beat failed exception alert","noDataState": "ok","notifications": []},"aliasColors": {},"bars": false,"dashLength": 10,"dashes": false,"datasource": "Prometheus-hw-cce-prod","fieldConfig": {"defaults": {"custom": {}},"overrides": []},"fill": 1,"fillGradient": 0,"gridPos": {"h": 5,"w": 8,"x": 16,"y": 23},"hiddenSeries": false,"id": 58,"legend": {"avg": false,"current": false,"max": false,"min": false,"show": true,"total": false,"values": false},"lines": true,"linewidth": 1,"links": [],"nullPointMode": "null","options": {"alertThreshold": true},"percentage": false,"pluginVersion": "7.4.3","pointradius": 5,"points": false,"renderer": "flot","seriesOverrides": [],"spaceLength": 10,"stack": false,"steppedLine": false,"targets": [{"expr": "sum(rate(nacos_exception_total{name='leaderSendBeatFailed'}[1m])) * 60","format": "time_series","intervalFactor": 1,"refId": "A"}],"thresholds": [{"colorMode": "critical","fill": true,"line": true,"op": "gt","value": 1,"visible": true}],"timeFrom": null,"timeRegions": [],"timeShift": null,"title": "naming leader send beat failed exception alert","tooltip": {"shared": true,"sort": 0,"value_type": "individual"},"type": "graph","xaxis": {"buckets": null,"mode": "time","name": null,"show": true,"values": []},"yaxes": [{"format": "short","label": null,"logBase": 1,"max": null,"min": null,"show": true},{"format": "short","label": null,"logBase": 1,"max": null,"min": null,"show": true}],"yaxis": {"align": false,"alignLevel": null}},{"alert": {"conditions": [{"evaluator": {"params": [1],"type": "gt"},"operator": {"type": "and"},"query": {"params": ["A","1m","now"]},"reducer": {"params": [],"type": "avg"},"type": "query"}],"executionErrorState": "keep_state","frequency": "60s","handler": 1,"name": "nacos_exception alert","noDataState": "ok","notifications": []},"aliasColors": {},"bars": false,"dashLength": 10,"dashes": false,"datasource": "Prometheus-hw-cce-prod","fieldConfig": {"defaults": {"custom": {}},"overrides": []},"fill": 1,"fillGradient": 0,"gridPos": {"h": 5,"w": 8,"x": 0,"y": 28},"hiddenSeries": false,"id": 60,"legend": {"avg": false,"current": false,"max": false,"min": false,"show": true,"total": false,"values": false},"lines": true,"linewidth": 1,"links": [],"nullPointMode": "null","options": {"alertThreshold": true},"percentage": false,"pluginVersion": "7.4.3","pointradius": 5,"points": false,"renderer": "flot","seriesOverrides": [],"spaceLength": 10,"stack": false,"steppedLine": false,"targets": [{"expr": "sum(rate(nacos_exception_total{name='nacos'}[1m])) * 60","format": "time_series","intervalFactor": 1,"refId": "A"}],"thresholds": [{"colorMode": "critical","fill": true,"line": true,"op": "gt","value": 1,"visible": true}],"timeFrom": null,"timeRegions": [],"timeShift": null,"title": "nacos exception alert","tooltip": {"shared": true,"sort": 0,"value_type": "individual"},"type": "graph","xaxis": {"buckets": null,"mode": "time","name": null,"show": true,"values": []},"yaxes": [{"format": "short","label": null,"logBase": 1,"max": null,"min": null,"show": true},{"format": "short","label": null,"logBase": 1,"max": null,"min": null,"show": true}],"yaxis": {"align": false,"alignLevel": null}}],"title": "nacos alert","type": "row"}],"refresh": "5s","schemaVersion": 27,"style": "dark","tags": [],"templating": {"list": [{"allValue": ".*:8848","current": {"selected": false,"text": "All","value": "$__all"},"datasource": "Prometheus-hw-cce-prod","definition": "label_values(instance)","description": null,"error": null,"hide": 0,"includeAll": true,"label": "instance","multi": false,"name": "instance","options": [],"query": {"query": "label_values(instance)","refId": "Prometheus-hw-cce-prod-instance-Variable-Query"},"refresh": 2,"regex": "/.*:8848/","skipUrlSync": false,"sort": 0,"tagValuesQuery": "","tags": [],"tagsQuery": "","type": "query","useTags": false}]},"time": {"from": "now-5m","to": "now"},"timepicker": {"refresh_intervals": ["5s","10s","30s","1m","5m","15m","30m","1h","2h","1d"],"time_options": ["5m","15m","1h","6h","12h","24h","2d","7d","30d"]},"timezone": "","title": "Nacos生产环境监控","uid": "Bz_QALEiz18","version": 8}
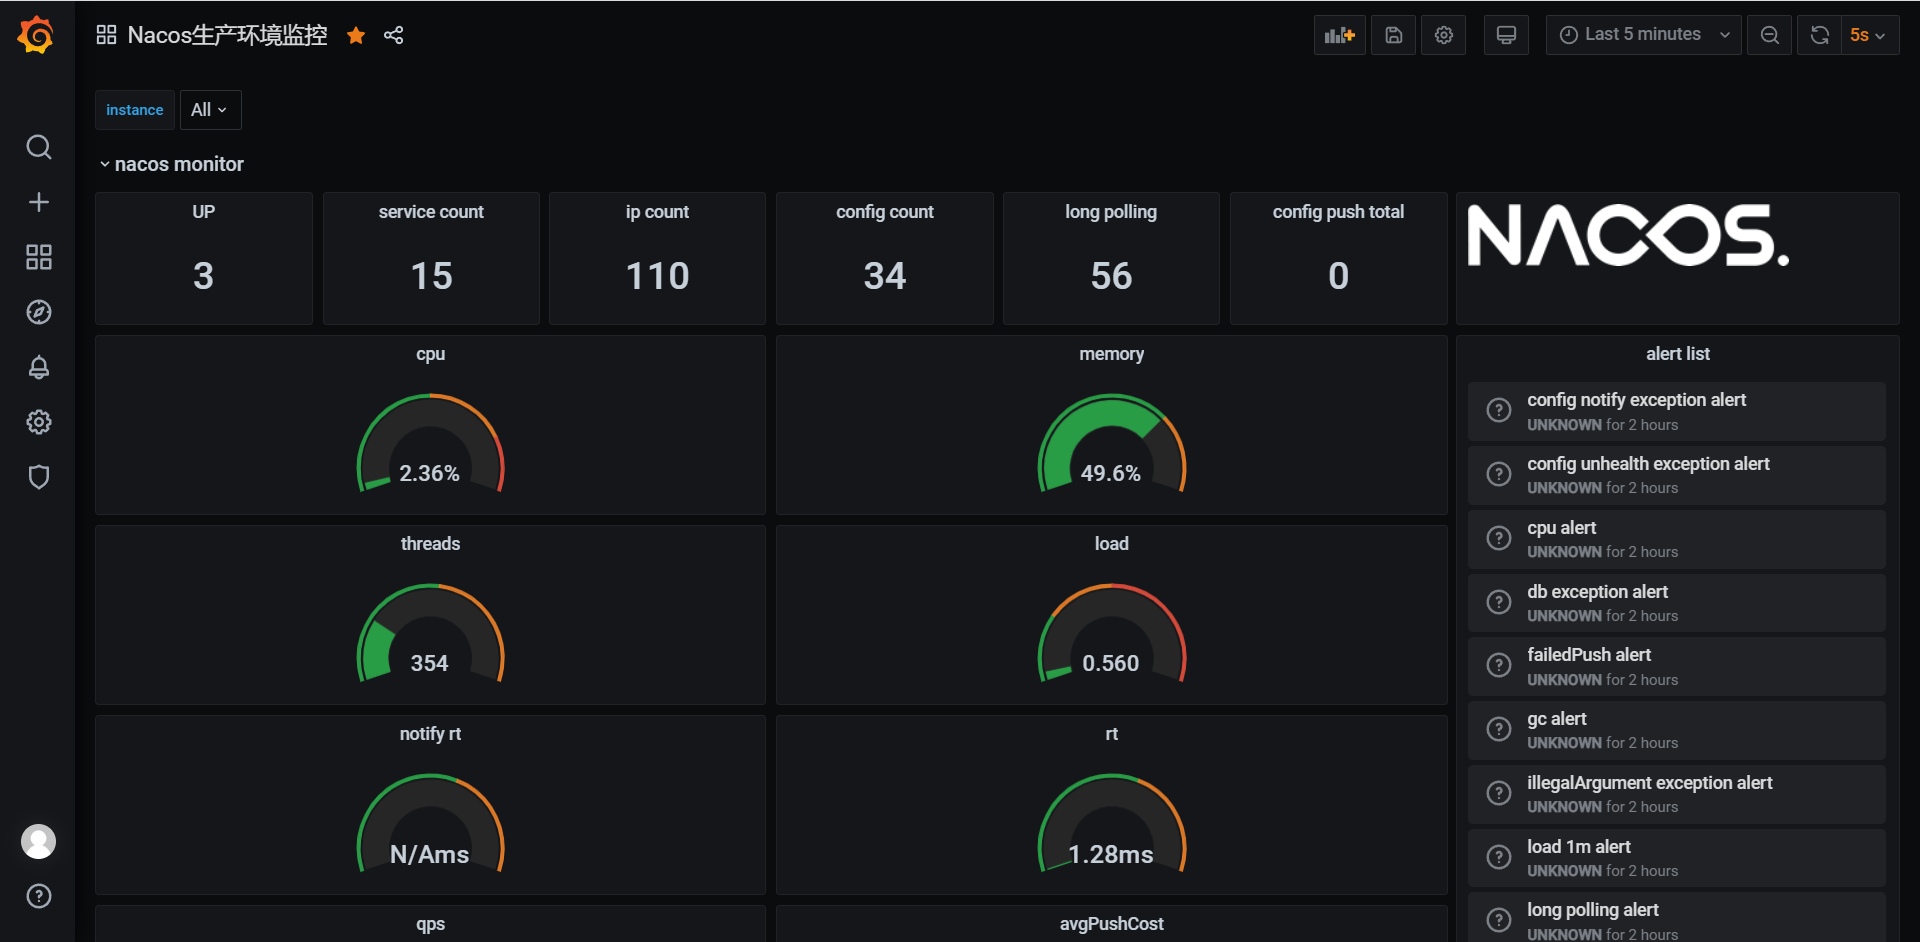

若有收获,就点个赞吧
0 人点赞
