1. pprof 的工作原理
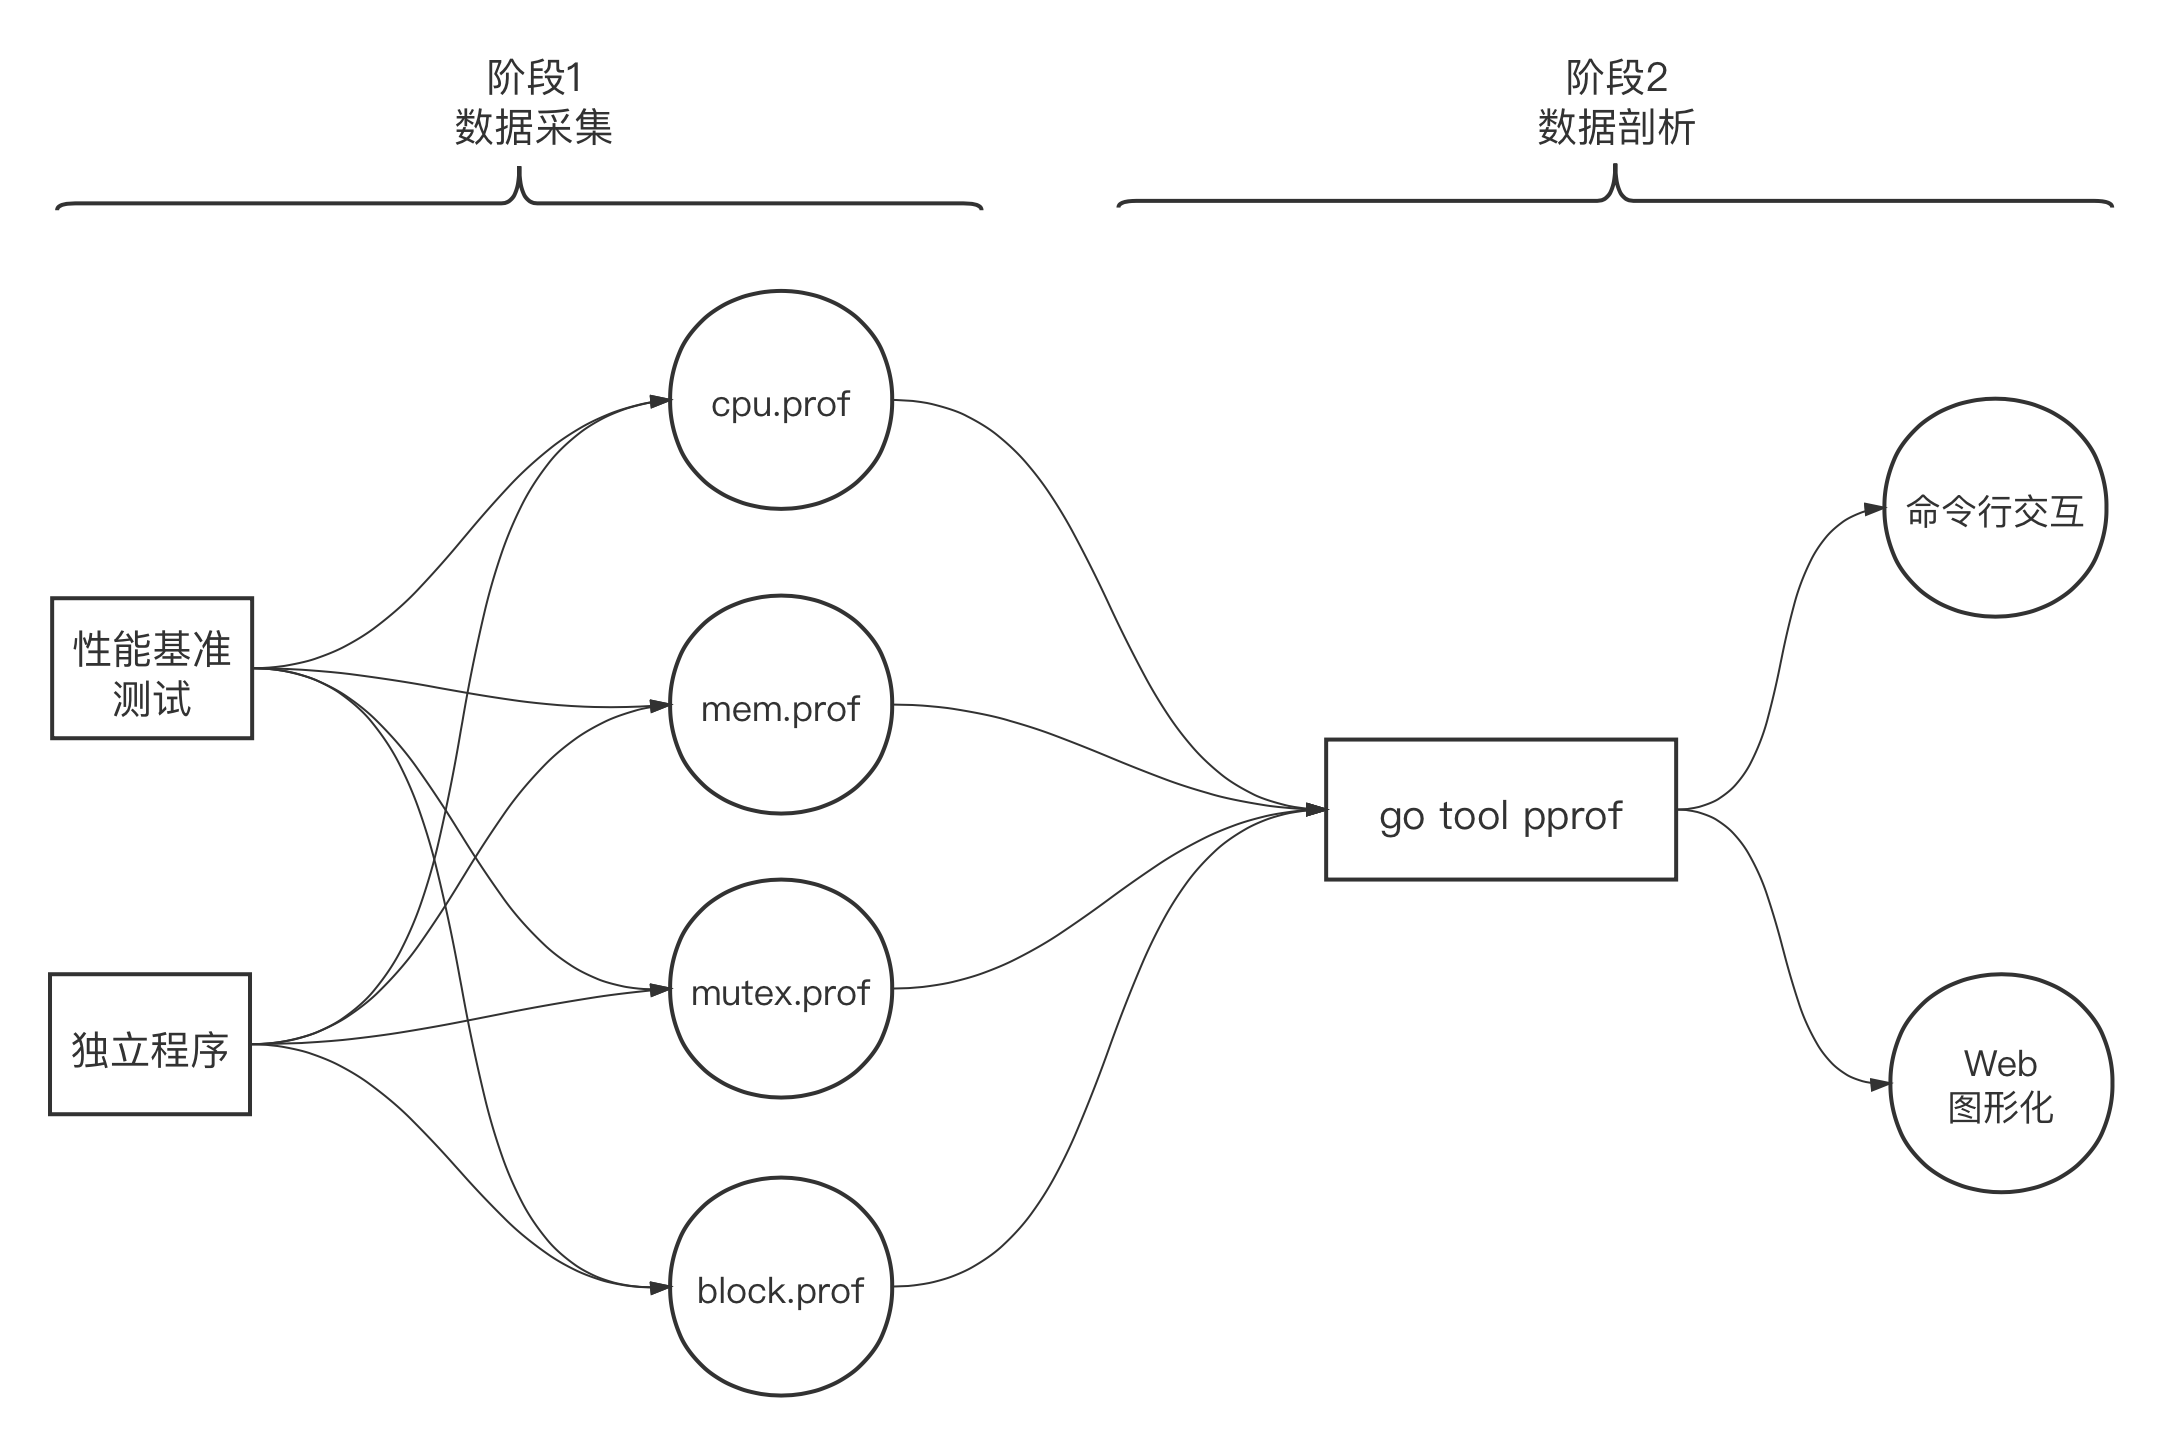
使用 pprof 对程序进行性能剖析的工作一般分为两个阶段:数据采集和数据剖析,如下图所示:
1) 采样数据类型
在数据采集阶段,Go运行时会定期对剖析阶段所需的不同类型数据进行采样记录,当前主要支持的采样数据类型有如下几种:
- CPU 数据(对应上图中的cpu.prof)
- 堆内存分配数据(对应上图中的mem.prof)
- 锁竞争数据(对应上图中的mutex.prof)
- 阻塞时间数据(对应上图中的block.prof)
注意:采样不是免费的,因此一次采样过程尽量仅采集一种类型的数据,不要同时采样多种类型的数据,避免相互干扰采样结果。
2) 性能数据采集的方式
a) 通过性能基准测试进行数据采集
我们仅需为go test增加一些命令行选项即可在执行性能基准测试的同时进行性能数据采集,以CPU采样数据类型为例:
$go test -bench . xxx_test.go -cpuprofile=cpu.prof$lscpu.prof xxx.test* xxx_test.go
我们看到,一旦开启性能数据采集(比如传入-cpuprofile),go test 的-c命令选项便会自动开启,go test命令执行后会自动编译出一个该测试对应的可执行文件(这里是xxx.test)。该二进制文件在性能数据剖析过程中可以提供剖析所需要的符号信息(比如:如果没有该二进制文件,go tool pprof的disasm命令将无法给出对应符号的汇编代码)。而cpu.prof就是存储CPU性能采样数据的结果文件,后续将作为数据剖析过程的输入。
对于其他类型的采样数据,我们也可以采用同样的方法开启采集并设置输出文件:
$go test -bench . xxx_test.go -memprofile=mem.prof$go test -bench . xxx_test.go -blockprofile=block.prof$go test -bench . xxx_test.go -mutexprofile=mutex.prof
b) 独立程序的性能数据采集
我们也可以通过标准库runtime/pprof和runtime包提供的低级API对独立运行的程序进行整体性能数据采集。下面是一个独立程序性能数据采集的例子:
// pprof_standalone1.gopackage mainimport ("flag""fmt""log""os""os/signal""runtime""runtime/pprof""sync""syscall""time")var cpuprofile = flag.String("cpuprofile", "", "write cpu profile to `file`")var memprofile = flag.String("memprofile", "", "write memory profile to `file`")var mutexprofile = flag.String("mutexprofile", "", "write mutex profile to `file`")var blockprofile = flag.String("blockprofile", "", "write block profile to `file`")func main() {flag.Parse()if *cpuprofile != "" {f, err := os.Create(*cpuprofile)if err != nil {log.Fatal("could not create CPU profile: ", err)}defer f.Close() // 该例子中暂忽略错误处理if err := pprof.StartCPUProfile(f); err != nil {log.Fatal("could not start CPU profile: ", err)}defer pprof.StopCPUProfile()}if *memprofile != "" {f, err := os.Create(*memprofile)if err != nil {log.Fatal("could not create memory profile: ", err)}defer f.Close()if err := pprof.WriteHeapProfile(f); err != nil {log.Fatal("could not write memory profile: ", err)}}if *mutexprofile != "" {runtime.SetMutexProfileFraction(1)defer runtime.SetMutexProfileFraction(0)f, err := os.Create(*mutexprofile)if err != nil {log.Fatal("could not create mutex profile: ", err)}defer f.Close()if mp := pprof.Lookup("mutex"); mp != nil {mp.WriteTo(f, 0)}}if *blockprofile != "" {runtime.SetBlockProfileRate(1)defer runtime.SetBlockProfileRate(0)f, err := os.Create(*blockprofile)if err != nil {log.Fatal("could not create block profile: ", err)}defer f.Close()if mp := pprof.Lookup("mutex"); mp != nil {mp.WriteTo(f, 0)}}var wg sync.WaitGroupc := make(chan os.Signal, 1)signal.Notify(c, syscall.SIGINT, syscall.SIGTERM)wg.Add(1)go func() {for {select {case <-c:wg.Done()returndefault:s1 := "hello,"s2 := "gopher"s3 := "!"_ = s1 + s2 + s3}time.Sleep(10 * time.Millisecond)}}()wg.Wait()fmt.Println("program exit")}
我们可以通过指定命令行参数的方式选择要采集的性能数据类型:
$go run pprof_standalone1.go -helpUsage of /var/folders/cz/sbj5kg2d3m3c6j650z0qfm800000gn/T/go-build221652171/b001/exe/pprof_standalone1:-blockprofile filewrite block profile to file-cpuprofile filewrite cpu profile to file-memprofile filewrite memory profile to file-mutexprofile filewrite mutex profile to file
以CPU类型性能数据为例,我们执行下面命令:
$go run pprof_standalone1.go -cpuprofile cpu.prof^Cprogram exit$ls -l cpu.prof-rw-r--r-- 1 tonybai staff 734 5 19 13:02 cpu.prof
Go 在net/http/pprof包中还提供了另外一种更为高级的针对独立程序性能数据采集的方式,这种方式尤其适合那些为内置了 http 服务的独立程序,net/http/pprof包可以直接利用已有的 http 服务对外提供用于性能数据采集的服务端点(endpoint)。例如,如果一个已有的提供 http 服务的独立程序代码如下:
// pprof_standalone2.gopackage mainimport ("context""fmt""log""net/http""os""os/signal""syscall")func main() {http.Handle("/hello", http.HandlerFunc(func(w http.ResponseWriter, r *http.Request) {fmt.Println(*r)w.Write([]byte("hello"))}))s := http.Server{Addr: "localhost:8080",}c := make(chan os.Signal, 1)signal.Notify(c, syscall.SIGINT, syscall.SIGTERM)go func() {<-cs.Shutdown(context.Background())}()log.Println(s.ListenAndServe())}
如果我们要采集该http服务的性能数据,我们仅需在该独立程序的代码中像下面这样导入net/http/pprof包即可:
// pprof_standalone2.goimport (... ..._ "net/http/pprof"... ...)
下面是net/http/pprof包的init函数,这就是空导入net/http/pprof的“副作用”:
//$GOROOT/src/net/http/pprof/pprof.gofunc init() {http.HandleFunc("/debug/pprof/", Index)http.HandleFunc("/debug/pprof/cmdline", Cmdline)http.HandleFunc("/debug/pprof/profile", Profile)http.HandleFunc("/debug/pprof/symbol", Symbol)http.HandleFunc("/debug/pprof/trace", Trace)}
我们看到该包的init函数向 http 包的默认请求“路由器(ServerMux)”:DefaultServeMux)注册了多个服务端点和对应的处理函数。而正是通过这些服务端点,我们就可以在该独立程序运行期间获取我们想要的各种类型的性能采集数据了。现在如果我们打开浏览器,访问http://localhost:8080/debug/pprof/,我们就可以看到下面的页面:
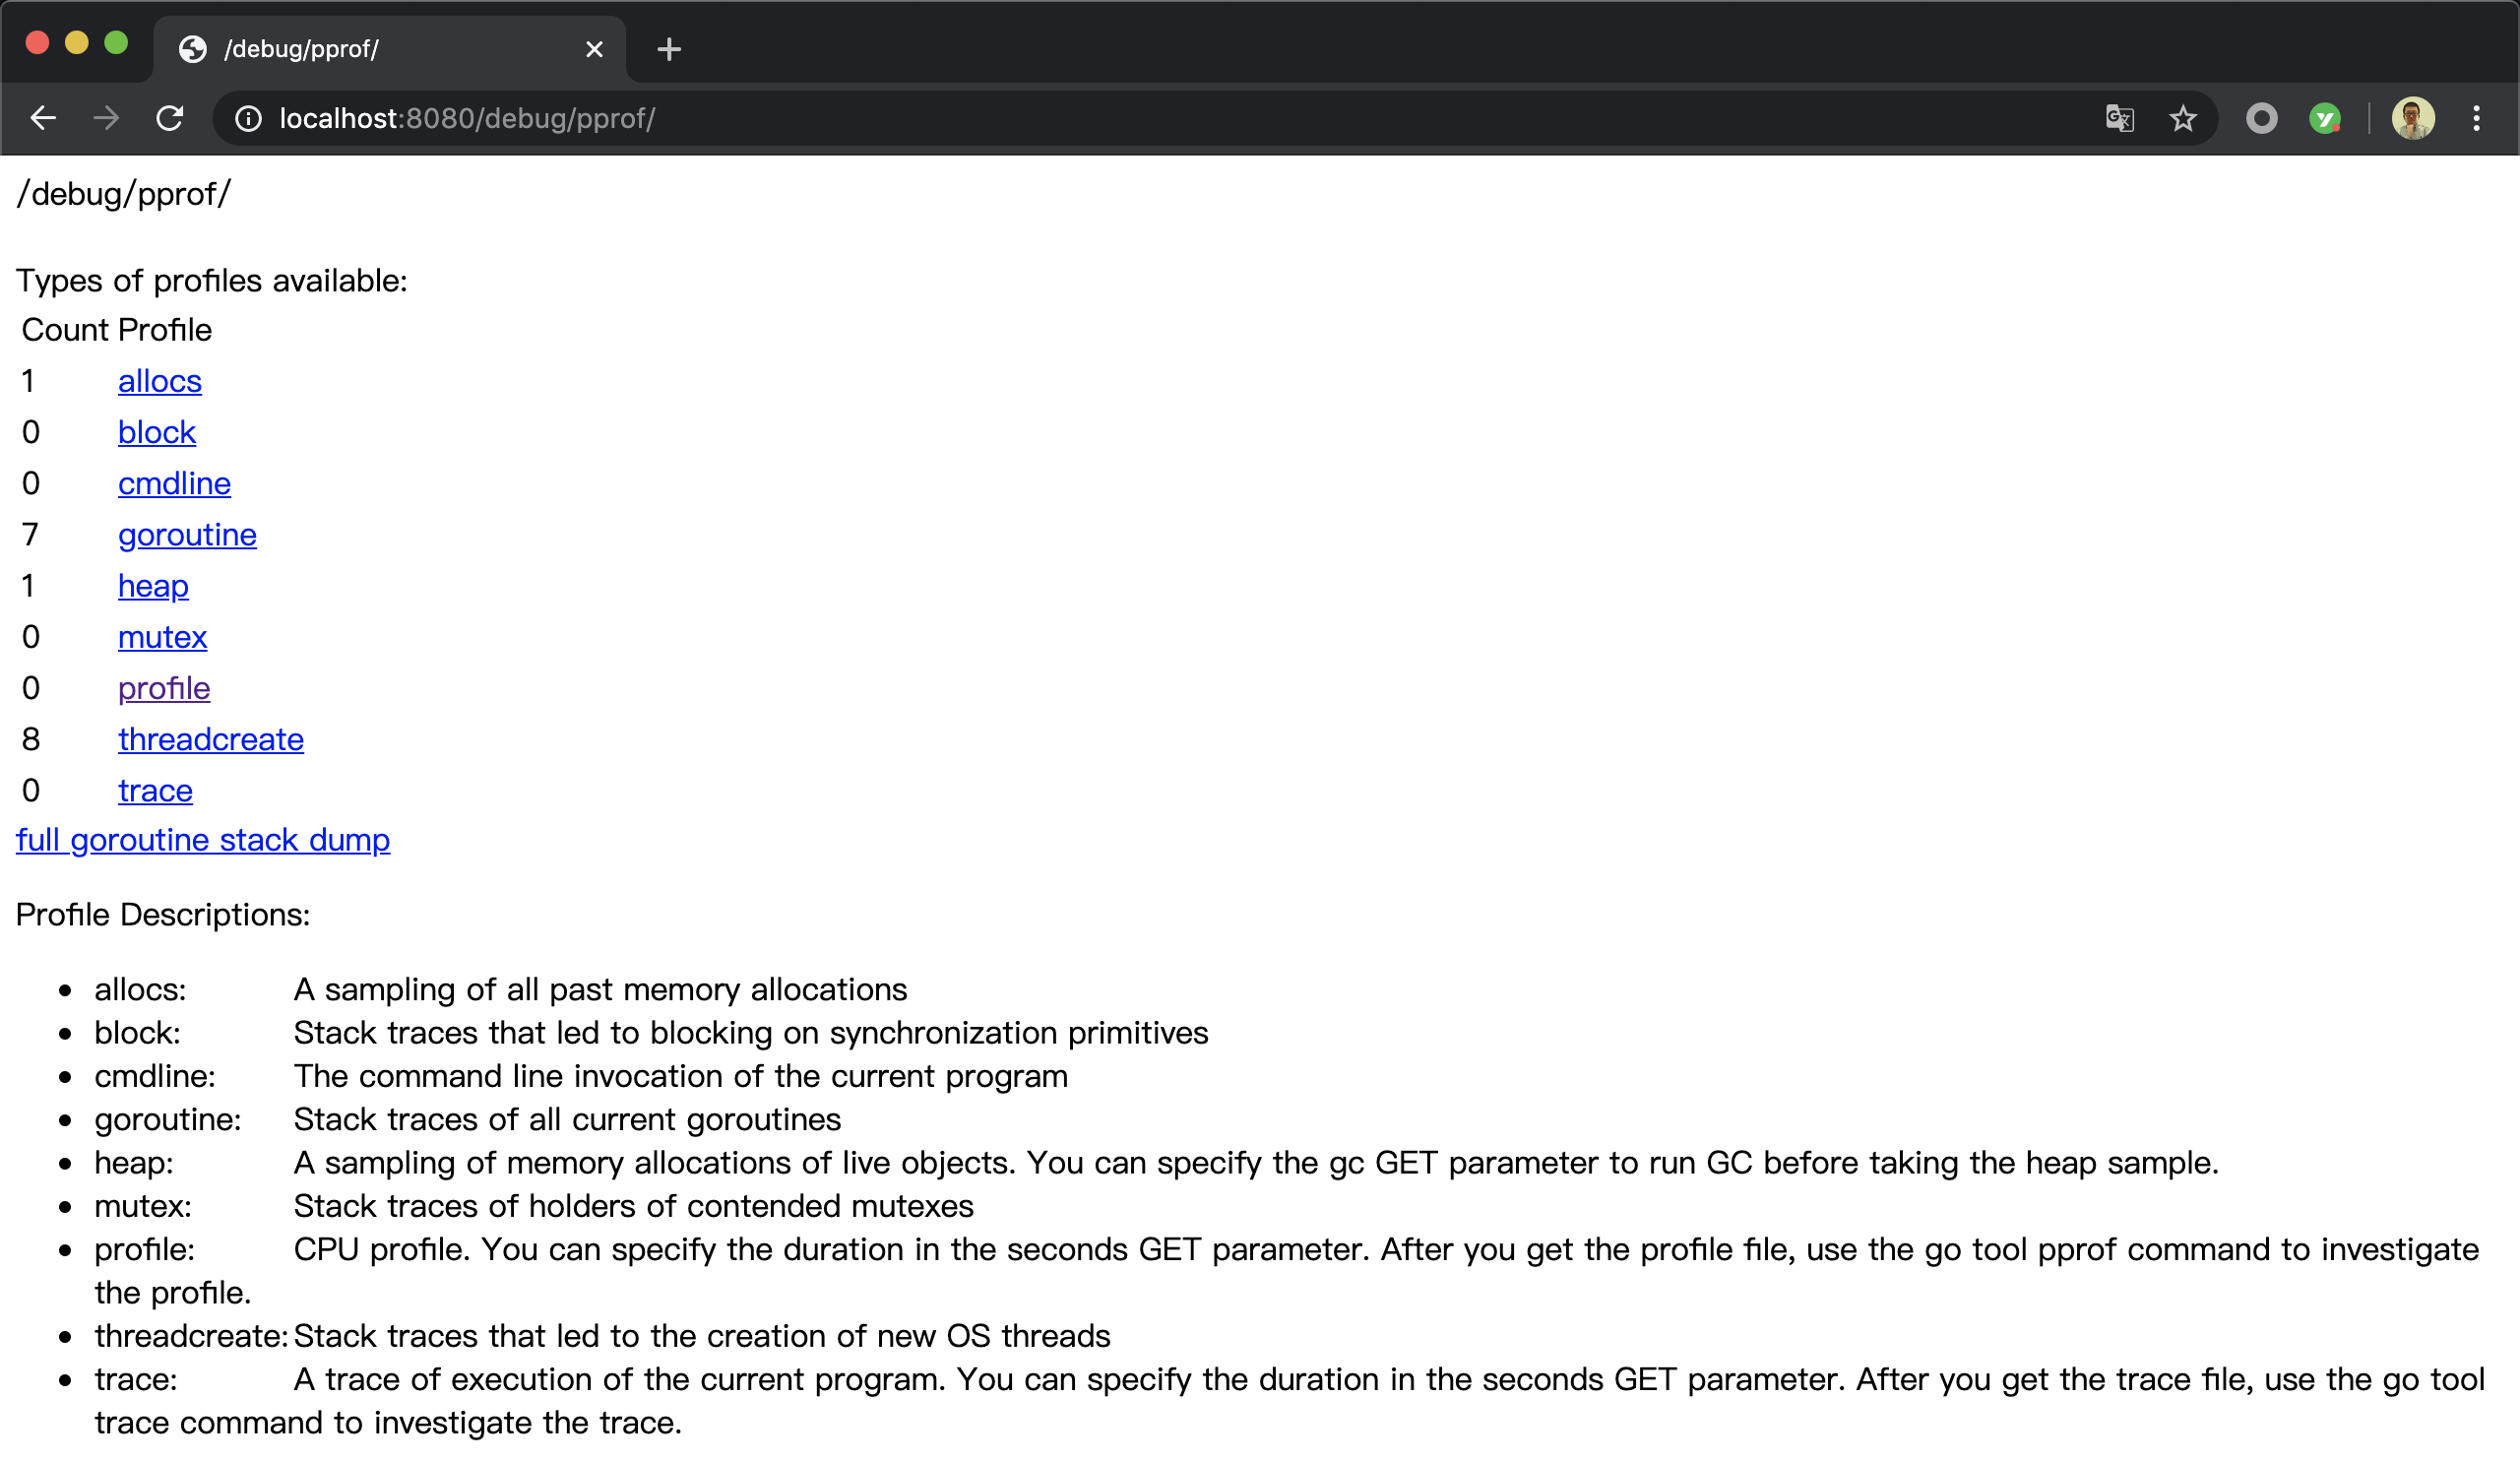
这个页面里列出了多种类型的性能采集数据,点击其中任何一个即可完成该种类型性能数据的一次采集。profile是 CPU 类型数据的服务端点,我们点击该端点后,该服务默认会发起一次持续 30 秒的性能采集,得到的数据文件会通过浏览器自动下载到本地。如果想自定义采集时长,可以通过为服务端点传递时长参数(seconds)来实现,比如下面这个就是一个采样 60 秒的请求:
http://localhost:8080/debug/pprof/profile?seconds=60
如果独立程序的代码中没有使用http包的默认请求“路由器(ServerMux)”:DefaultServeMux,那我们就需要重新在新的“路由器”上为 pprof 包提供的性能数据采集方法注册服务端点,就像下面示例:
// pprof_standalone3.go... ...func main() {mux := http.NewServeMux()mux.HandleFunc("/debug/pprof/", pprof.Index)mux.HandleFunc("/debug/pprof/profile", pprof.Profile)... ...mux.HandleFunc("/hello", http.HandlerFunc(func(w http.ResponseWriter, r *http.Request) {fmt.Println(*r)w.Write([]byte("hello"))}))s := http.Server{Addr: "localhost:8080",Handler: mux,}c := make(chan os.Signal, 1)signal.Notify(c, syscall.SIGINT, syscall.SIGTERM)go func() {<-cs.Shutdown(context.Background())}()log.Println(s.ListenAndServe())}
如果是非http服务程序,则在导入包的同时,还需单独启动一个用于性能数据采集的goroutine,像下面这样:
// pprof_standalone4.go... ...func main() {go func() {// 单独启动一个http server用于性能数据采集fmt.Println(http.ListenAndServe("localhost:8080", nil))}()var wg sync.WaitGroupc := make(chan os.Signal, 1)signal.Notify(c, syscall.SIGINT, syscall.SIGTERM)wg.Add(1)go func() {for {select {case <-c:wg.Done()returndefault:s1 := "hello,"s2 := "gopher"s3 := "!"_ = s1 + s2 + s3}time.Sleep(100 * time.Millisecond)}}()wg.Wait()fmt.Println("program exit")}
3) 性能数据的剖析
a) 命令行交互方式
我们可以通过下面三种方式执行go tool pprof以进入采用命令行交互式的性能数据剖析环节:
$go tool pprof xxx.test cpu.prof // 剖析通过性能基准测试采集的数据$go tool pprof standalone_app cpu.prof // 剖析独立程序输出的性能采集数据$go tool pprof http://localhost:8080/debug/pprof/profile // 通过net/http/pprof注册的性能采集数据服务端点获取数据并剖析
下面我们以pprof_standalone1.go这个示例的性能采集数据为例,看一下在命令行交互式的剖析环节,我们的一些常用命令。我们首先生成 CPU 类型性能采集数据:
$go build -o pprof_standalone1 pprof_standalone1.go$./pprof_standalone1 -cpuprofile pprof_standalone1_cpu.prof^Cprogram exit
通过go tool pprof命令进入到命令行交互模式中:
$ go tool pprof pprof_standalone1 pprof_standalone1_cpu.profFile: pprof_standalone1Type: cpuTime: May 19, 2020 at 7:55pm (CST)Duration: 16.14s, Total samples = 240ms ( 1.49%)Entering interactive mode (type "help" for commands, "o" for options)(pprof)
命令行交互方式下最常用的命令就是topN(N 为数字,如果不指定 N,默认 N 等于 10):
(pprof) topShowing nodes accounting for 240ms, 100% of 240ms totalShowing top 10 nodes out of 29flat flat% sum% cum cum%90ms 37.50% 37.50% 90ms 37.50% runtime.nanotime150ms 20.83% 58.33% 50ms 20.83% runtime.pthread_cond_wait40ms 16.67% 75.00% 40ms 16.67% runtime.usleep20ms 8.33% 83.33% 20ms 8.33% runtime.asmcgocall20ms 8.33% 91.67% 20ms 8.33% runtime.kevent10ms 4.17% 95.83% 10ms 4.17% runtime.pthread_cond_signal10ms 4.17% 100% 10ms 4.17% runtime.pthread_cond_timedwait_relative_np0 0% 100% 10ms 4.17% main.main.func10 0% 100% 30ms 12.50% runtime.checkTimers0 0% 100% 130ms 54.17% runtime.findrunnable(pprof)
topN命令的输出结果默认按flat(flat%)从大到小的顺序输出:
- flat列的值表示函数自身代码在数据采样过程的执行时长;
- flat%列的值表示函数自身代码在数据采样过程的执行时长占总采样执行时长的比例;
- sum%列的值是当前行flat%值与排在该值前面所有行的flat%值的累加和。以第三行的sum%值75.00%为例,该值由前三行flat%累加而得,即75.00% = 16.67% + 20.83% + 37.50%;
- cum列的值表示函数自身在数据采样过程中出现的时长,这个时长是其自身代码执行时长以及其等待其调用的函数返回所用时长的总和。越是接近函数调用栈底层的代码,其cum列的值越大;
- cum%列的值表示该函数cum值占总采样时长的百分比。比如:runtime.findrunnable函数的cum值为 130ms,总采样时长为 240ms,则其```cum%值为两者的比值百分化后的值(130.0/240,再百分化)。
命令行交互模式也支持按cum值从大到小排序输出采样结果:
(pprof) top -cumShowing nodes accounting for 90ms, 37.50% of 240ms totalShowing top 10 nodes out of 29flat flat% sum% cum cum%0 0% 0% 140ms 58.33% runtime.mcall0 0% 0% 140ms 58.33% runtime.park_m0 0% 0% 140ms 58.33% runtime.schedule0 0% 0% 130ms 54.17% runtime.findrunnable0 0% 0% 90ms 37.50% runtime.nanotime (inline)90ms 37.50% 37.50% 90ms 37.50% runtime.nanotime10 0% 37.50% 70ms 29.17% runtime.mstart0 0% 37.50% 70ms 29.17% runtime.mstart10 0% 37.50% 70ms 29.17% runtime.sysmon0 0% 37.50% 60ms 25.00% runtime.semasleep(pprof)
在命令行交互模式下,我们可以通过list命令列出函数对应的源码,比如我们列出main.main函数的源码:
(pprof) list main.mainTotal: 240msROUTINE ======================== main.main.func1 in chapter8/sources/pprof_standalone1.go0 10ms (flat, cum) 4.17% of Total. . 86: s2 := "gopher". . 87: s3 := "!". . 88: _ = s1 + s2 + s3. . 89: }. . 90:. 10ms 91: time.Sleep(10 * time.Millisecond). . 92: }. . 93: }(). . 94: wg.Wait(). . 95: fmt.Println("program exit"). . 96:}(pprof)
我们看到:在展开源码的同时,pprof还列出了代码中对应行的消耗时长(基于采样数据)。我们可以选择耗时较长的函数,做进一步的向下展开,这个过程类似一个对代码进行向下钻取的过程,直到找到令我们满意的结果(某个导致性能瓶颈的函数中的某段代码)
(pprof) list time.SleepTotal: 240msROUTINE ======================== time.Sleep in go1.14/src/runtime/time.go0 10ms (flat, cum) 4.17% of Total. . 192: t = new(timer). . 193: gp.timer = t. . 194: }. . 195: t.f = goroutineReady. . 196: t.arg = gp. 10ms 197: t.nextwhen = nanotime() + ns. . 198: gopark(resetForSleep, unsafe.Pointer(t), waitReasonSleep, traceEvGoSleep, 1). . 199:}. . 200:(pprof)
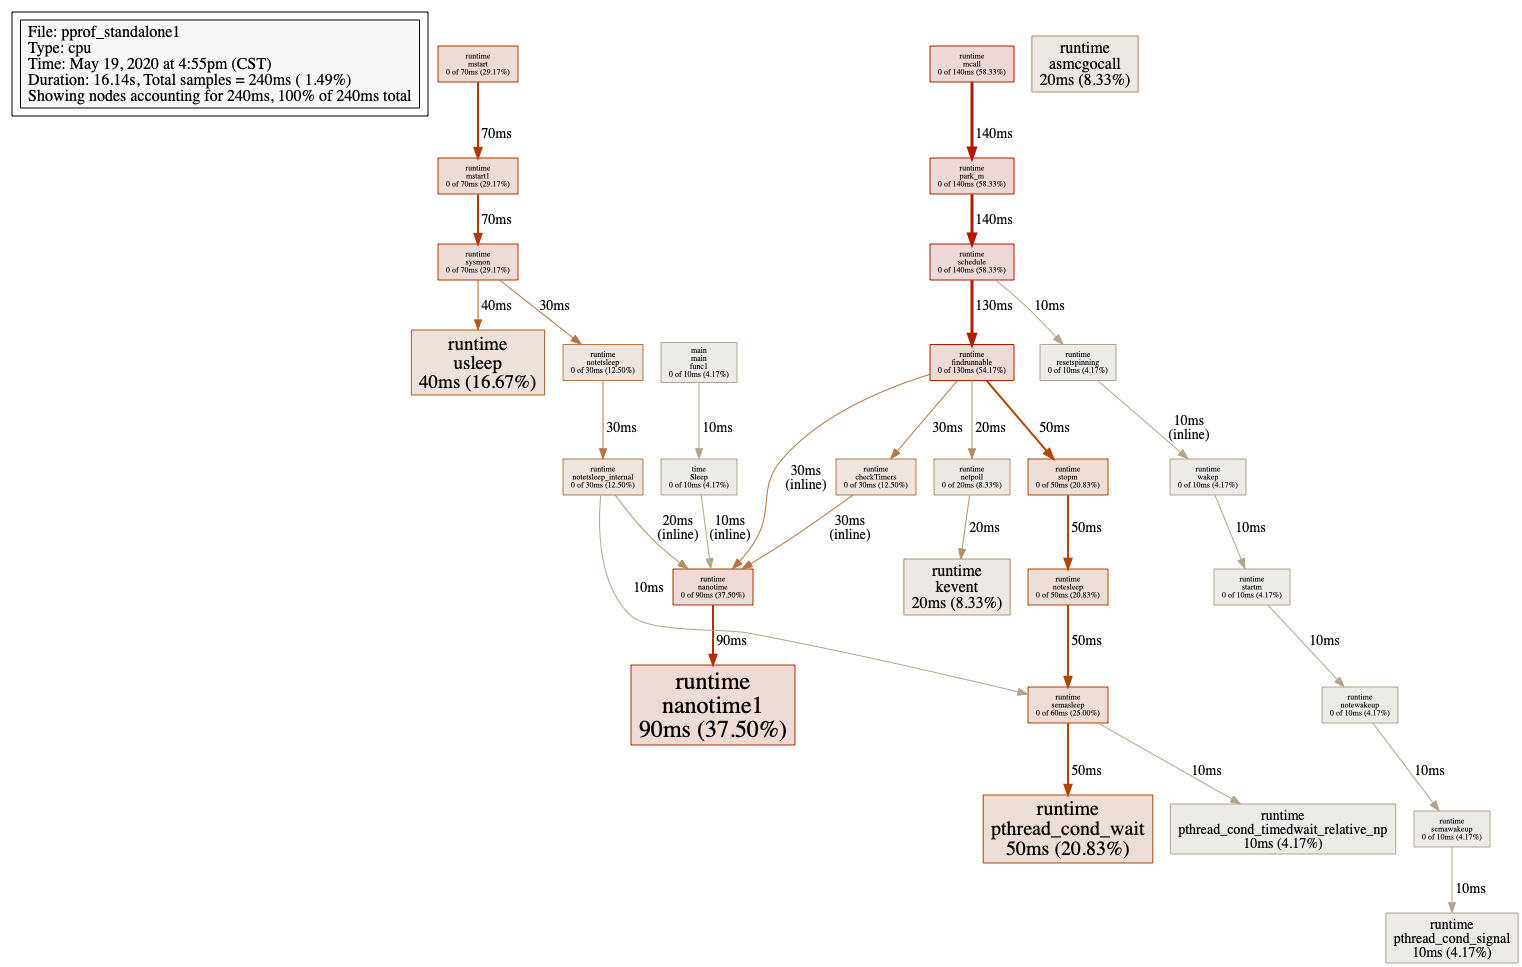
在命令行交互模式下,我们还可以生成 CPU 采样数据的函数调用图,图可以导出为多种格式:pdf、png、jpg、gif、svg 等。不过要做到这一点,前提是本地要安装图片生成依赖的插件:graphviz。
我们导出一幅 png 格式的图片:
(pprof) pngGenerating report in profile001.png
png命令在当前目录下生成了一幅名为profile001.png的图片文件:

若有收获,就点个赞吧
0 人点赞
