前言
首先我们先搞清楚一个问题,什么是Bitmap重复,顾名思义,就是两个相同的bitmap在内存中同时存在,但这样讲并不严谨,为什么?因为bitmap的内存主要是分两部分,bitmap对象+像素数据,严格意义上说的是像素数据重复,而在虚拟机中有两个不同的bitmap对象。当遇到像素数据不断重复,导致内存被重复占用,如果不去管理,越来越多的话,随之而来的问题就是,可能会导致OOM,也可能容易导致频繁GC等,所以我们想办法去主动检测出重复的像素数据,主动将其解决掉。才是我们优化的目的
Bitmap存哪里?
搞清它存在哪里,也是我们找对检测方法的关键,那么bitmap到底存在哪里了呢?其实随着Android系统的迭代,且考虑到Bitmap是重量级的内存大户,也是不断的优化存储的位置,下面列表给你们总结一下
| Android版本 | 存储位置 | 备注 |
|---|---|---|
| 3.0以前 | Bitmap对象在堆中,像素数据存在Native内存中 | 必须手动recycle |
| 3.0~7.0 | Bitmap对象及像素数据均放堆中,让虚拟机自动管理 | 缺点也很明显,很容易造成内存占用过多 |
| 8.0及以后 | 像素数据回归Native中,但这次加了辅助回收Native NativeAllocationRegistry.java源码请看 |
如何检测出重复呢?
其实也没什么好的办法,我们需使用内存 Hprof 分析工具,然后将重复图片和引用堆栈输出。可是这种方法只能分析Android 8.0以前的系统哦,因为8.0已经不在堆中缓存,那你肯定是检测不到了。那么Matrix是如何检测的呢?它有限制吗?我现在也不知道,往下看,我们一起分析。
我们先看一个简单的例子:
第一步
创建一个demo,加载两个相同的bitmap图片。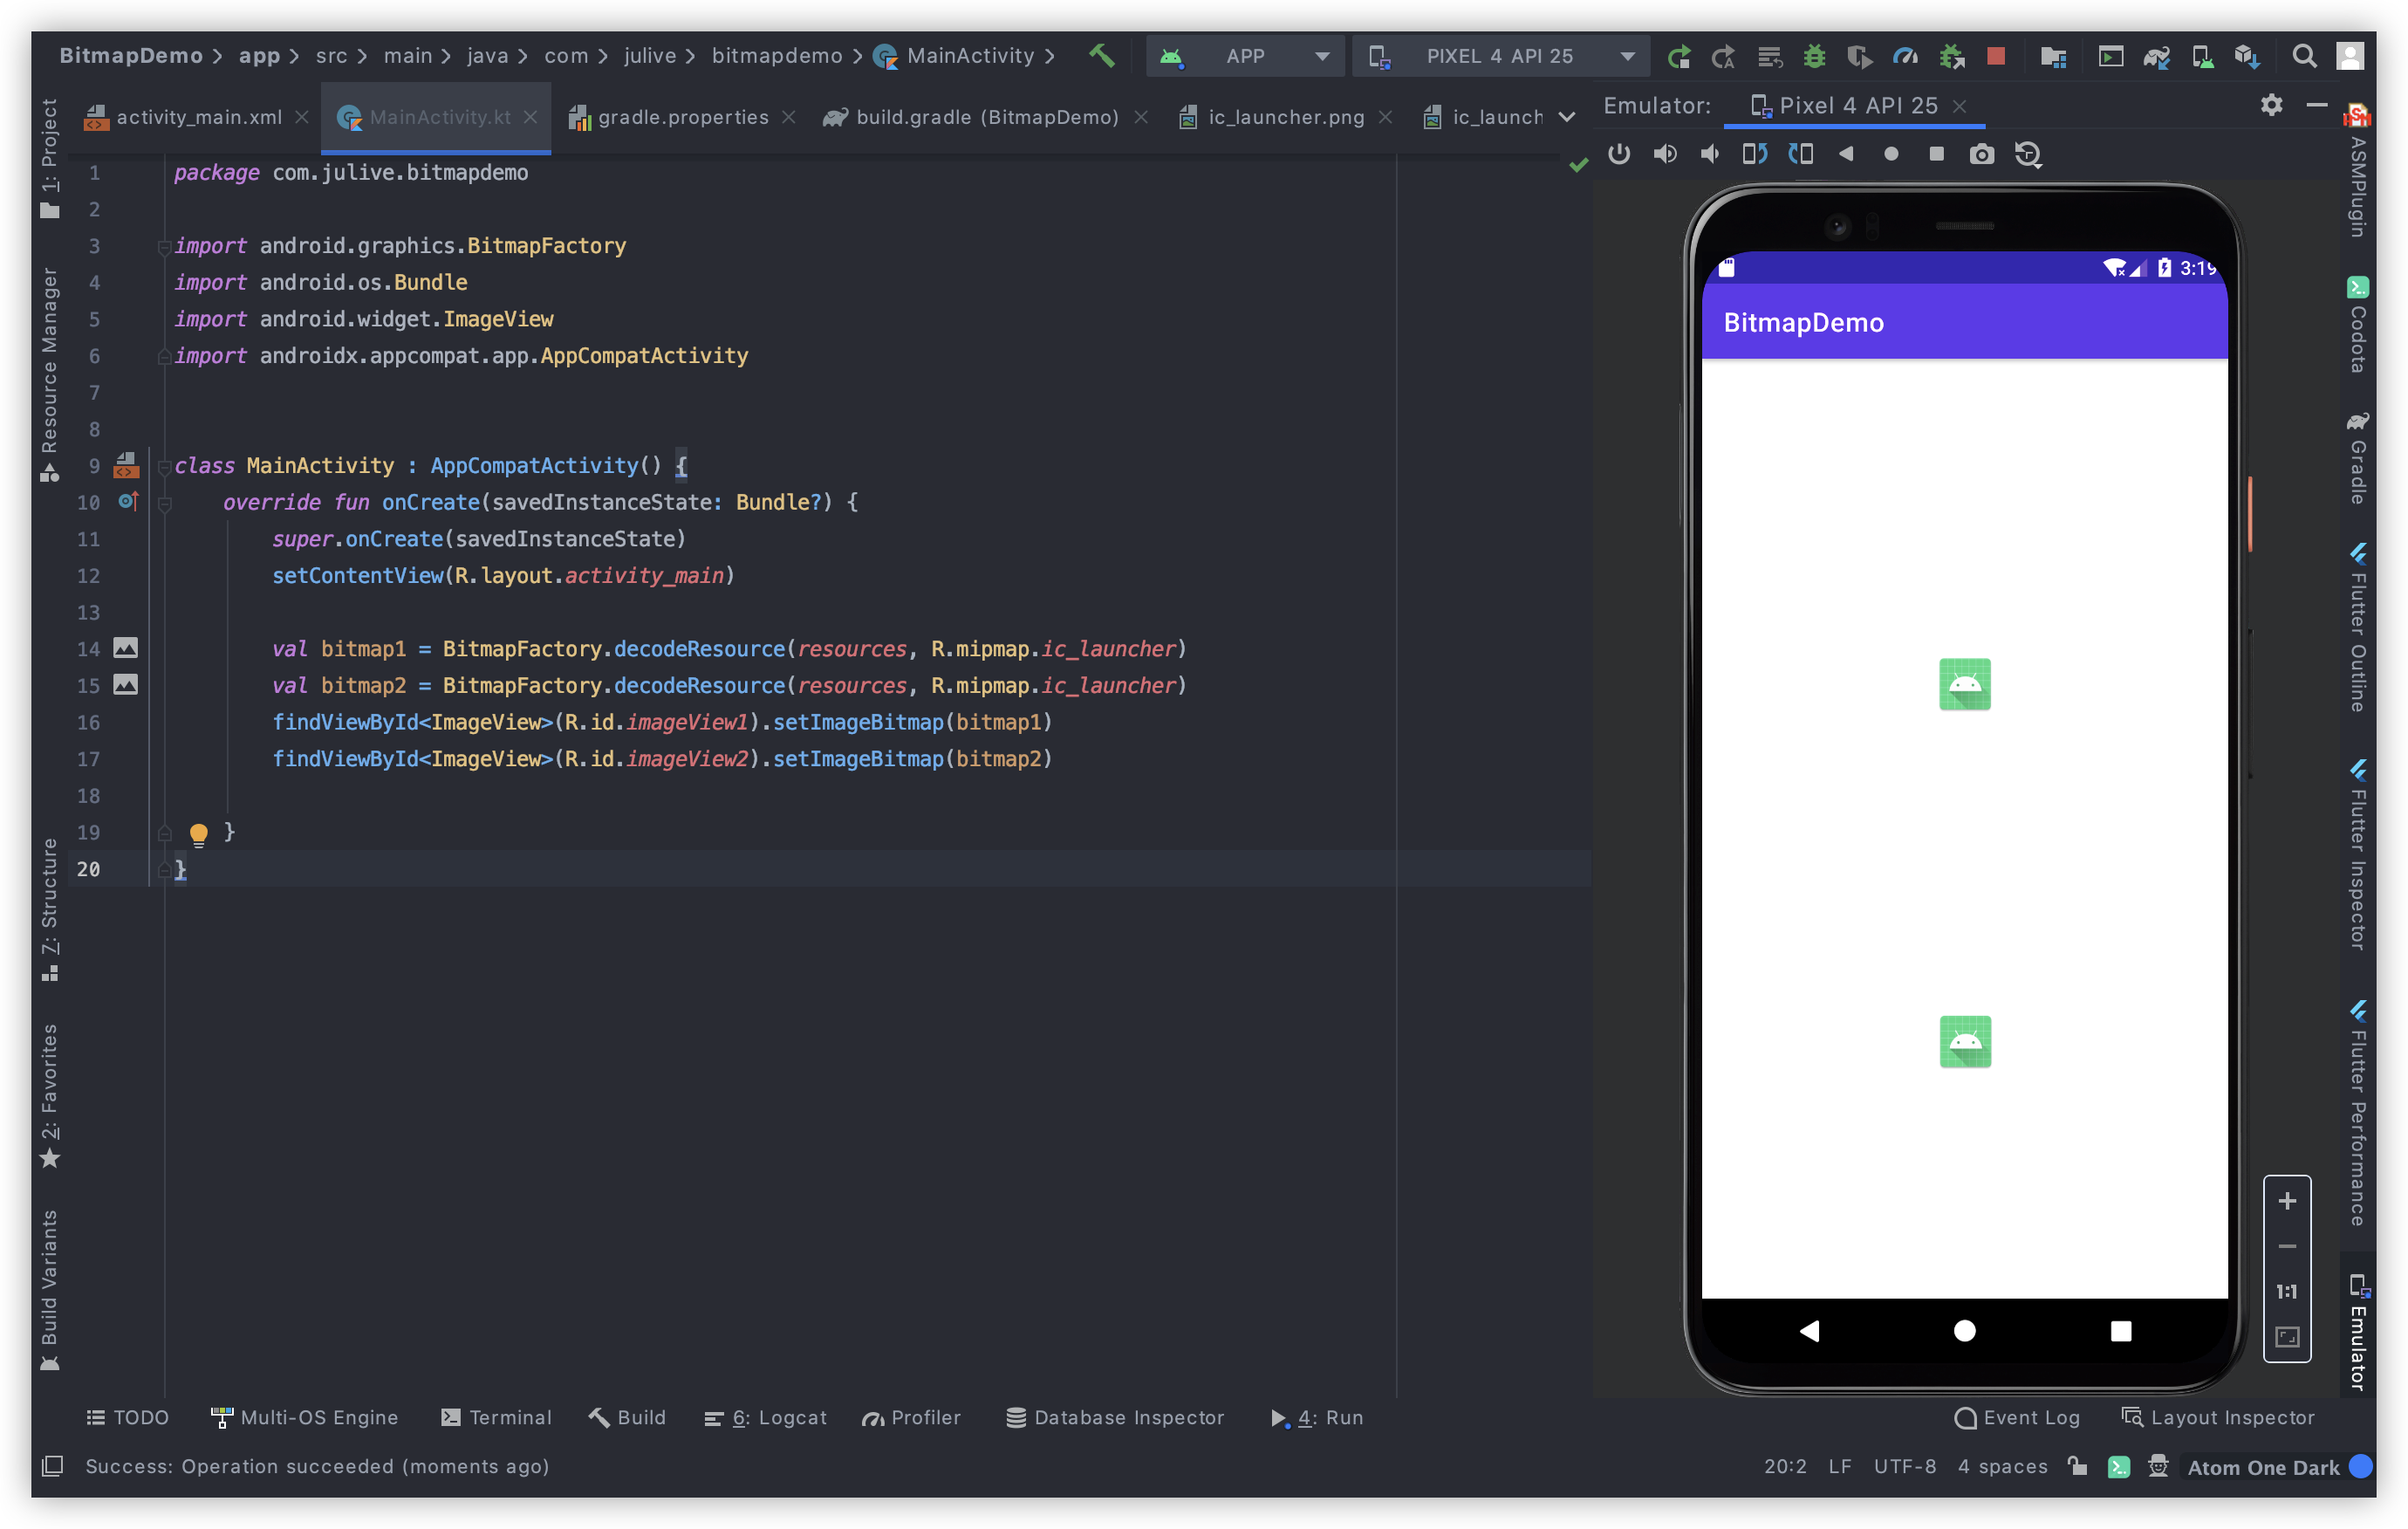
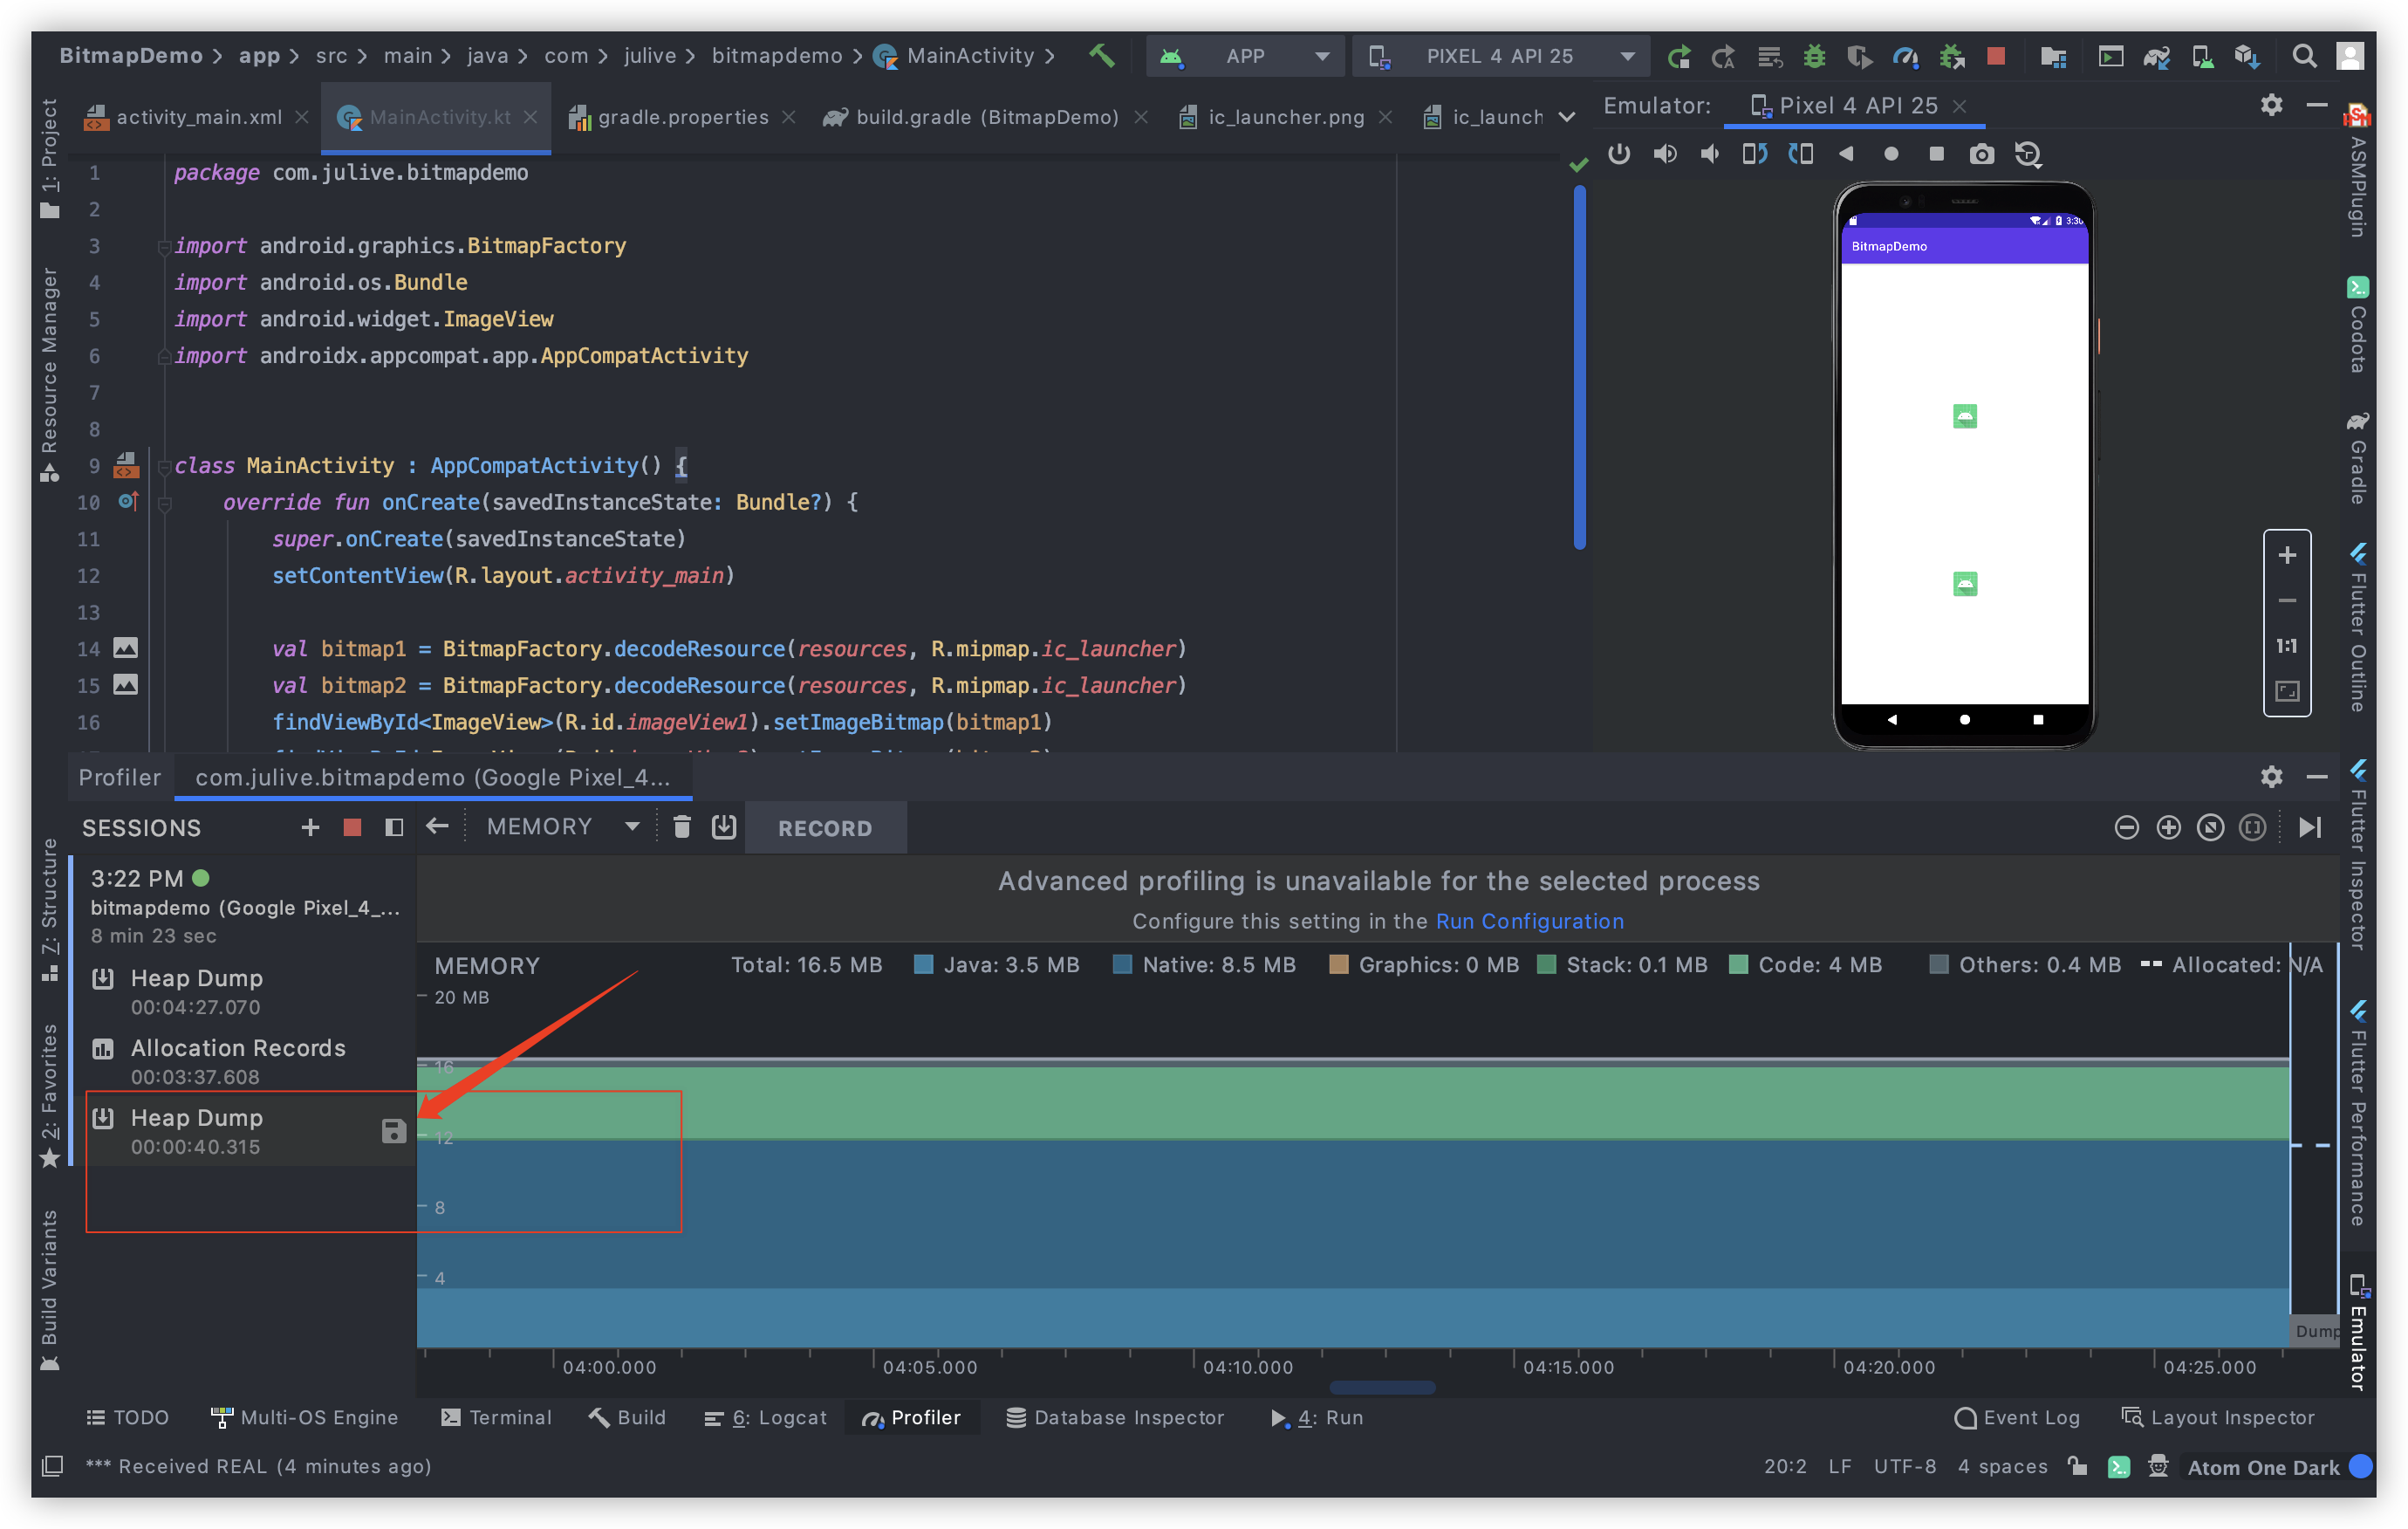
第二步
1 打开Profiler-> 2 选择bitmapdemo进程-> 3 选择MEMORY -> 4 Dump Heap -> 5 将鼠标指针停留该处,执行第二张图中操作磁盘保存按钮 Export Heap Dump
选择保存位置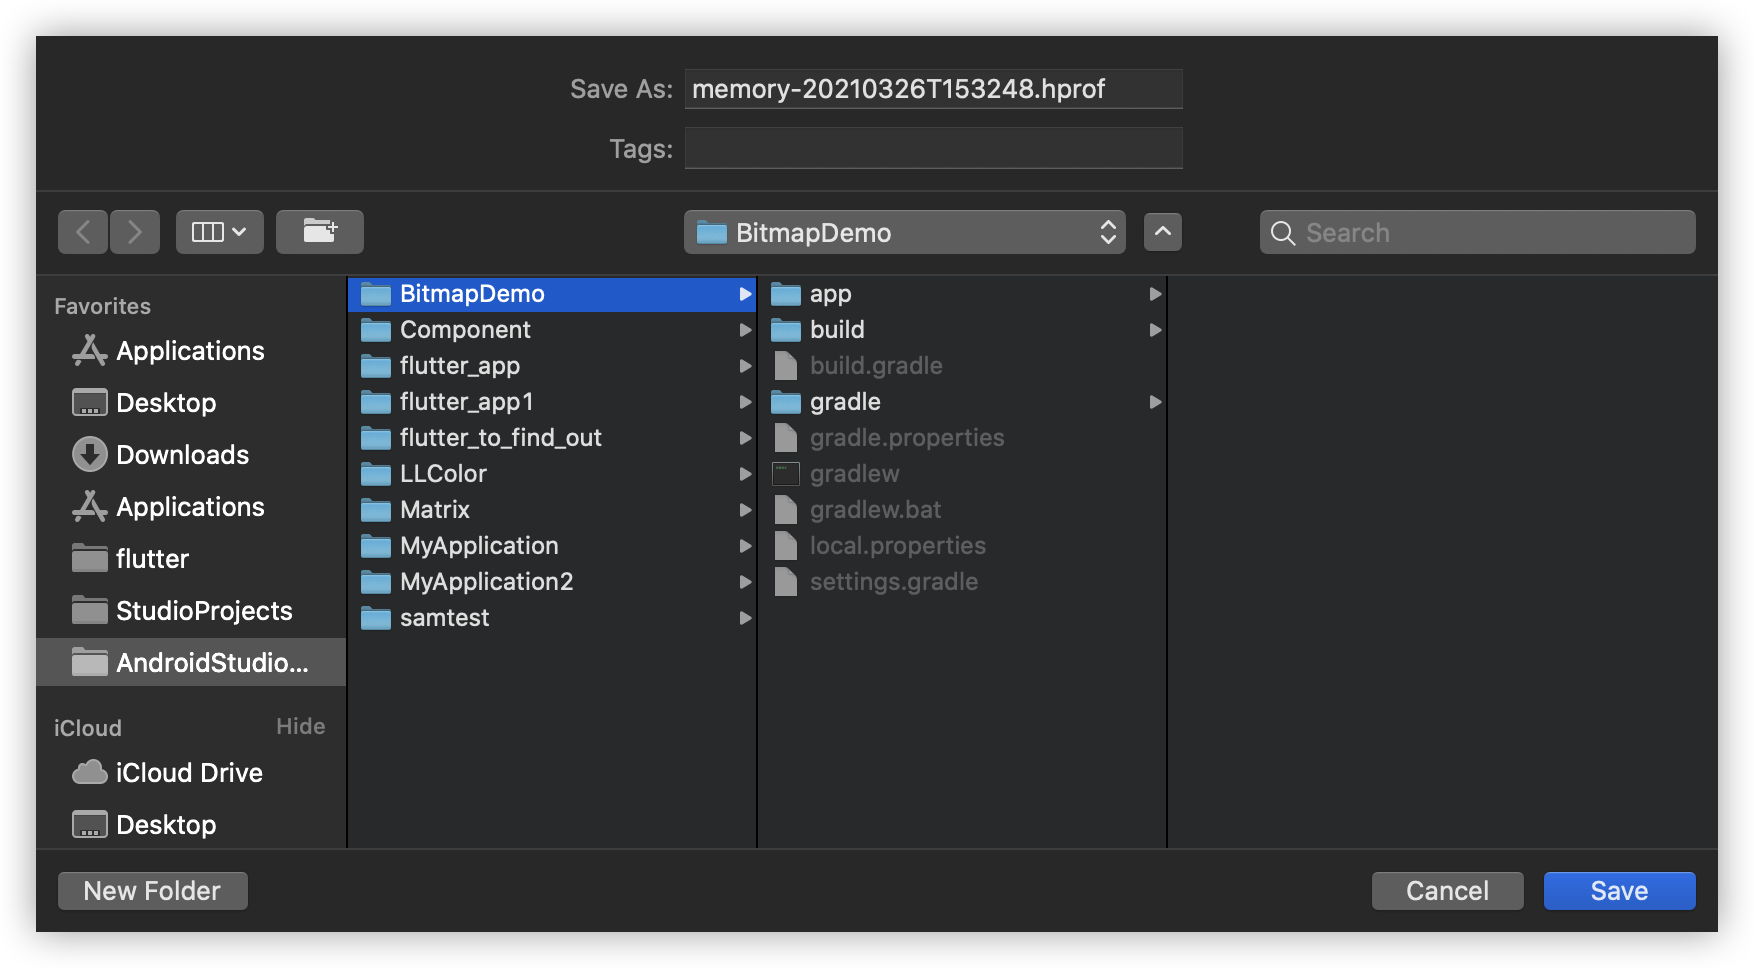
第三步
下载分析jar包DuplicatedBitmapAnalyzer-1.0.jar,地址,将项目中tools目录中的jar拷贝到项目的根目录中,然后在项目的根目录执行如下命令
java -jar DuplicatedBitmapAnalyzer-1.0.jar 刚才保存的文件名字.hprof
执行结果如下图: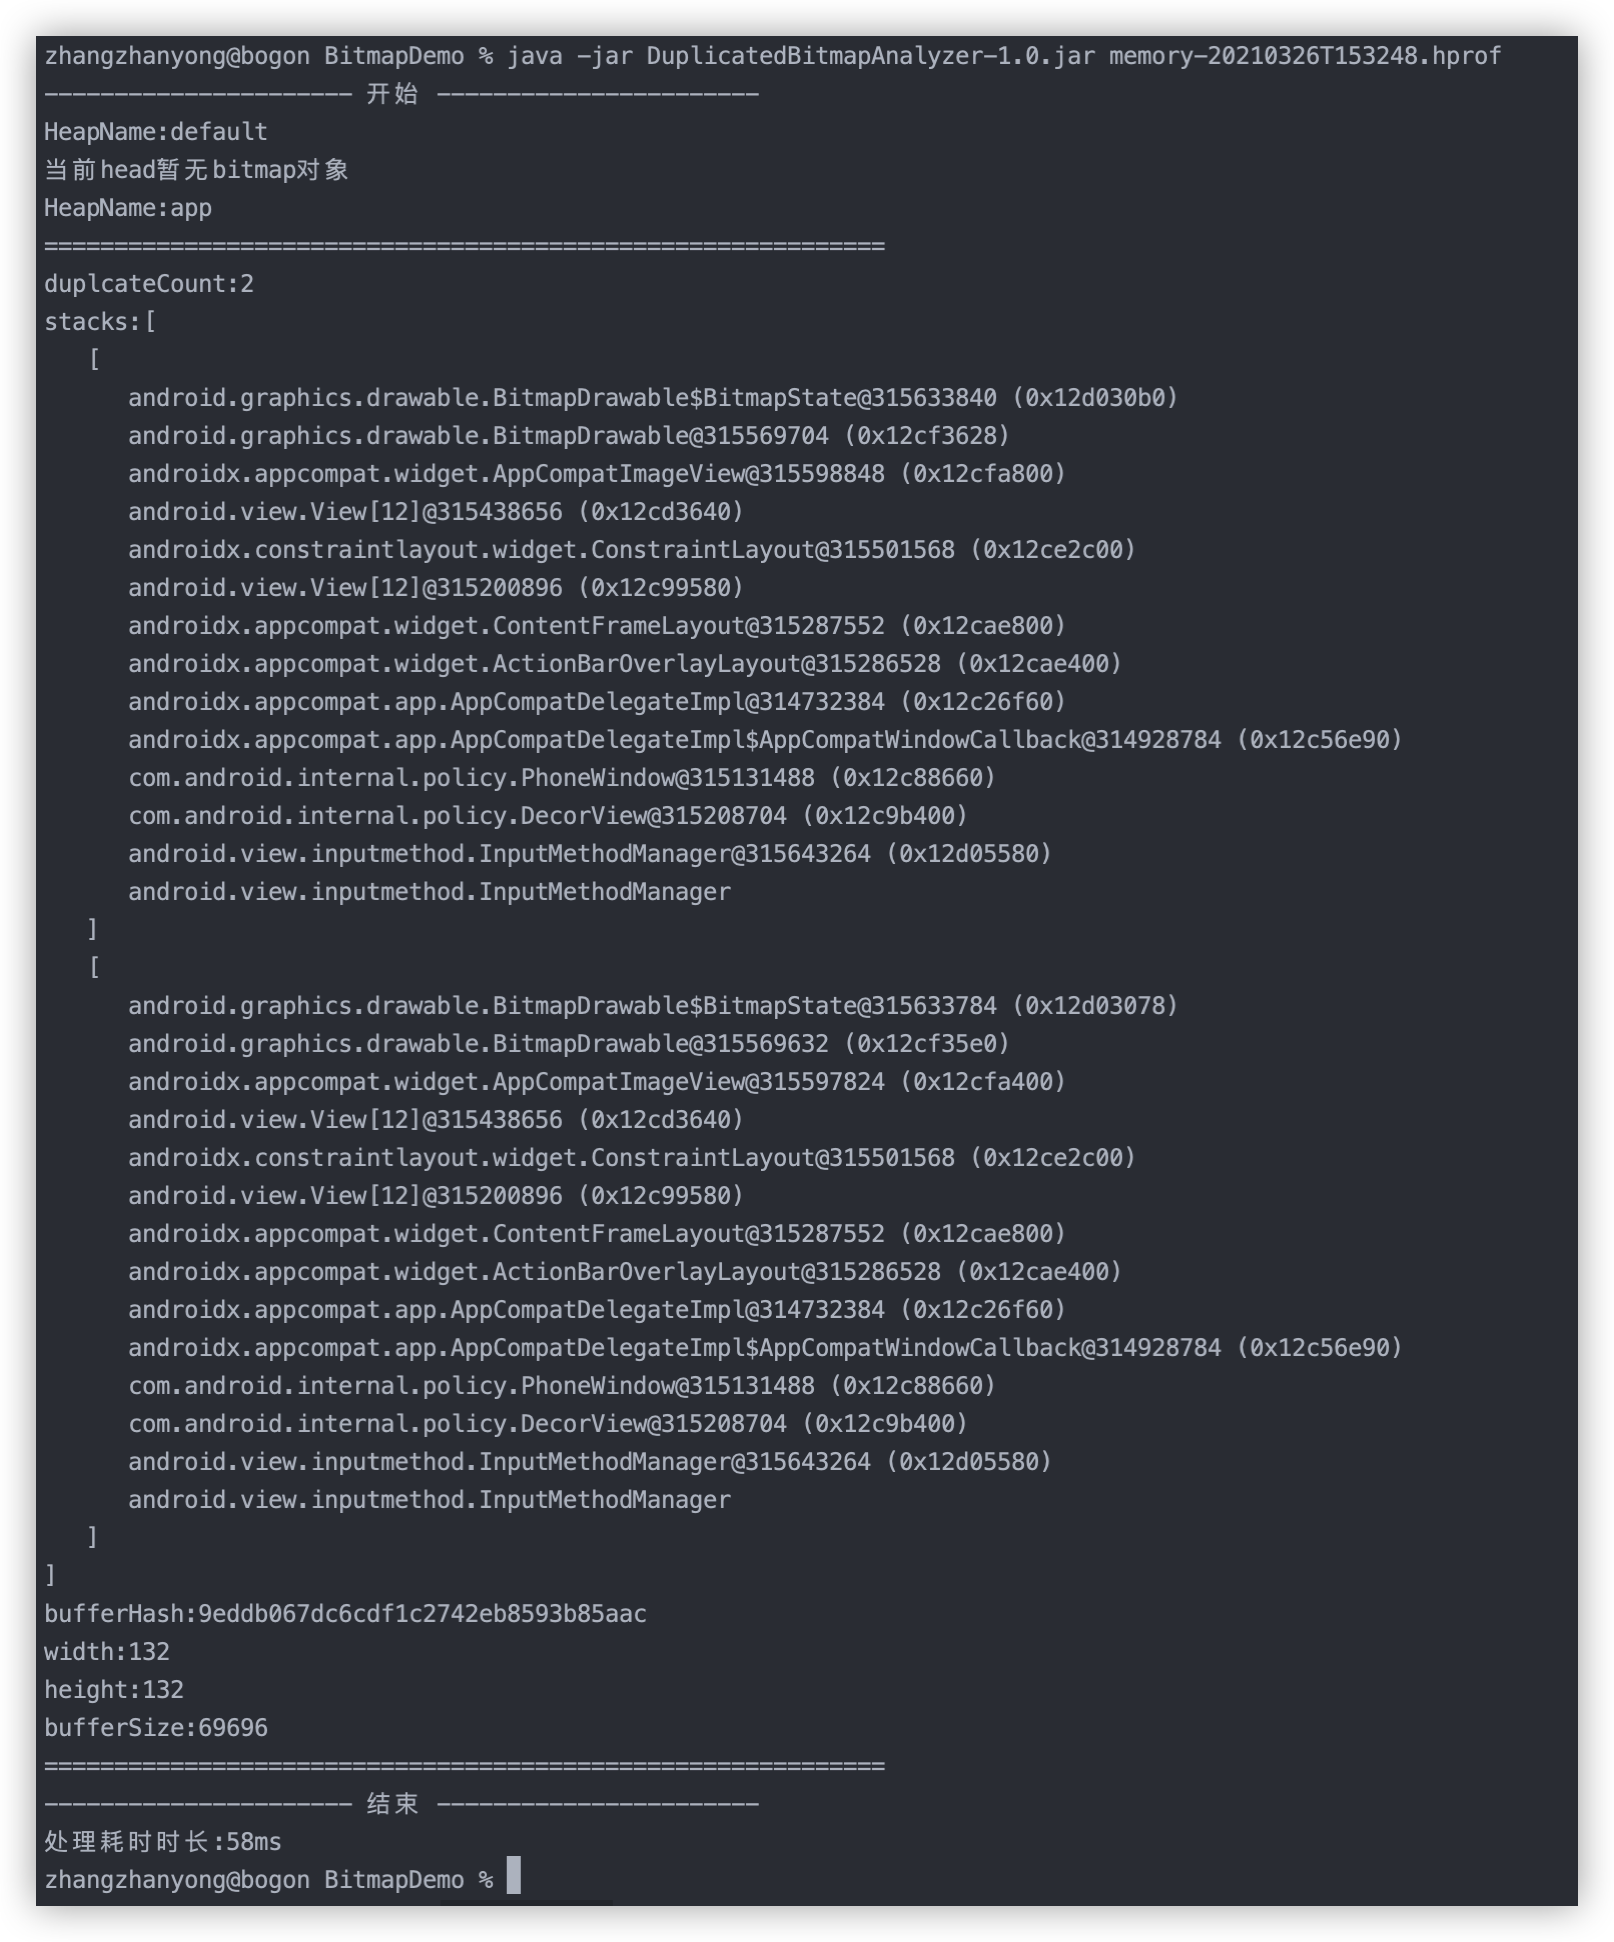
可以看到我们找到了两个重复的图片。代码是如何实现的呢?
下面引用DuplicatedBitmapAnalyzer项目介绍:
使用 sqaure 的HAHA库
// 打开hprof文件final HeapSnapshot heapSnapshot = new HeapSnapshot(hprofFile);// 获得snapshotfinal Snapshot snapshot = heapSnapshot.getSnapshot();// 获得Bitmap Classfinal ClassObj bitmapClass = snapshot.findClass("android.graphics.Bitmap");// 获得heap, 只需要分析app和default heap即可Heap heap = snapshot.getHeaps();// 从heap中获得所有的Bitmap实例final List<Instance> bitmapInstances = bitmapClass.getHeapInstances(heap.getId());// 从Bitmap实例中获得buffer数组ArrayInstance buffer = HahaHelper.fieldValue(((ClassInstance) bitmapInstance).getValues(), "mBuffer");
整个思路就是通过”mBuffer”的hash值判断哪些Bitmap是重复的。这种方式适用于开发阶段,想要检测的时候还是可以很容易的发现项目中的一些重复图片,可如果想在线上检查呢?是不是就需要纯代码实现呢?对的,下面就来看下Matrix是如何实现的把
Matrix Bitmap 重复检测源码分析
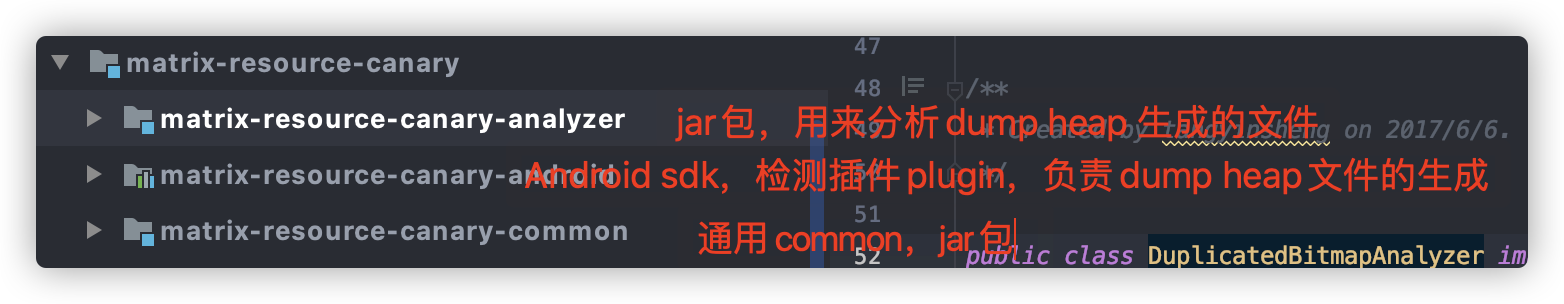
通过对源码的大致浏览,其实可以将其分成以上三个部分,其实最主要的就是前两个,一个主要用于分析matrix-resource-canary-analyzer 一个用户生成分析文件matrix-resource-canary-android 看下android项目的依赖,并没有发现matrix-resource-canary-analyzer,那它是如何分析出报告返回到App应用呢?随我来看下matrix-resource-canary-android的实现。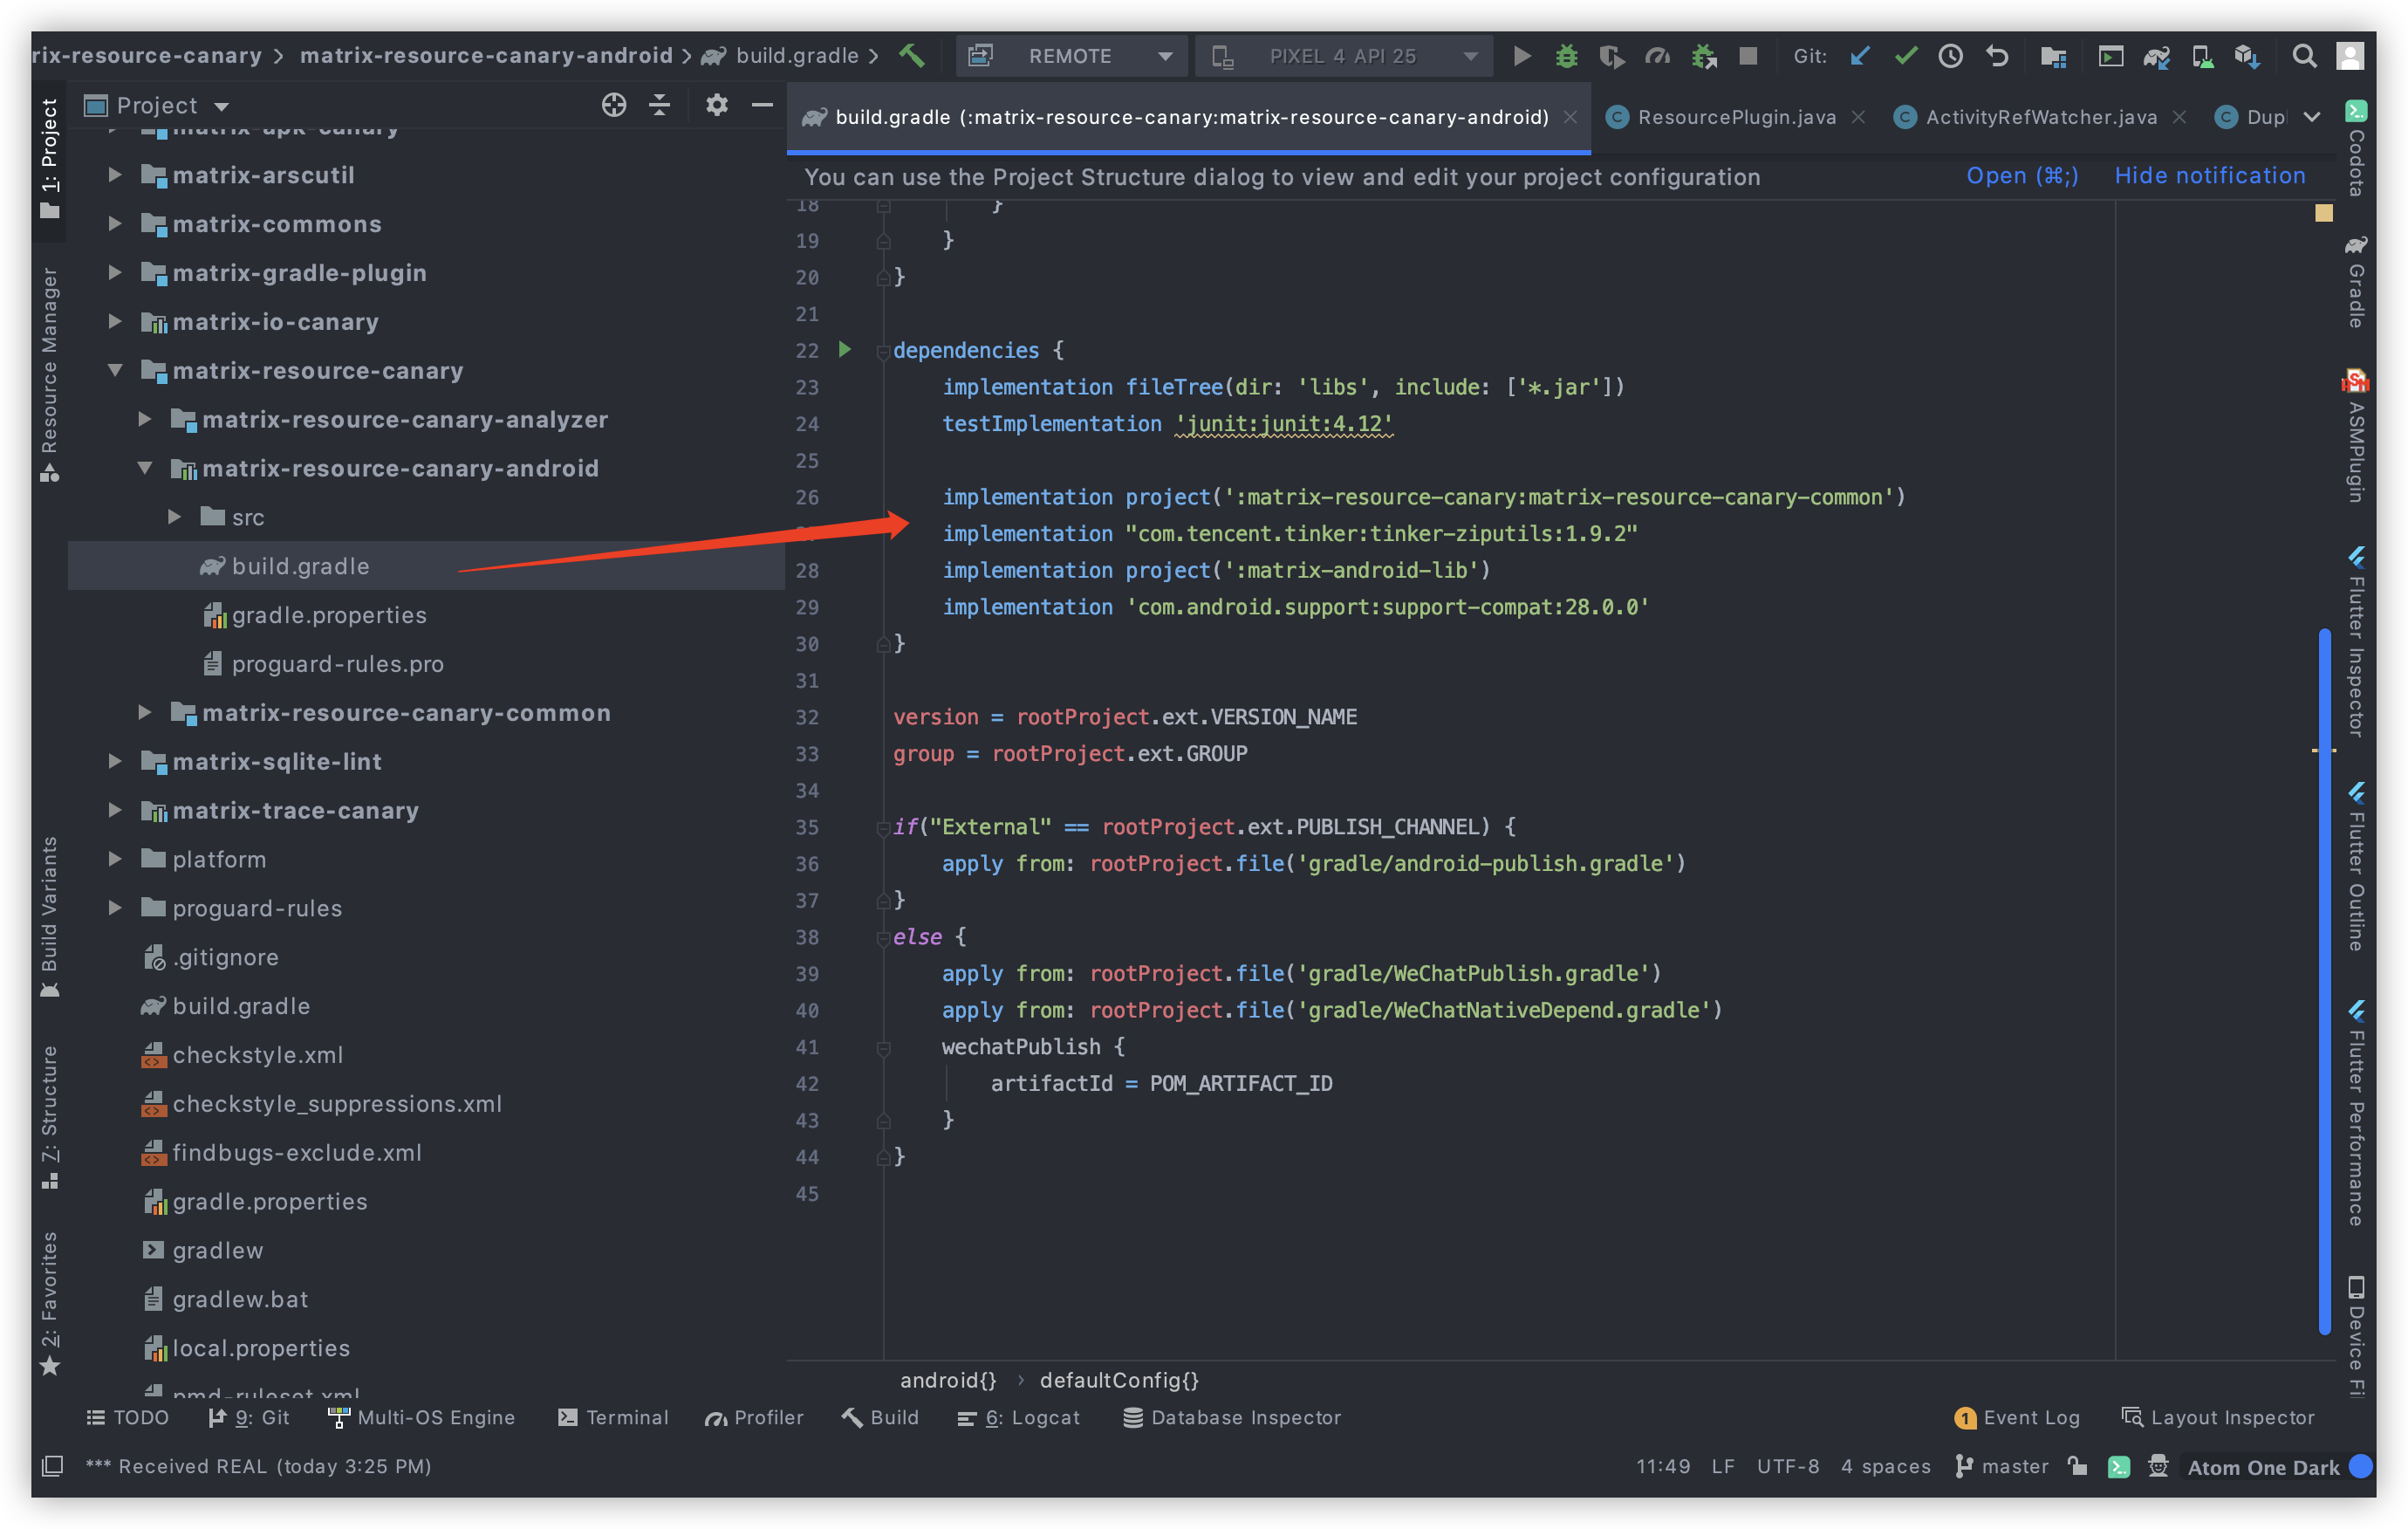
ResourcePlugin
我们知道在使用matrix 的时候,需要new一些plugin,那么这个ResourcePlugin其实就是我们要分析的主角,首先看到它的init方法。
@Overridepublic void init(Application app, PluginListener listener) {super.init(app, listener);if (Build.VERSION.SDK_INT < Build.VERSION_CODES.ICE_CREAM_SANDWICH) {MatrixLog.e(TAG, "API is low Build.VERSION_CODES.ICE_CREAM_SANDWICH(14), ResourcePlugin is not supported");unSupportPlugin();return;}mWatcher = new ActivityRefWatcher(app, this);}
首先告诉我们的是,Android sdk 版本小于14的话,是不支持的。然后初始化了一个ActivityRefWatcher类,来看下它
//Android生命周期监听,与我们分析相关的功能:弹出Dump内存的Dialog、Dump内存数据、读取内存数据裁剪Hprof文件、生成包含裁剪后的Hprofpublic class ActivityRefWatcher extends FilePublisher implements Watcher, IAppForeground//不贴代码了哈,总之这里用了SharedPreferences作为二级缓存,HashMap<String, Long>作为一级缓存,通过检索发现是在缓存mActivityNamepublic class FilePublisher extends IssuePublisher//监听?开始结束释放,应该是监听什么东西public interface Watcher {void start();void stop();void destroy();}public interface IAppForeground {//应用前台和后台的状态void onForeground(boolean isForeground);}
我们其实是想找到dump heap对吧,打开代码目录看一番,又发现如图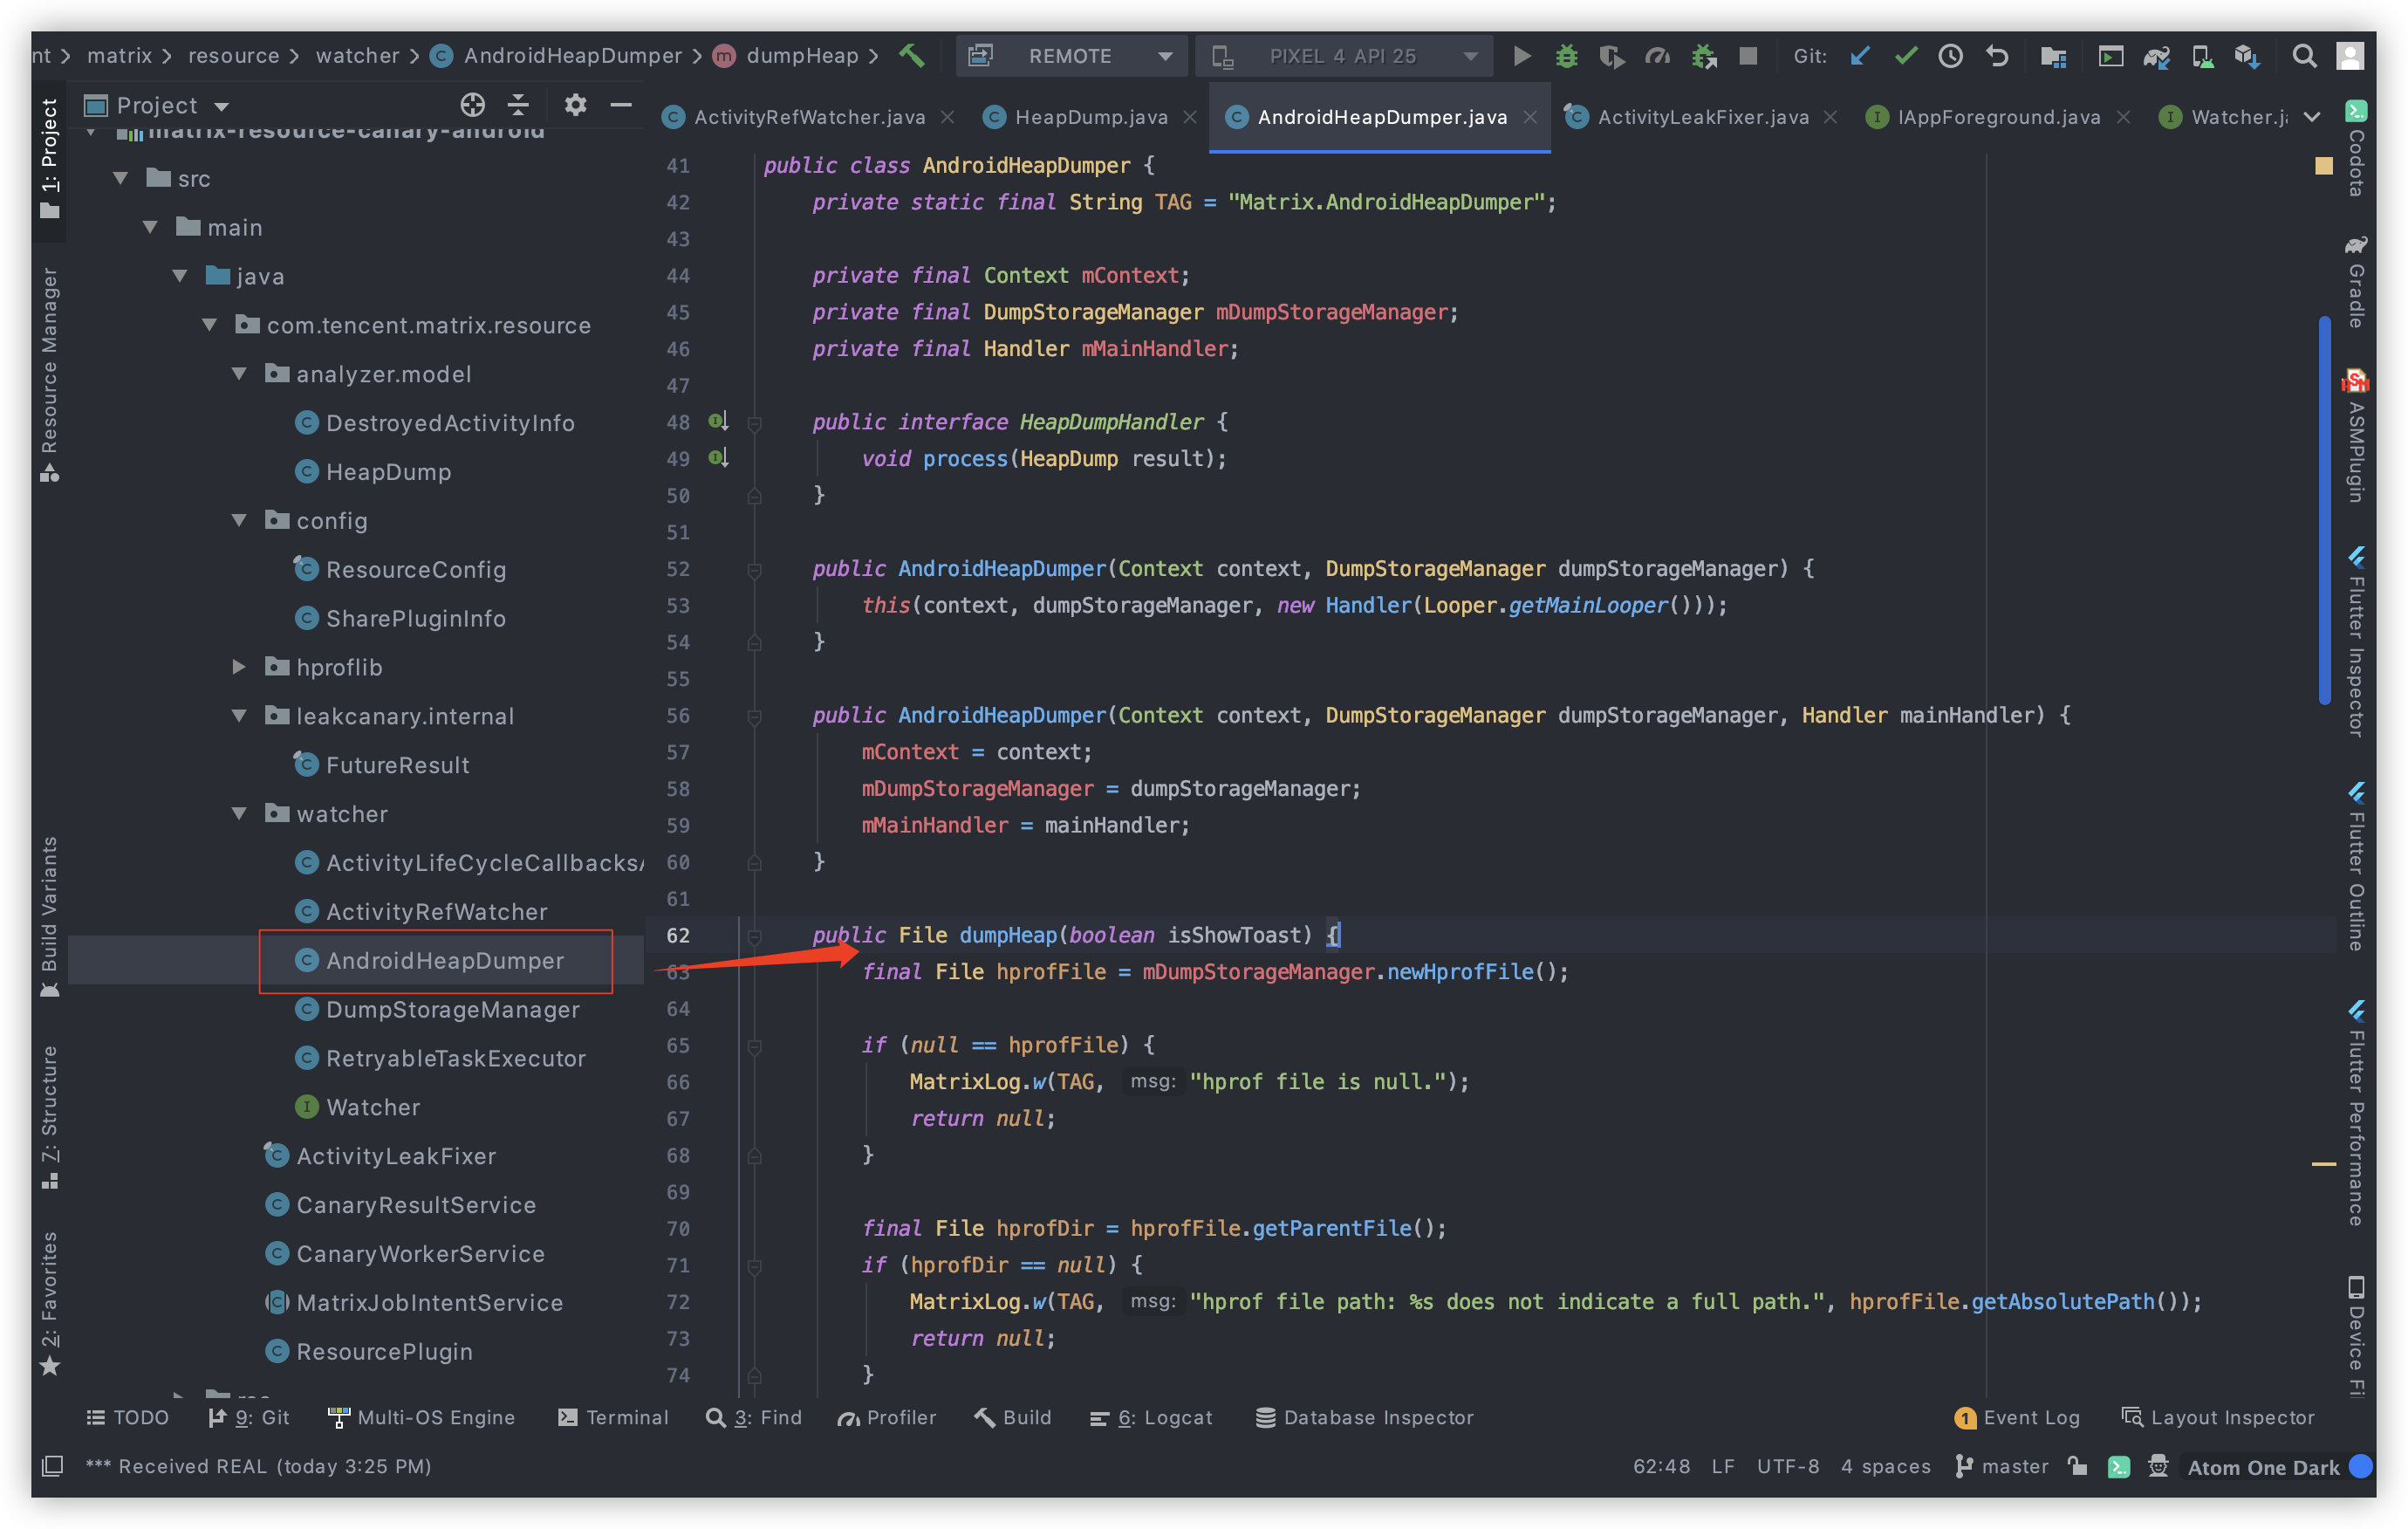
看log发现 hprof file is null 检测,没跑了就是它,这下我们就可以寻找它在哪里被调用,然后去看看它到底在什么时候开始这个操作的。
if (mDumpHprofMode == ResourceConfig.DumpMode.AUTO_DUMP) {final File hprofFile = mHeapDumper.dumpHeap(true);
发现mDumpHprofMode的值是 AUTO_DUMP 的时候,那么mDumpHprofMode的值是什么时候被改的呢?
private ResourceConfig(IDynamicConfig dynamicConfig, DumpMode dumpHprofMode, boolean detectDebuger, Intent pendingIntent) {this.mDynamicConfig = dynamicConfig;this.mDumpHprofMode = dumpHprofMode;mDetectDebugger = detectDebuger;mContentIntent = pendingIntent;}
通过检索,我发现它是在ResourceConfig中初始化,那么就可以肯定了,这里并不是触发时机,而是一个开关控制,那我们再回到if (mDumpHprofMode == ResourceConfig.DumpMode.AUTO_DUMP)的函数中,看这个函数是谁执行的,发现它是ActivityRefWatcher的私有成员变量
private final RetryableTask mScanDestroyedActivitiesTask = new RetryableTask() {@Overridepublic Status execute() {// If destroyed activity list is empty, just wait to save power.if (mDestroyedActivityInfos.isEmpty()) {MatrixLog.i(TAG, "DestroyedActivityInfo isEmpty!");return Status.RETRY;}// Fake leaks will be generated when debugger is attached.if (Debug.isDebuggerConnected() && !mResourcePlugin.getConfig().getDetectDebugger()) {MatrixLog.w(TAG, "debugger is connected, to avoid fake result, detection was delayed.");return Status.RETRY;}// 该对象就是为了检测GC有没有触发,这是由于弱引用的特性,在发生GC的时候会被虚拟机回收,如果未回收,那么GC肯定没发生final WeakReference<Object> sentinelRef = new WeakReference<>(new Object());// 通过Runtime.getRuntime().gc();触发GC操作;triggerGc();// 如果未发生GC,等待下一次if (sentinelRef.get() != null) {// System ignored our gc request, we will retry later.// 系统忽略我们的gc请求,等待下一次检测。MatrixLog.d(TAG, "system ignore our gc request, wait for next detection.");return Status.RETRY;}// mDestroyedActivityInfos 基于链接节点的无界线程安全队列,用于存放 被执行onActivityDestroyed的Activity对象final Iterator<DestroyedActivityInfo> infoIt = mDestroyedActivityInfos.iterator();//跳过,我们分析的不是它while (infoIt.hasNext()) {final DestroyedActivityInfo destroyedActivityInfo = infoIt.next();if (!mResourcePlugin.getConfig().getDetectDebugger() && isPublished(destroyedActivityInfo.mActivityName) && mDumpHprofMode != ResourceConfig.DumpMode.SILENCE_DUMP) {MatrixLog.v(TAG, "activity with key [%s] was already published.", destroyedActivityInfo.mActivityName);infoIt.remove();continue;}if (destroyedActivityInfo.mActivityRef.get() == null) {// The activity was recycled by a gc triggered outside.MatrixLog.v(TAG, "activity with key [%s] was already recycled.", destroyedActivityInfo.mKey);infoIt.remove();continue;}++destroyedActivityInfo.mDetectedCount;if (destroyedActivityInfo.mDetectedCount < mMaxRedetectTimes&& !mResourcePlugin.getConfig().getDetectDebugger()) {// Although the sentinel tell us the activity should have been recycled,// system may still ignore it, so try again until we reach max retry times.MatrixLog.i(TAG, "activity with key [%s] should be recycled but actually still \n"+ "exists in %s times, wait for next detection to confirm.",destroyedActivityInfo.mKey, destroyedActivityInfo.mDetectedCount);continue;}MatrixLog.i(TAG, "activity with key [%s] was suspected to be a leaked instance. mode[%s]", destroyedActivityInfo.mKey, mDumpHprofMode);//判断DumpMode,SILENCE_DUMP默认模式,AUTO_DUMP 该模式会执行Android的dumpHeap, MANUAL_DUMP 该模式是将泄漏的类名发送到通知if (mDumpHprofMode == ResourceConfig.DumpMode.SILENCE_DUMP) {if (!isPublished(destroyedActivityInfo.mActivityName)) {final JSONObject resultJson = new JSONObject();try {resultJson.put(SharePluginInfo.ISSUE_ACTIVITY_NAME, destroyedActivityInfo.mActivityName);} catch (JSONException e) {MatrixLog.printErrStackTrace(TAG, e, "unexpected exception.");}markPublished(destroyedActivityInfo.mActivityName);// 将泄漏的类名回调给 onDetectIssuemResourcePlugin.onDetectIssue(new Issue(resultJson));}// 将泄漏的类名回调给 onLeakif (null != activityLeakCallback) {activityLeakCallback.onLeak(destroyedActivityInfo.mActivityName, destroyedActivityInfo.mKey);}} else if (mDumpHprofMode == ResourceConfig.DumpMode.AUTO_DUMP) {final File hprofFile = mHeapDumper.dumpHeap(true);if (hprofFile != null) {markPublished(destroyedActivityInfo.mActivityName);final HeapDump heapDump = new HeapDump(hprofFile, destroyedActivityInfo.mKey, destroyedActivityInfo.mActivityName);// 将 dump 信息进行压缩、上报mHeapDumpHandler.process(heapDump);infoIt.remove();} else {MatrixLog.i(TAG, "heap dump for further analyzing activity with key [%s] was failed, just ignore.",destroyedActivityInfo.mKey);infoIt.remove();}} else if (mDumpHprofMode == ResourceConfig.DumpMode.MANUAL_DUMP) {NotificationManager notificationManager = (NotificationManager) context.getSystemService(Context.NOTIFICATION_SERVICE);String dumpingHeapContent = context.getString(R.string.resource_canary_leak_tip);String dumpingHeapTitle = destroyedActivityInfo.mActivityName;mContentIntent.putExtra(SharePluginInfo.ISSUE_ACTIVITY_NAME, destroyedActivityInfo.mActivityName);mContentIntent.putExtra(SharePluginInfo.ISSUE_REF_KEY, destroyedActivityInfo.mKey);PendingIntent pIntent = PendingIntent.getActivity(context, 0, mContentIntent,PendingIntent.FLAG_UPDATE_CURRENT);NotificationCompat.Builder builder = new NotificationCompat.Builder(context).setContentTitle(dumpingHeapTitle).setContentIntent(pIntent).setContentText(dumpingHeapContent);Notification notification = buildNotification(context, builder);notificationManager.notify(NOTIFICATION_ID, notification);infoIt.remove();markPublished(destroyedActivityInfo.mActivityName);MatrixLog.i(TAG, "show notification for notify activity leak. %s", destroyedActivityInfo.mActivityName);} else {// 否则将泄漏的类名回调给 onDetectIssue即可// Lightweight mode, just report leaked activity name.MatrixLog.i(TAG, "lightweight mode, just report leaked activity name.");markPublished(destroyedActivityInfo.mActivityName);final JSONObject resultJson = new JSONObject();try {resultJson.put(SharePluginInfo.ISSUE_ACTIVITY_NAME, destroyedActivityInfo.mActivityName);} catch (JSONException e) {MatrixLog.printErrStackTrace(TAG, e, "unexpected exception.");}mResourcePlugin.onDetectIssue(new Issue(resultJson));}}return Status.RETRY;}};
好,现在找一下上面的execute方法是时间时候被执行的呢?我通过检索后发现
// 递归循环调用private void postToMainThreadWithDelay(final RetryableTask task, final int failedAttempts) {mMainHandler.postDelayed(new Runnable() {@Overridepublic void run() {RetryableTask.Status status = task.execute();if (status == RetryableTask.Status.RETRY) {postToMainThreadWithDelay(task, failedAttempts + 1);}}}, mDelayMillis);}// mDelayMillis 默认值是这个,默认一分钟一次private static final long DEFAULT_DETECT_INTERVAL_MILLIS = TimeUnit.MINUTES.toMillis(1);//最终找到 mScanDestroyedActivitiesTask 任务其实是在应用进入前台的时候开始无限循环。@Overridepublic void onForeground(boolean isForeground) {if (isForeground) {MatrixLog.i(TAG, "we are in foreground, modify scan time[%sms].", mFgScanTimes);mDetectExecutor.clearTasks();// 后台默认1分钟检测一次mDetectExecutor.setDelayMillis(mFgScanTimes);mDetectExecutor.executeInBackground(mScanDestroyedActivitiesTask);} else {// 后台默认20分钟检测一次MatrixLog.i(TAG, "we are in background, modify scan time[%sms].", mBgScanTimes);mDetectExecutor.setDelayMillis(mBgScanTimes);}}
从这些逻辑我们可以确定:
- 应用前台后,1分钟检测一次
- 后台后,20分钟检测一次
当检测到内存泄漏后,如果mDumpHprofMode是AUTO_DUMP模式,那么才会heap dump ,最终上传?上传哪呢?继续看 ```java
new AndroidHeapDumper.HeapDumpHandler() {@Overridepublic void process(HeapDump result) {// 最终调用的是CanaryWorkerServiceCanaryWorkerService.shrinkHprofAndReport(context, result);}};
//就是一个普通的service public class CanaryWorkerService extends MatrixJobIntentService public abstract class MatrixJobIntentService extends Service // CanaryWorkerService中处理Intent消息 @Override protected void onHandleWork(Intent intent) {
if (intent != null) {final String action = intent.getAction();if (ACTION_SHRINK_HPROF.equals(action)) {try {intent.setExtrasClassLoader(this.getClassLoader());final HeapDump heapDump = (HeapDump) intent.getSerializableExtra(EXTRA_PARAM_HEAPDUMP);if (heapDump != null) {//doShrinkHprofAndReport(heapDump);} else {MatrixLog.e(TAG, "failed to deserialize heap dump, give up shrinking and reporting.");}} catch (Throwable thr) {MatrixLog.printErrStackTrace(TAG, thr, "failed to deserialize heap dump, give up shrinking and reporting.");}}}
} // 裁剪 private void doShrinkHprofAndReport(HeapDump heapDump) {
final File hprofDir = heapDump.getHprofFile().getParentFile();// 生成裁剪后文件 shrinkedHProfFilefinal File shrinkedHProfFile = new File(hprofDir, getShrinkHprofName(heapDump.getHprofFile()));final File zipResFile = new File(hprofDir, getResultZipName("dump_result_" + android.os.Process.myPid()));final File hprofFile = heapDump.getHprofFile();ZipOutputStream zos = null;try {long startTime = System.currentTimeMillis();// 将裁剪结果写入 shrinkedHProfFile 文件中new HprofBufferShrinker().shrink(hprofFile, shrinkedHProfFile);MatrixLog.i(TAG, "shrink hprof file %s, size: %dk to %s, size: %dk, use time:%d",hprofFile.getPath(), hprofFile.length() / 1024, shrinkedHProfFile.getPath(), shrinkedHProfFile.length() / 1024, (System.currentTimeMillis() - startTime));// 压缩文件zos = new ZipOutputStream(new BufferedOutputStream(new FileOutputStream(zipResFile)));final ZipEntry resultInfoEntry = new ZipEntry("result.info");final ZipEntry shrinkedHProfEntry = new ZipEntry(shrinkedHProfFile.getName());zos.putNextEntry(resultInfoEntry);final PrintWriter pw = new PrintWriter(new OutputStreamWriter(zos, Charset.forName("UTF-8")));pw.println("# Resource Canary Result Infomation. THIS FILE IS IMPORTANT FOR THE ANALYZER !!");pw.println("sdkVersion=" + Build.VERSION.SDK_INT);pw.println("manufacturer=" + Build.MANUFACTURER);pw.println("hprofEntry=" + shrinkedHProfEntry.getName());pw.println("leakedActivityKey=" + heapDump.getReferenceKey());pw.flush();zos.closeEntry();zos.putNextEntry(shrinkedHProfEntry);copyFileToStream(shrinkedHProfFile, zos);zos.closeEntry();shrinkedHProfFile.delete();hprofFile.delete();MatrixLog.i(TAG, "process hprof file use total time:%d", (System.currentTimeMillis() - startTime));// 上报文件,最终调用在下面CanaryResultService.reportHprofResult(this, zipResFile.getAbsolutePath(), heapDump.getActivityName());} catch (IOException e) {MatrixLog.printErrStackTrace(TAG, e, "");} finally {closeQuietly(zos);}
} //转JSON后 回调到onDetectIssue中 private void doReportHprofResult(String resultPath, String activityName) {
try {final JSONObject resultJson = new JSONObject();
// resultJson = DeviceUtil.getDeviceInfo(resultJson, getApplication());
resultJson.put(SharePluginInfo.ISSUE_RESULT_PATH, resultPath);resultJson.put(SharePluginInfo.ISSUE_ACTIVITY_NAME, activityName);Plugin plugin = Matrix.with().getPluginByClass(ResourcePlugin.class);if (plugin != null) {plugin.onDetectIssue(new Issue(resultJson));}} catch (Throwable thr) {MatrixLog.printErrStackTrace(TAG, thr, "unexpected exception, skip reporting.");}
}
经过这么一些列的操作,接下来就该分析hprof文件了吧,现在也基本明白,Matrix的dump heap过程,比起上面的例子,其实就是多了一些自动化获取和裁剪的过程。具体分析的话肯定是通过matrix-resource-canary-analyzer它的jar来分析喽,这样整个环节是不是就清楚了?那analyzer相对于上面的**DuplicatedBitmapAnalyzer项目又有什么不同呢?请看博客:**<br />[Matrix ResourceCanary -- Activity 泄漏及Bitmap冗余检测](https://cloud.tencent.com/developer/article/1379397)<br />[检测内存中重复的Bitmap](https://lyldalek.top/2020/08/19/blog_bak/Blog/Android-%E6%BA%90%E7%A0%81%E8%A7%A3%E6%9E%90/Matrix/015-Matrix%E6%BA%90%E7%A0%81%E5%88%86%E6%9E%90%EF%BC%9A%E6%A3%80%E6%B5%8B%E5%86%85%E5%AD%98%E4%B8%AD%E9%87%8D%E5%A4%8D%E7%9A%84Bitmap/)<br />里面写的特别详细,我就不重复写了。<a name="xjoGk"></a>## 总结一下吧前台一分钟检测一次泄漏,后台二十分钟检测一次泄漏,总体性能影响来说:1. 不在线上开启dump heap,这会严重影响性能,建议开发阶段将bitmap重复的问题搞定并解决1. 如果手机性能不好,可以将检测延迟时间拉长,目前官方是1分钟前台,可以根据手机适当放慢(为什么这么讲:因为官方测试,设定的轮询间隔为1min。以通讯录界面和朋友圈界面的帧率作为参考,在接入ResourceCanary后2min内的平均帧率降低了10帧左右),所以为了降低对差手机的影响,我觉得可以适当 调为2分钟,或者甚至是5分钟。<a name="Eu9nA"></a>## 对了还有个疑问?Matrix在8.0以上的系统中可以检测bitmap吗?答案是不可以,请看源码:<br />是吧,26就是8.0,只有小于8.0才支持的。```javaif (sdkVersion < 26) {final ExcludedBmps excludedBmps = AndroidExcludedBmpRefs.createDefaults().build();duplicatedBmpResult = new DuplicatedBitmapAnalyzer(mMinBmpLeakSize, excludedBmps).analyze(heapSnapshot);} else {System.err.println("\n ! SDK version of target device is larger or equal to 26, "+ "which is not supported by DuplicatedBitmapAnalyzer.");}

若有收获,就点个赞吧
0 人点赞
