什么是内存泄漏
在java虚拟机中,由于一些对象一直被强引用而导致GC无法回收,我们称之为内存泄漏,其实这样讲并不准确,为什么呢?首先我们先来了解下GC的回收策略,其实你应该就明白了。
内存回收策略
我们都说强引用会导致无法被回收,那么虚拟是怎么知道他们被强引用呢?大致有两种办法
- 引用计数法
这种方法简单,高效,但是发生如下问题时就很难解决:
当A对象和B对象处于循环引用时,那么就无法回收。
- 可达性分析法
由于上面的问题,java中使用了可达性分析法,它的思路是通过一些《GC Roots》对象作为起点进行可达性分析,如果对某个对象未发现可达路径,那么该对象即将被回收,是即将哈,并不是立马回收,而是要先做个标记,等待第二次GC时,发现还是不可达,并且未覆盖finalize方法,那么对象被回收,如果对象覆盖了finalize方法,那么在第一次发现不可达时就放入一个F-Queue队列,等待系统自动执行finalize方法,当第二次发现已经执行finalize方法后就可以回收了,而如果对象在finalize方法中将自己赋值给某个对象时还有机会将自己救活。重新复活。
从上面我们分析出,如果我们可以找到GC Roots对象,那么就可以判断一个对象是否可以被回收。如何找到GC Roots对象也是关键,下面列举几种
| 内存区域 | 对象 | 备注 |
|---|---|---|
| 虚拟机栈 | 栈帧中变量引用的对象 | 如在方法中 Object a = new Object() 那么a就是GC Roots对象 |
| 方法区 | 静态属性引用的对象 | static关键字修饰的变量引用的对象 |
| 常量引用的对象 | static final修饰的变量 | |
| 本地方法栈 | native方法引用的对象 |
上面分析出现了很多的引用,那么java中对引用是如何规范的?这就需要对四种引用做了解,如下:
| 类型 | GC回收策略 | 备注 |
|---|---|---|
| 强引用 | 可达就不会被GC回收,哪怕最终导致OOM | A a = new A() 这就是一个强引用 |
| 软引用 | 内存不足时,垃圾回收器就会考虑回收它 | SoftReference |
| 弱引用 | GC时就会将其回收 | WeakReference |
| 虚引用 | 在任何时候都可能被垃圾回收器回收 | PhantomReference |
基于上面的策略,其实我们就可以通过弱应用来检测内存泄漏,比如你给Activity包一层WeakReference
Matrix 内存泄漏代码分析
我们从ResourcePlugin开始,代码如下:
@Overridepublic void init(Application app, PluginListener listener) {super.init(app, listener);if (Build.VERSION.SDK_INT < Build.VERSION_CODES.ICE_CREAM_SANDWICH) {MatrixLog.e(TAG, "API is low Build.VERSION_CODES.ICE_CREAM_SANDWICH(14), ResourcePlugin is not supported");unSupportPlugin();return;}mWatcher = new ActivityRefWatcher(app, this);}
Activity检测的代码就在ActivityRefWatcher中,那么先简单看下这个类都有什么?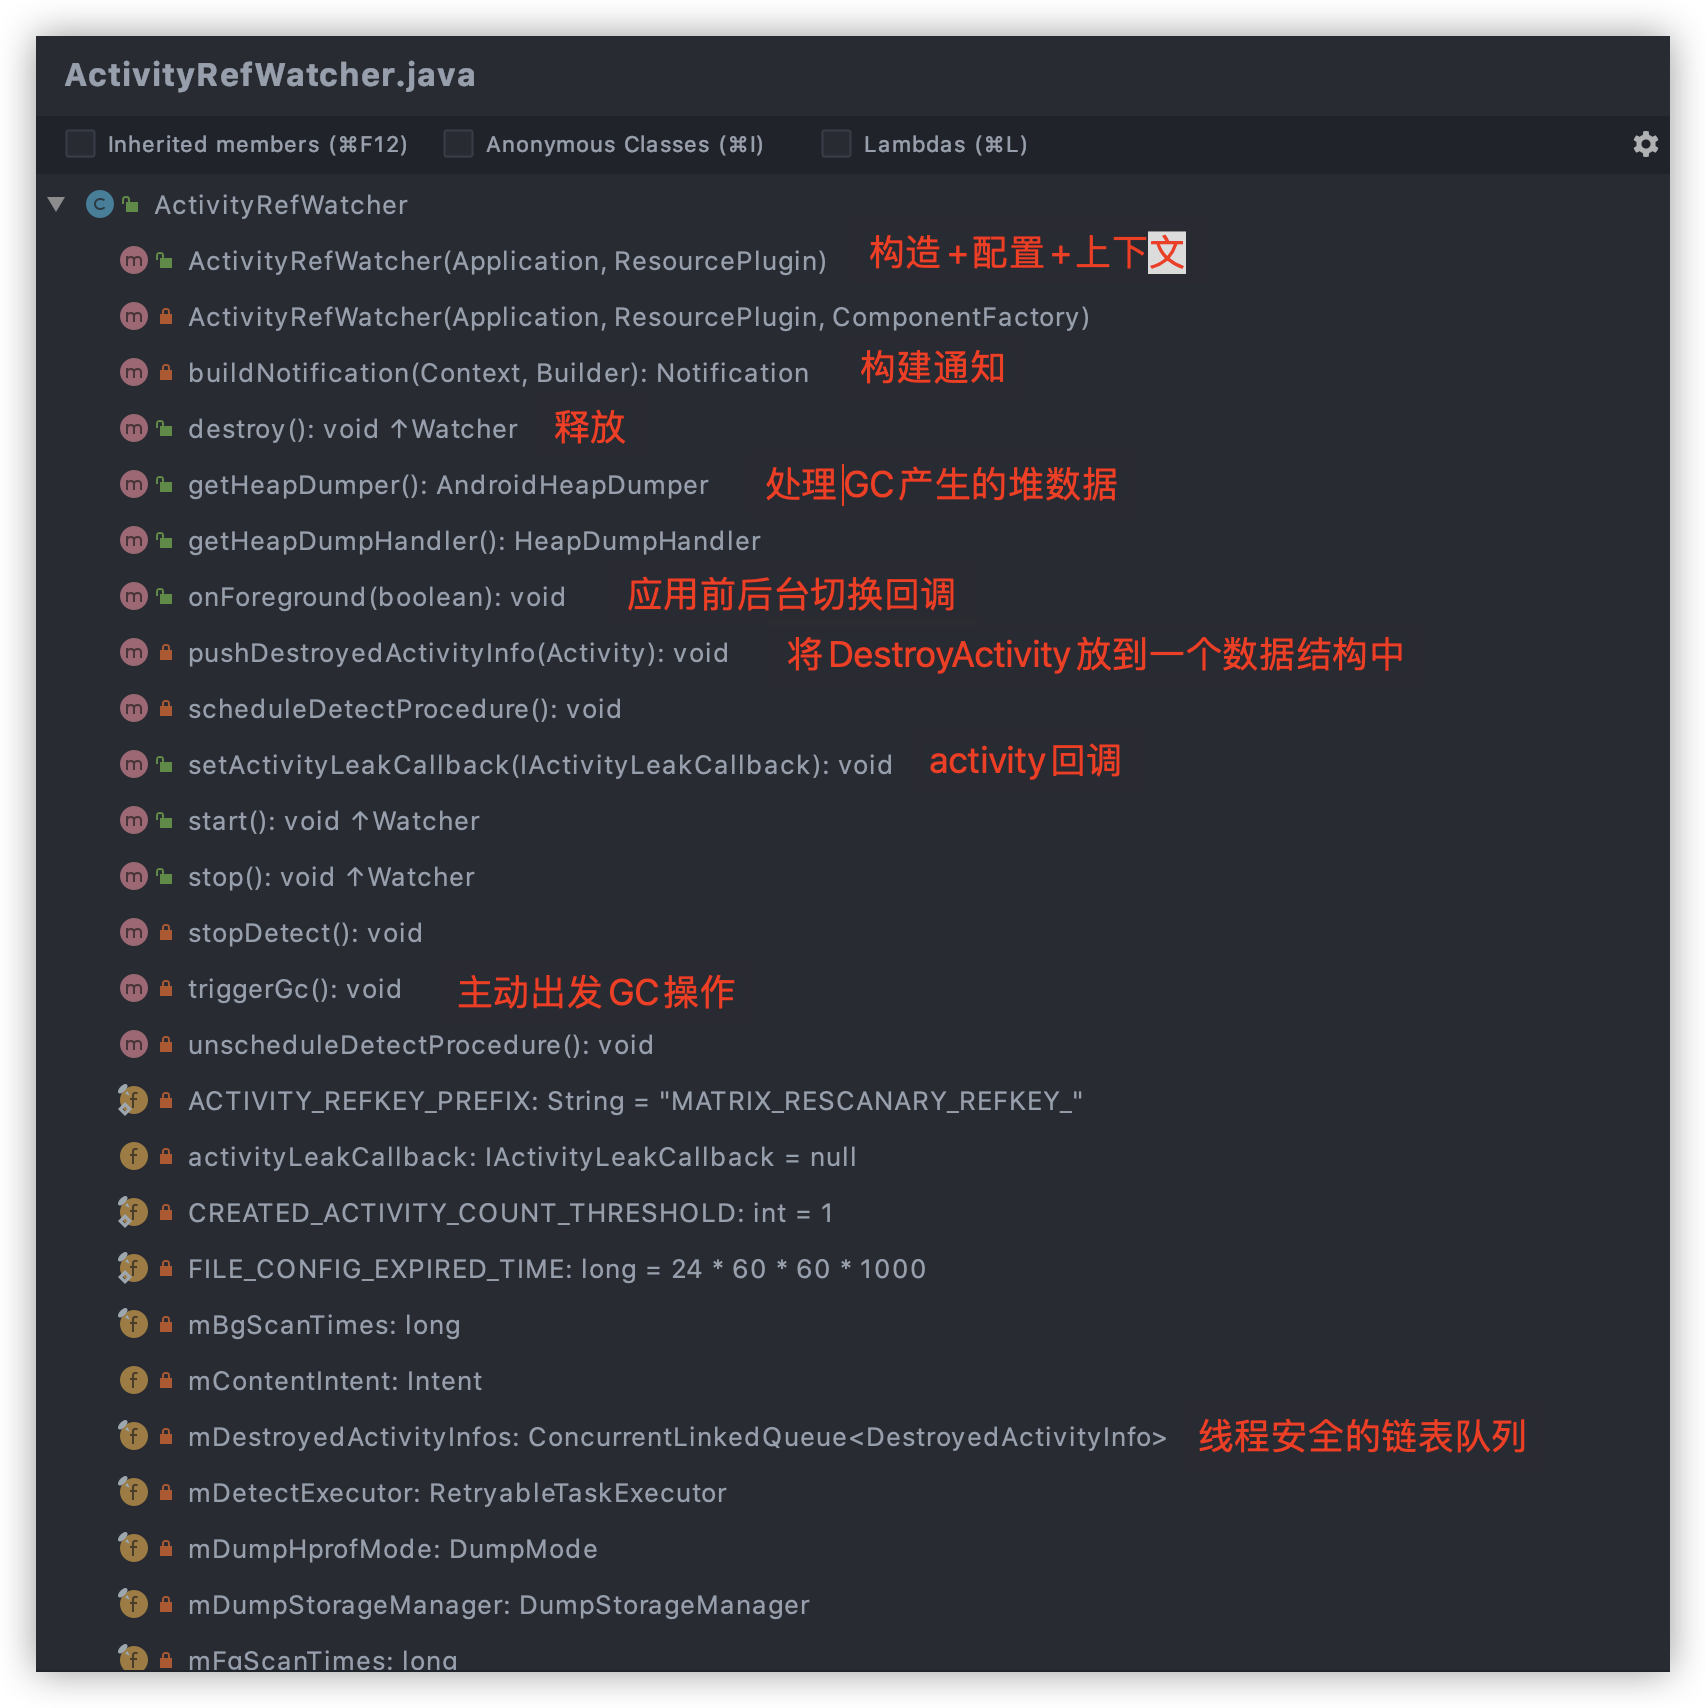
从上面我们看到几个事件:
- 初始化
- GC 以及处理Activity的泄漏逻辑
- 应用前后台切换
- 将Activity放入一个线程安全的队列中
我们按照上面的几个事件,看它最终是如何发现Activity内存泄漏的。
初始化
首先看代码
private ActivityRefWatcher(Application app,ResourcePlugin resourcePlugin,ComponentFactory componentFactory) {super(app, FILE_CONFIG_EXPIRED_TIME, resourcePlugin.getTag(), resourcePlugin);this.mResourcePlugin = resourcePlugin;// 拿到配置final ResourceConfig config = resourcePlugin.getConfig();final Context context = app;// 获取一个HandlerThread,就是包装了Handler的一个线程,就跟我们在子线程创建一个Handler一样HandlerThread handlerThread = MatrixHandlerThread.getDefaultHandlerThread();// 这个Mode用来判断是否要 dump heap 数据mDumpHprofMode = config.getDumpHprofMode();// 后台扫描时间配置 默认是20分钟扫描一次mBgScanTimes = config.getBgScanIntervalMillis();// 前台扫描时间配置 默认是1分钟扫描一次mFgScanTimes = config.getScanIntervalMillis();// 通知需要的IntentmContentIntent = config.getNotificationContentIntent();// 用来构建 主线程或者子线程的message无限循环,类似一个心跳机制,根据上面的mFgScanTimes时间来做心跳间隔。mDetectExecutor = componentFactory.createDetectExecutor(config, handlerThread);// 最大检测次数,用于限制对已经调用OnDetrory的Activity的检测次数,小于这个数就继续检测,如果大于它就有可能是泄漏了,然后就走处理泄漏的逻辑mMaxRedetectTimes = config.getMaxRedetectTimes();// 对堆数据的Storage管理mDumpStorageManager = componentFactory.createDumpStorageManager(context);// 生成堆数据mHeapDumper = componentFactory.createHeapDumper(context, mDumpStorageManager);// 处理堆数据,如裁剪数据mHeapDumpHandler = componentFactory.createHeapDumpHandler(context, config);// 缓存OnDetroy后的Activity队列mDestroyedActivityInfos = new ConcurrentLinkedQueue<>();}
GC 以及处理Activity的泄漏逻辑
先看哪里触发的GC
private final RetryableTask mScanDestroyedActivitiesTask = new RetryableTask() {@Overridepublic Status execute() {// If destroyed activity list is empty, just wait to save power.if (mDestroyedActivityInfos.isEmpty()) {MatrixLog.i(TAG, "DestroyedActivityInfo isEmpty!");return Status.RETRY;}// Fake leaks will be generated when debugger is attached.if (Debug.isDebuggerConnected() && !mResourcePlugin.getConfig().getDetectDebugger()) {MatrixLog.w(TAG, "debugger is connected, to avoid fake result, detection was delayed.");return Status.RETRY;}final WeakReference<Object> sentinelRef = new WeakReference<>(new Object());// 这里有个技巧是,利用了弱引用的特性,GC后判断sentinelRef.get()是否为null,来判断是否真的发生了GC,因为你调用的GC后,系统不一定立马执行,还要等待。triggerGc();if (sentinelRef.get() != null) {// System ignored our gc request, we will retry later.MatrixLog.d(TAG, "system ignore our gc request, wait for next detection.");return Status.RETRY;}.....}
GC后Activity的数据怎么处理呢?请接着看如下代码
// 从这里接着上面的执行,开始迭代mDestroyedActivityInfos队列final Iterator<DestroyedActivityInfo> infoIt = mDestroyedActivityInfos.iterator();// 开始检测队列中是否存在数据while (infoIt.hasNext()) {// 拿到destroyedActivityInfo对象final DestroyedActivityInfo destroyedActivityInfo = infoIt.next();// 非检测debug配置,isPublished 已经处理过的,切非默认模式,则直接从队列中删除if (!mResourcePlugin.getConfig().getDetectDebugger() && isPublished(destroyedActivityInfo.mActivityName) && mDumpHprofMode != ResourceConfig.DumpMode.SILENCE_DUMP) {MatrixLog.v(TAG, "activity with key [%s] was already published.", destroyedActivityInfo.mActivityName);infoIt.remove();continue;}// WeakReference<Activity> mActivityRef 是对Activity的弱引用,如果弱引用已经空了,那么也不需要再检测了,直接删除if (destroyedActivityInfo.mActivityRef.get() == null) {// The activity was recycled by a gc triggered outside.MatrixLog.v(TAG, "activity with key [%s] was already recycled.", destroyedActivityInfo.mKey);infoIt.remove();continue;}// 检测次数+1++destroyedActivityInfo.mDetectedCount;// 小于最大检测次数并且非debug,跳过该次,开始检测下一个if (destroyedActivityInfo.mDetectedCount < mMaxRedetectTimes&& !mResourcePlugin.getConfig().getDetectDebugger()) {// Although the sentinel tell us the activity should have been recycled,// system may still ignore it, so try again until we reach max retry times.MatrixLog.i(TAG, "activity with key [%s] should be recycled but actually still \n"+ "exists in %s times, wait for next detection to confirm.",destroyedActivityInfo.mKey, destroyedActivityInfo.mDetectedCount);continue;}MatrixLog.i(TAG, "activity with key [%s] was suspected to be a leaked instance. mode[%s]", destroyedActivityInfo.mKey, mDumpHprofMode);// 默认模式if (mDumpHprofMode == ResourceConfig.DumpMode.SILENCE_DUMP) {// 没处理过再处理if (!isPublished(destroyedActivityInfo.mActivityName)) {final JSONObject resultJson = new JSONObject();try {resultJson.put(SharePluginInfo.ISSUE_ACTIVITY_NAME, destroyedActivityInfo.mActivityName);} catch (JSONException e) {MatrixLog.printErrStackTrace(TAG, e, "unexpected exception.");}markPublished(destroyedActivityInfo.mActivityName);// 将结果交给插件onDetectIssue回调mResourcePlugin.onDetectIssue(new Issue(resultJson));}if (null != activityLeakCallback) {// 检查回调不空,则将泄漏ActivityName返回activityLeakCallback.onLeak(destroyedActivityInfo.mActivityName, destroyedActivityInfo.mKey);}} else if (mDumpHprofMode == ResourceConfig.DumpMode.AUTO_DUMP) {// 将GC的堆数据,倒入到文件中final File hprofFile = mHeapDumper.dumpHeap(true);if (hprofFile != null) {markPublished(destroyedActivityInfo.mActivityName);final HeapDump heapDump = new HeapDump(hprofFile, destroyedActivityInfo.mKey, destroyedActivityInfo.mActivityName);// 裁剪文件,之后可以通过anallyzer jar包对其分析结果。mHeapDumpHandler.process(heapDump);infoIt.remove();} else {MatrixLog.i(TAG, "heap dump for further analyzing activity with key [%s] was failed, just ignore.",destroyedActivityInfo.mKey);infoIt.remove();}} else if (mDumpHprofMode == ResourceConfig.DumpMode.MANUAL_DUMP) {// 创建通知显示泄漏的ActivityNotificationManager notificationManager = (NotificationManager) context.getSystemService(Context.NOTIFICATION_SERVICE);String dumpingHeapContent = context.getString(R.string.resource_canary_leak_tip);String dumpingHeapTitle = destroyedActivityInfo.mActivityName;mContentIntent.putExtra(SharePluginInfo.ISSUE_ACTIVITY_NAME, destroyedActivityInfo.mActivityName);mContentIntent.putExtra(SharePluginInfo.ISSUE_REF_KEY, destroyedActivityInfo.mKey);PendingIntent pIntent = PendingIntent.getActivity(context, 0, mContentIntent,PendingIntent.FLAG_UPDATE_CURRENT);NotificationCompat.Builder builder = new NotificationCompat.Builder(context).setContentTitle(dumpingHeapTitle).setContentIntent(pIntent).setContentText(dumpingHeapContent);Notification notification = buildNotification(context, builder);notificationManager.notify(NOTIFICATION_ID, notification);infoIt.remove();markPublished(destroyedActivityInfo.mActivityName);MatrixLog.i(TAG, "show notification for notify activity leak. %s", destroyedActivityInfo.mActivityName);} else {// 轻量级模式,直接反回泄漏的activity名字// Lightweight mode, just report leaked activity name.MatrixLog.i(TAG, "lightweight mode, just report leaked activity name.");markPublished(destroyedActivityInfo.mActivityName);final JSONObject resultJson = new JSONObject();try {resultJson.put(SharePluginInfo.ISSUE_ACTIVITY_NAME, destroyedActivityInfo.mActivityName);} catch (JSONException e) {MatrixLog.printErrStackTrace(TAG, e, "unexpected exception.");}mResourcePlugin.onDetectIssue(new Issue(resultJson));}}return Status.RETRY;
应用前后台切换
我们这知道了它的处理逻辑,那么它的动力来源哪里呢?或者说是谁启动的呢?
@Overridepublic void onForeground(boolean isForeground) {if (isForeground) {MatrixLog.i(TAG, "we are in foreground, modify scan time[%sms].", mFgScanTimes);mDetectExecutor.clearTasks();// 前台延迟时间mDetectExecutor.setDelayMillis(mFgScanTimes);// 这就是RetryableTask mScanDestroyedActivitiesTask,在后台线程中一直回调mScanDestroyedActivitiesTask的execute函数mDetectExecutor.executeInBackground(mScanDestroyedActivitiesTask);} else {MatrixLog.i(TAG, "we are in background, modify scan time[%sms].", mBgScanTimes);// 应用后台后修改延迟时间mDetectExecutor.setDelayMillis(mBgScanTimes);}}
它是怎么做的一直心跳呢?
private void postToBackgroundWithDelay(final RetryableTask task, final int failedAttempts) {mBackgroundHandler.postDelayed(new Runnable() {@Overridepublic void run() {RetryableTask.Status status = task.execute();if (status == RetryableTask.Status.RETRY) {// 如果状态是RETRY,开启递归循环,延迟时间就是mDelayMillis,前台的时候是mFgScanTimes,后台是mBgScanTimespostToBackgroundWithDelay(task, failedAttempts + 1);}}}, mDelayMillis);}
你是不是也想知道onForeground是在哪被回调的?请看
//ActivityRefWatcher.class@Overridepublic void start() {stopDetect();final Application app = mResourcePlugin.getApplication();if (app != null) {// 拿到Activity生命周期回调app.registerActivityLifecycleCallbacks(mRemovedActivityMonitor);// 将其加入到listeners中,等待被通知AppActiveMatrixDelegate.INSTANCE.addListener(this);scheduleDetectProcedure();MatrixLog.i(TAG, "watcher is started.");}}//AppActiveMatrixDelegate.classpublic void addListener(IAppForeground listener) {synchronized (listeners) {listeners.add(listener);}}
将Activity放入一个线程安全的队列中
从上面我知道了在start的函数中,有registerActivityLifecycleCallbacks注册,且被调用过onDestroy的Activity都会被放入ConcurrentLinkedQueue
那么肯定就是在ActivityLifecycleCallback的onDestroy回调加进去的,我们随即去找下代码
private final Application.ActivityLifecycleCallbacks mRemovedActivityMonitor = new ActivityLifeCycleCallbacksAdapter() {@Overridepublic void onActivityDestroyed(Activity activity) {pushDestroyedActivityInfo(activity);}};private void pushDestroyedActivityInfo(Activity activity) {final String activityName = activity.getClass().getName();if (!mResourcePlugin.getConfig().getDetectDebugger() && mDumpHprofMode != ResourceConfig.DumpMode.SILENCE_DUMP && isPublished(activityName)) {MatrixLog.i(TAG, "activity leak with name %s had published, just ignore", activityName);return;}final UUID uuid = UUID.randomUUID();final StringBuilder keyBuilder = new StringBuilder();keyBuilder.append(ACTIVITY_REFKEY_PREFIX).append(activityName).append('_').append(Long.toHexString(uuid.getMostSignificantBits())).append(Long.toHexString(uuid.getLeastSignificantBits()));final String key = keyBuilder.toString();final DestroyedActivityInfo destroyedActivityInfo= new DestroyedActivityInfo(key, activity, activityName);// 对吧,跟我们的猜测一样。mDestroyedActivityInfos.add(destroyedActivityInfo);}
放入队列中后,就等待心跳,和最上面形成了一个循环。就这样夜以继日的不停劳动。标准劳模。
总结
Activity的内存泄漏源码逻辑,基本也就分析完了,大致总结:
- 当你开启start插件的时候,它监听了Activity的生命周期,和应用的前后台周期
- 在前后台切换的时候开启心跳,前台一分钟一次,后台二十分钟一次,默认情况,当然你也可以修改
- 检测的时候有几种模式,你可以选择通知、普通回调、甚至可以导出堆的数据,供你详细的分析结果。
- 当然GC只在开发阶段使用,因为这种模式会严重导致应用卡顿现象
- 还有就是在你不想检测的时候记得关闭

若有收获,就点个赞吧
0 人点赞
