单因素多个levels数据在做方差分析后,需要进一步做如t检验等置后检验,判断两两组间差异。更多知识分享请到 https://zouhua.top/。
加载R包和准备数据
# Load required R packageslibrary(tidyverse)library(rstatix)library(ggpubr)data("PlantGrowth")set.seed(1234)PlantGrowth %>% sample_n_by(group, size = 1)

查看统计量
PlantGrowth %>%group_by(group) %>%get_summary_stats(weight, type = "mean_sd")

使用ANOVA test比较多组的平均值
res.aov <- PlantGrowth %>% anova_test(weight ~ group)res.aov

组间t检验
pwc <- PlantGrowth %>%pairwise_t_test(weight ~ group, p.adjust.method = "bonferroni")pwc

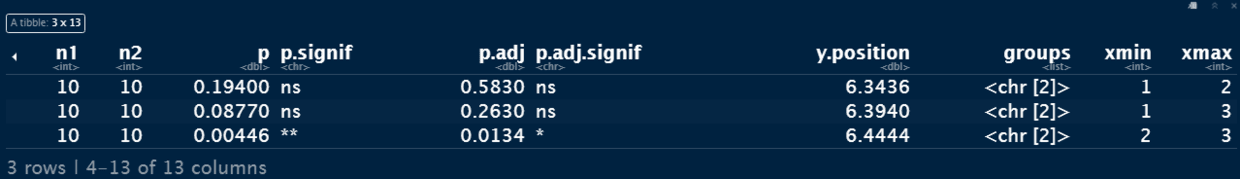
p值得坐标轴参数
pwc <- pwc %>% add_xy_position(x = "group")pwc
可视化
ggboxplot(PlantGrowth, x = "group", y = "weight") +stat_pvalue_manual(pwc, label = "p.adj", tip.length = 0, step.increase = 0.1) +labs(subtitle = get_test_label(res.aov, detailed = TRUE),caption = get_pwc_label(pwc))

Reference
参考文章如引起任何侵权问题,可以与我联系,谢谢。

若有收获,就点个赞吧
0 人点赞
