用法:
imshow3D ( Image )imshow3D ( Image , [] )imshow3D ( Image , [LOW HIGH] )imshow3D ( Image , [] , initsn )
Image: 3D image MxNxKxC (K slices of MxN images) C is either 1 for grayscale images) or 3 (for RGB images)
[LOW HIGH]: display range that controls the display intensity range of a grayscale image (default: the broadest available range)
initsn: The slice number to be displayed initially (default: mid-slice number)
initsn: 默认显示的截面序号
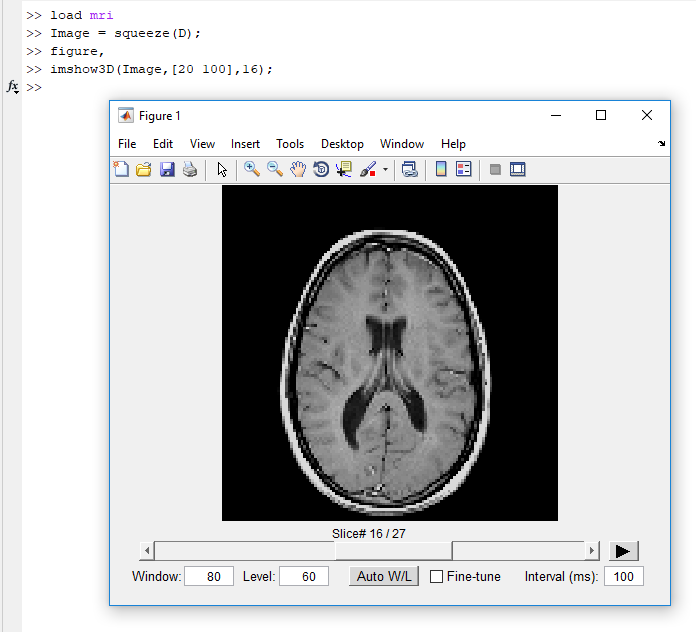
Use the scroll bar or mouse scroll wheel to switch between slices. To adjust window and level values keep the mouse right button pressed, and drag the mouse up and down (for level adjustment) or right and left (for window adjustment). Window and level adjustment control works only for grayscale images.
“Play” button displays all the slices as a sequence of frames. The time interval value can also be adjusted (default time interval is 100 ms).
“Auto W/L” button adjust the window and level automatically for grayscale images.
While “Fine Tune” checkbox is checked the window/level adjustment gets 16 times less sensitive to mouse movement, to make it easier to control
display intensity rang.
Note: The sensitivity of mouse-based window and level adjustment is set based on the user-defined display intensity range; the wider the range, the more sensitivity to mouse drag.
Note: IMSHOW3DFULL is a newer version of IMSHOW3D (also available on MathWorks) that displays 3D grayscale or RGB images from three perpendicular views (i.e., axial, sagittal, and coronal).
Example--------% To display an image (MRI example)load mriImage = squeeze(D);figure,imshow3D(Image)% To display the image, and adjust the display rangefigure,imshow3D(Image,[20 100]);% To define the initial slice numberfigure,imshow3D(Image,[],5);
Reference
https://www.mathworks.com/matlabcentral/fileexchange/41334-imshow3d

若有收获,就点个赞吧
0 人点赞
