Prometheus Server
官方下载页面https://prometheus.io/download/
wget https://github.com/prometheus/prometheus/releases/download/v2.17.1/prometheus-2.17.1.linux-amd64.tar.gztar xf prometheus-2.17.1.linux-amd64.tar.gz -C /usr/local/ln -s /usr/local/prometheus-2.17.1.linux-amd64.tar.gz /usr/local/prometheus
检查版本和测试启动
#检查版本
./prometheus --version
#测试启动
./prometheus --config.file=prometheus.yml
使用systemd管理
vim /usr/lib/systemd/system/prometheus.service
[Unit]
Description=Prometheus
Documentation=https://prometheus.io/
After=network.target

[Service]
# Type设置为notify时,服务会不断重启
Type=simple
User=prometheus
# --storage.tsdb.path是可选项,默认数据目录在运行目录的./dada目录中
ExecStart=/usr/local/prometheus/prometheus --config.file=/usr/local/prometheus/prometheus.yml --storage.tsdb.path=/var/lib/prometheus
Restart=on-failure

[Install]
WantedBy=multi-user.target
生效并启动
systemctl daemon-reload
systemctl enable prometheus && systemctl start prometheus
Grafana Server
官方下载页面https://grafana.com/grafana/download
这里直接使用rpm包安装
wget https://dl.grafana.com/oss/release/grafana-6.7.2-1.x86_64.rpm
yum localinstall grafana-6.7.2-1.x86_64.rpm
Grafana已经自带了数据库,直接启动即可
systemctl enable grafana-server
systemctl start grafana-server
使用IP:3000登入Grafana,初始账户密码admin/admin
添加Prometheus为数据源,需要注意以下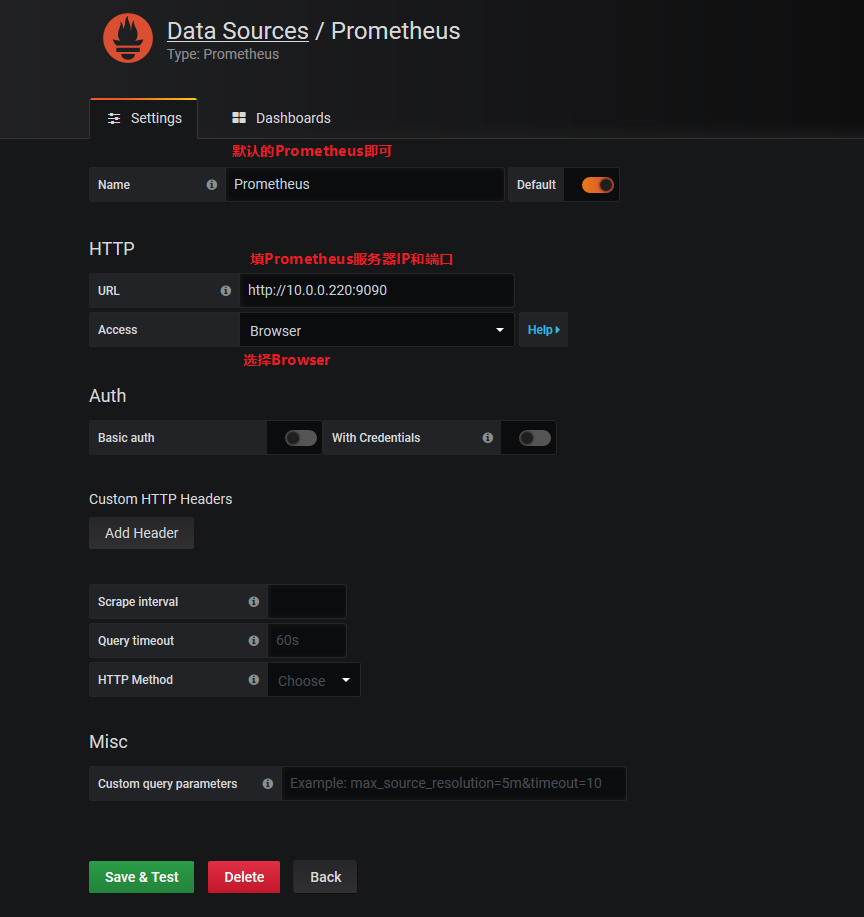
- Name: prometheus
- Type: Prometheus
- URL: http://localhost:9090
- Access: Browser
点击Dashboard导入模板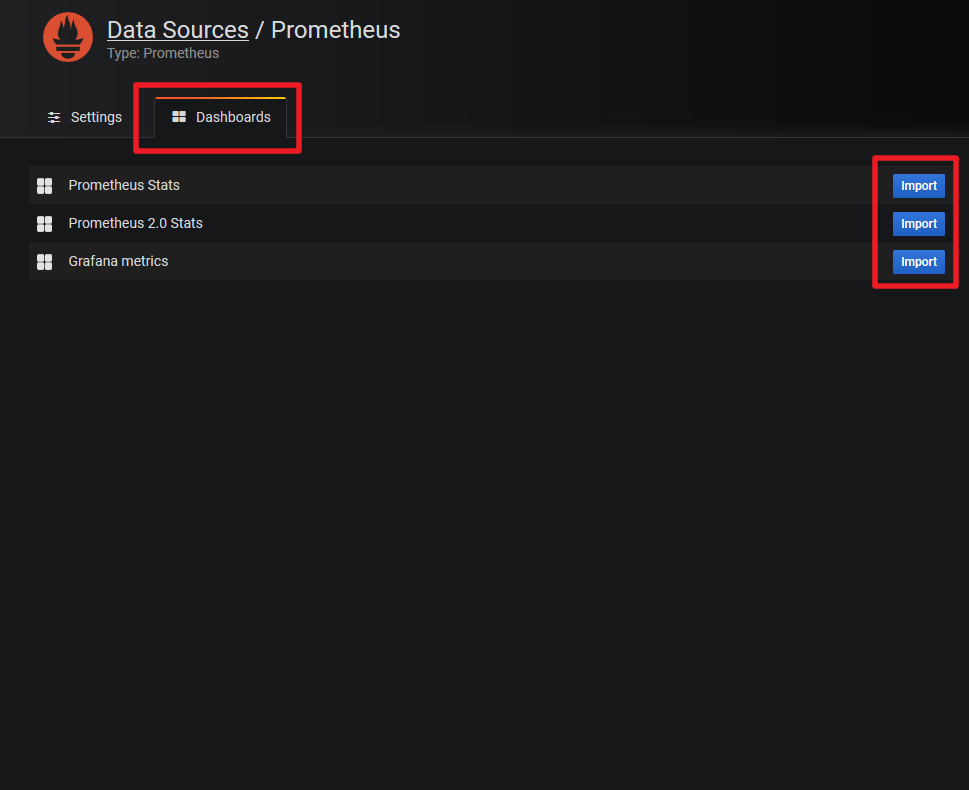
感谢

若有收获,就点个赞吧
0 人点赞
