配置文件
官方文档说明:https://prometheus.io/docs/prometheus/latest/configuration/configuration/
官方二进制下载包中默认的配置文件
# my global configglobal:scrape_interval: 15s # Set the scrape interval to every 15 seconds. Default is every 1 minute.evaluation_interval: 15s # Evaluate rules every 15 seconds. The default is every 1 minute.# scrape_timeout is set to the global default (10s).# Alertmanager configurationalerting:alertmanagers:- static_configs:- targets:# - alertmanager:9093# Load rules once and periodically evaluate them according to the global 'evaluation_interval'.rule_files:# - "first_rules.yml"# - "second_rules.yml"# A scrape configuration containing exactly one endpoint to scrape:# Here it's Prometheus itself.scrape_configs:# The job name is added as a label `job=<job_name>` to any timeseries scraped from this config.- job_name: 'prometheus'# metrics_path defaults to '/metrics'# scheme defaults to 'http'.static_configs:- targets: ['localhost:9090']
示例配置文件中有三个配置块:global,rule_files和scrape_configs。
全局块控制Prometheus服务器的全局配置。 1.scrape_interval,它控制Prometheus抓取目标的频率,全局设置是每15s抓取一次。 evaluation_interval选项控制Prometheus评估规则的频率。 Prometheus使用规则创建新的时间序列并生成警报。
rule_files块指定我们希望Prometheus服务器加载的任何规则的位置。
scrape_configs控制Prometheus监视的资源。 在默认配置中,有一个名为prometheus的作业,它会抓取Prometheus服务器公开的时间序列数据。 该作业包含一个静态配置的目标,即端口9090上的localhost。
配置语法
global:# 默认情况下抓取目标的频率.[ scrape_interval: <duration> | default = 1m ]# 抓取超时时间.[ scrape_timeout: <duration> | default = 10s ]# 评估规则的频率.[ evaluation_interval: <duration> | default = 1m ]# 与外部系统通信时添加到任何时间序列或警报的标签#(联合,远程存储,Alertma# nager).external_labels:[ <labelname>: <labelvalue> ... ]# 规则文件指定了一个globs列表.# 从所有匹配的文件中读取规则和警报.rule_files:[ - <filepath_glob> ... ]# 抓取配置列表.scrape_configs:[ - <scrape_config> ... ]# 警报指定与Alertmanager相关的设置.alerting:alert_relabel_configs:[ - <relabel_config> ... ]alertmanagers:[ - <alertmanager_config> ... ]# 与远程写入功能相关的设置.remote_write:[ - <remote_write> ... ]# 与远程读取功能相关的设置.remote_read:[ - <remote_read> ... ]
参数值说明
| 参数 | 含义 |
|---|---|
| 布尔值,true 或 false | |
| 持续时间,格式符合正则表达式 [0-9]+(ms|[smhdwy]) | |
| 标签名,格式符合正则表达式 [a-zA-Z][a-za-z0-9]* | |
| 标签值,可以包含任意 unicode 字符 | |
| 文件名,任意有效的文件路径 | |
| 主机,可以是主机名或 IP,后面可跟端口号 | |
| URL 路径 | |
| 协议,http 或 https | |
| 字符串 | |
| 密钥,比如密码 | |
| 模板字符串,里面包含需要展开的变量 |
global
全局配置节点下的配置对所有其它节点都有效,同时也是其它节点的默认值。
scrape_interval |
拉取 targets 的默认时间间隔,默认是1秒 |
|---|---|
scrape_timeout |
拉取一个 target 的超时时间,默认是10秒 |
evaluation_interval |
执行 rules 的时间间隔 |
external_labels |
额外的属性,会添加到拉取的数据并存到数据库中 |
规则配置rule_files
记录和警报规则存在于规则组中。 组内的规则以固定间隔顺序运行,规则语法是:
groups:[ - <rule_group> ]
一个简单的示例规则文件将是:
groups:- name: examplerules:- record: job:http_inprogress_requests:sumexpr: sum(http_inprogress_requests) by (job)
3.1 <rule_group>
# 组的名称。 在文件中必须是唯一的。name: <string># 评估组中的规则的频率。[ interval: <duration> | default = global.evaluation_interval ]rules:[ - <rule> ... ]
3.2 <rule>
记录规则的语法是:
# 要输出的时间序列的名称。 必须是有效的度量标准名称。record: <string># 要评估的PromQL表达式。 每个评估周期都会在当前时间进行评估,并将结果记录为一组新的时间序列,其中度量标准名称由“记录”给出。expr: <string># 在存储结果之前添加或覆盖的标签。labels:[ <labelname>: <labelvalue> ]
警报规则的语法是:
# 警报的名称。 必须是有效的度量标准名称。alert: <string># 要评估的PromQL表达式。 每个评估周期都会在当前时间进行评估,并且所有结果时间序列都会成为待处理/触发警报。expr: <string># 警报一旦被退回这段时间就会被视为开启。# 尚未解雇的警报被认为是未决的。[ for: <duration> | default = 0s ]# 为每个警报添加或覆盖的标签。labels:[ <labelname>: <tmpl_string> ]# 要添加到每个警报的注释。annotations:[ <labelname>: <tmpl_string> ]
抓取配置scrape_config
<scrape_config>部分指定一组描述如何获取它们的目标和参数。 在一般情况下,一个scrape配置指定单个作业。 在高级配置中,这可能会改变。
目标可以通过<static_configs>参数静态配置,也可以使用其中一种支持的服务发现机制动态发现。
此外,<relabel_configs>允许在抓取之前对任何目标及其标签进行高级修改。
其中<job_name>在所有scrape配置中必须是唯一的。
# 默认分配给已抓取指标的job名称。job_name: <job_name># 从job中抓取目标的频率.[ scrape_interval: <duration> | default = <global_config.scrape_interval> ]# 抓取此job时,每次抓取超时时间.[ scrape_timeout: <duration> | default = <global_config.scrape_timeout> ]# 从目标获取指标的HTTP资源路径.[ metrics_path: <path> | default = /metrics ]# honor_labels控制Prometheus如何处理已经存在于已抓取数据中的标签与Prometheus将附加服务器端的标签之间的冲突("job"和"instance"标签,手动配置的目标标签以及服务发现实现生成的标签)。## 如果honor_labels设置为"true",则通过保留已抓取数据的标签值并忽略冲突的服务器端标签来解决标签冲突。## 如果honor_labels设置为"false",则通过将已抓取数据中的冲突标签重命名为"exported_ <original-label>"(例如"exported_instance","exported_job")然后附加服务器端标签来解决标签冲突。 这对于联合等用例很有用,其中应保留目标中指定的所有标签。## 请注意,任何全局配置的"external_labels"都不受此设置的影响。 在与外部系统通信时,它们始终仅在时间序列尚未具有给定标签时应用,否则将被忽略。#[ honor_labels: <boolean> | default = false ]# 配置用于请求的协议方案.[ scheme: <scheme> | default = http ]# 可选的HTTP URL参数.params:[ <string>: [<string>, ...] ]# 使用配置的用户名和密码在每个scrape请求上设置`Authorization`标头。 password和password_file是互斥的。basic_auth:[ username: <string> ][ password: <secret> ][ password_file: <string> ]# 使用配置的承载令牌在每个scrape请求上设置`Authorization`标头。 它`bearer_token_file`和是互斥的。[ bearer_token: <secret> ]# 使用配置的承载令牌在每个scrape请求上设置`Authorization`标头。 它`bearer_token`和是互斥的。[ bearer_token_file: /path/to/bearer/token/file ]# 配置scrape请求的TLS设置.tls_config:[ <tls_config> ]# 可选的代理URL.[ proxy_url: <string> ]# Azure服务发现配置列表.azure_sd_configs:[ - <azure_sd_config> ... ]# Consul服务发现配置列表.consul_sd_configs:[ - <consul_sd_config> ... ]# DNS服务发现配置列表。dns_sd_configs:[ - <dns_sd_config> ... ]# EC2服务发现配置列表。ec2_sd_configs:[ - <ec2_sd_config> ... ]# OpenStack服务发现配置列表。openstack_sd_configs:[ - <openstack_sd_config> ... ]# 文件服务发现配置列表。file_sd_configs:[ - <file_sd_config> ... ]# GCE服务发现配置列表。gce_sd_configs:[ - <gce_sd_config> ... ]# Kubernetes服务发现配置列表。kubernetes_sd_configs:[ - <kubernetes_sd_config> ... ]# Marathon服务发现配置列表。marathon_sd_configs:[ - <marathon_sd_config> ... ]# AirBnB的神经服务发现配置列表。nerve_sd_configs:[ - <nerve_sd_config> ... ]# Zookeeper Serverset服务发现配置列表。serverset_sd_configs:[ - <serverset_sd_config> ... ]# Triton服务发现配置列表。triton_sd_configs:[ - <triton_sd_config> ... ]# 此job的标记静态配置目标列表。static_configs:[ - <static_config> ... ]# 目标重新标记配置列表。relabel_configs:[ - <relabel_config> ... ]# 度量标准重新配置列表。metric_relabel_configs:[ - <relabel_config> ... ]# 对每个将被接受的样本数量的每次抓取限制。# 如果在度量重新标记后存在超过此数量的样本,则整个抓取将被视为失败。 0表示没有限制。[ sample_limit: <int> | default = 0 ]
配置检查
Prometheus自带的的promtool命令行实用工具可以实现快速检查规则文件在语法上是否正确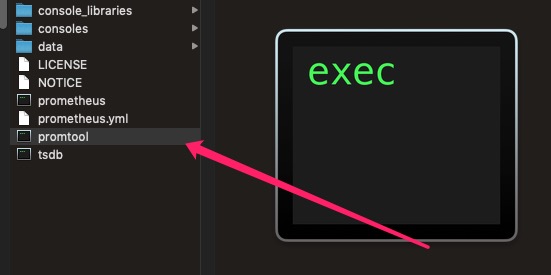
帮助文档如下
$ ./promtool -husage: promtool [<flags>] <command> [<args> ...]Tooling for the Prometheus monitoring system.Flags:-h, --help Show context-sensitive help (also try --help-long and --help-man).--version Show application version.Commands:help [<command>...]Show help.check config <config-files>...Check if the config files are valid or not.check rules <rule-files>...Check if the rule files are valid or not.check metricsPass Prometheus metrics over stdin to lint them for consistency and correctness.examples:$ cat metrics.prom | promtool check metrics$ curl -s http://localhost:9090/metrics | promtool check metricsquery instant <server> <expr>Run instant query.query range [<flags>] <server> <expr>Run range query.query series --match=MATCH [<flags>] <server>Run series query.query labels <server> <name>Run labels query.debug pprof <server>Fetch profiling debug information.debug metrics <server>Fetch metrics debug information.debug all <server>Fetch all debug information.test rules <test-rule-file>...Unit tests for rules.
$ ./promtool check config prometheus.ymlChecking prometheus.ymlSUCCESS: 0 rule files found$ ./promtool check rules prometheus.ymlChecking prometheus.ymlSUCCESS: 0 rules found
热加载
Prometheus配置信息的热加载有两种方式:
第一种热加载方式:查看Prometheus的进程id,发送SIGHUP信号:
kill -HUP <pid>
第二种热加载方式:发送一个POST请求到/-/reload,但是需要在启动时给定--web.enable-lifecycle选项:
curl -X POST http://localhost:9090/-/reload
如果配置热加载成功,Prometheus会打印出下面的log:
... msg="Loading configuration file" filename=prometheus.yml ...
我们使用的是第一种热加载方式,systemd unit文件如下:
[Unit]Description=prometheusAfter=network.target[Service]Type=simpleUser=prometheusExecStart=/usr/local/prometheus/prometheus \--config.file==/usr/local/prometheus/prometheus.yml \--storage.tsdb.path=/home/prometheus/data \--storage.tsdb.retention=365d \--web.listen-address=:9090 \--web.external-url=https://prometheus.frognew.comExecReload=/bin/kill -HUP $MAINPIDRestart=on-failure[Install]WantedBy=multi-user.target
在仅需要重新加载配置,而不需重启进程时,只需要运行systemctl reload prometheus即可。
参考
https://prometheus.io/docs/prometheus/latest/configuration/alerting_rules/

若有收获,就点个赞吧
0 人点赞
