安装
官方下载地址:https://prometheus.io/download/
Github下载地址:https://github.com/prometheus/prometheus/releases
二进制文件安装
根据宿主机的系统版本选择下载文件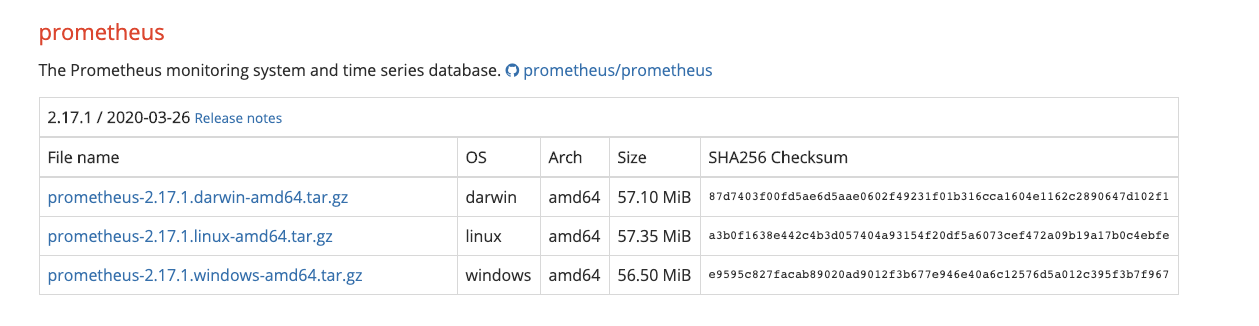
如果是Linux系统
$ wget https://github.com/prometheus/prometheus/releases/download/v2.21.0/prometheus-2.21.0.linux-amd64.tar.gz$ tar -zxvf prometheus-2.21.0.linux-amd64.tar.gz
如果是mac os 系统则选择darwin-amd64
$ wget https://github.com/prometheus/prometheus/releases/download/v2.17.1/prometheus-2.17.1.darwin-amd64.tar.gz$ tar -zxvf prometheus-2.17.1.darwin-amd64.tar.gz -C ./$ cd prometheus-2.17.1.darwin-amd64$ tree.├── LICENSE├── NOTICE├── console_libraries│ ├── menu.lib│ └── prom.lib├── consoles│ ├── index.html.example│ ├── node-cpu.html│ ├── node-disk.html│ ├── node-overview.html│ ├── node.html│ ├── prometheus-overview.html│ └── prometheus.html├── prometheus├── prometheus.yml├── promtool└── tsdb2 directories, 15 files
Docker安装
dockerhub 地址:https://hub.docker.com/r/prom/prometheus/,执行下面的docker命令,然后通过 http://localhost:9090/ 来访问容器内的 Prometheus 服务
$ docker run --name prometheus -d -p 127.0.0.1:9090:9090 prom/prometheus
官方Dockfile文件:https://github.com/prometheus/prometheus/blob/master/Dockerfile
增加配置文件本地路径
docker run \-p 9090:9090 \-v /tmp/prometheus.yml:/etc/prometheus/prometheus.yml \prom/prometheus
源码安装
$ mkdir -p $GOPATH/src/github.com/prometheus$ cd $GOPATH/src/github.com/prometheus$ git clone https://github.com/prometheus/prometheus.git$ cd prometheus$ make build$ ./prometheus -config.file=your_config.yml
启动参数
帮助文档
$ ./prometheus -husage: prometheus [<flags>]The Prometheus monitoring serverFlags:-h, --help Show context-sensitive help (also try --help-long and --help-man).--version Show application version.--config.file="prometheus.yml"Prometheus configuration file path.--web.listen-address="0.0.0.0:9090"Address to listen on for UI, API, and telemetry.--web.read-timeout=5m Maximum duration before timing out read of the request, and closing idle connections.--web.max-connections=512 Maximum number of simultaneous connections.--web.external-url=<URL> The URL under which Prometheus is externally reachable (for example, if Prometheus is served via areverse proxy). Used for generating relative and absolute links back to Prometheus itself. If the URLhas a path portion, it will be used to prefix all HTTP endpoints served by Prometheus. If omitted,relevant URL components will be derived automatically.--web.route-prefix=<path> Prefix for the internal routes of web endpoints. Defaults to path of --web.external-url.--web.user-assets=<path> Path to static asset directory, available at /user.--web.enable-lifecycle Enable shutdown and reload via HTTP request.--web.enable-admin-api Enable API endpoints for admin control actions.--web.console.templates="consoles"Path to the console template directory, available at /consoles.--web.console.libraries="console_libraries"Path to the console library directory.--web.page-title="Prometheus Time Series Collection and Processing Server"Document title of Prometheus instance.--web.cors.origin=".*" Regex for CORS origin. It is fully anchored. Example: 'https?://(domain1|domain2)\.com'--storage.tsdb.path="data/"Base path for metrics storage.--storage.tsdb.retention=STORAGE.TSDB.RETENTION[DEPRECATED] How long to retain samples in storage. This flag has been deprecated, use"storage.tsdb.retention.time" instead.--storage.tsdb.retention.time=STORAGE.TSDB.RETENTION.TIMEHow long to retain samples in storage. When this flag is set it overrides "storage.tsdb.retention". Ifneither this flag nor "storage.tsdb.retention" nor "storage.tsdb.retention.size" is set, the retentiontime defaults to 15d. Units Supported: y, w, d, h, m, s, ms.--storage.tsdb.retention.size=STORAGE.TSDB.RETENTION.SIZE[EXPERIMENTAL] Maximum number of bytes that can be stored for blocks. Units supported: KB, MB, GB, TB,PB. This flag is experimental and can be changed in future releases.--storage.tsdb.no-lockfileDo not create lockfile in data directory.--storage.tsdb.allow-overlapping-blocks[EXPERIMENTAL] Allow overlapping blocks, which in turn enables vertical compaction and vertical querymerge.--storage.tsdb.wal-compressionCompress the tsdb WAL.--storage.remote.flush-deadline=<duration>How long to wait flushing sample on shutdown or config reload.--storage.remote.read-sample-limit=5e7Maximum overall number of samples to return via the remote read interface, in a single query. 0 means nolimit. This limit is ignored for streamed response types.--storage.remote.read-concurrent-limit=10Maximum number of concurrent remote read calls. 0 means no limit.--storage.remote.read-max-bytes-in-frame=1048576Maximum number of bytes in a single frame for streaming remote read response types before marshalling.Note that client might have limit on frame size as well. 1MB as recommended by protobuf by default.--rules.alert.for-outage-tolerance=1hMax time to tolerate prometheus outage for restoring "for" state of alert.--rules.alert.for-grace-period=10mMinimum duration between alert and restored "for" state. This is maintained only for alerts withconfigured "for" time greater than grace period.--rules.alert.resend-delay=1mMinimum amount of time to wait before resending an alert to Alertmanager.--alertmanager.notification-queue-capacity=10000The capacity of the queue for pending Alertmanager notifications.--alertmanager.timeout=10sTimeout for sending alerts to Alertmanager.--query.lookback-delta=5m The maximum lookback duration for retrieving metrics during expression evaluations and federation.--query.timeout=2m Maximum time a query may take before being aborted.--query.max-concurrency=20Maximum number of queries executed concurrently.--query.max-samples=50000000Maximum number of samples a single query can load into memory. Note that queries will fail if they tryto load more samples than this into memory, so this also limits the number of samples a query canreturn.--log.level=info Only log messages with the given severity or above. One of: [debug, info, warn, error]--log.format=logfmt Output format of log messages. One of: [logfmt, json]
数据存储
默认的存储路径为data/,通过参数--storage.tsdb.path="data/"修改本地数据存储的路径。
mkdir -p data
配置文件
当前通过二进制压缩文件安装在 解压完成的目录会包含默认的Prometheus配置文件promethes.yml,
$ ls -ltotal 161140drwxr-xr-x 2 ubuntu ubuntu 4096 Sep 11 21:29 console_librariesdrwxr-xr-x 2 ubuntu ubuntu 4096 Sep 11 21:29 consoles-rw-r--r-- 1 ubuntu ubuntu 11357 Sep 11 21:29 LICENSE-rw-r--r-- 1 ubuntu ubuntu 3420 Sep 11 21:29 NOTICE-rwxr-xr-x 1 ubuntu ubuntu 88471209 Sep 11 19:37 prometheus-rw-r--r-- 1 ubuntu ubuntu 926 Sep 11 21:29 prometheus.yml-rwxr-xr-x 1 ubuntu ubuntu 76493104 Sep 11 19:39 promtool
加载自定义的配置文件路径
./prometheus --config.file=启动配置文件.yml
默认启动
启动prometheus服务,其会默认加载当前路径下的prometheus.yaml文件
$ ./prometheus
启动信息
level=info ts=2020-10-11T06:36:14.389Z caller=main.go:310 msg="No time or size retention was set so using the default time retention" duration=15dlevel=info ts=2020-10-11T06:36:14.389Z caller=main.go:346 msg="Starting Prometheus" version="(version=2.21.0, branch=HEAD, revision=e83ef207b6c2398919b69cd87d2693cfc2fb4127)"level=info ts=2020-10-11T06:36:14.389Z caller=main.go:347 build_context="(go=go1.15.2, user=root@a4d9bea8479e, date=20200911-11:35:02)"level=info ts=2020-10-11T06:36:14.389Z caller=main.go:348 host_details="(Linux 4.15.0-54-generic #58-Ubuntu SMP Mon Jun 24 10:55:24 UTC 2019 x86_64 VM-0-2-ubuntu (none))"level=info ts=2020-10-11T06:36:14.389Z caller=main.go:349 fd_limits="(soft=1024, hard=1048576)"level=info ts=2020-10-11T06:36:14.389Z caller=main.go:350 vm_limits="(soft=unlimited, hard=unlimited)"level=info ts=2020-10-11T06:36:14.396Z caller=main.go:701 msg="Starting TSDB ..."level=info ts=2020-10-11T06:36:14.397Z caller=web.go:523 component=web msg="Start listening for connections" address=0.0.0.0:9090level=info ts=2020-10-11T06:36:14.402Z caller=head.go:644 component=tsdb msg="Replaying on-disk memory mappable chunks if any"level=info ts=2020-10-11T06:36:14.402Z caller=head.go:658 component=tsdb msg="On-disk memory mappable chunks replay completed" duration=4.345µslevel=info ts=2020-10-11T06:36:14.403Z caller=head.go:664 component=tsdb msg="Replaying WAL, this may take a while"level=info ts=2020-10-11T06:36:14.403Z caller=head.go:716 component=tsdb msg="WAL segment loaded" segment=0 maxSegment=0level=info ts=2020-10-11T06:36:14.403Z caller=head.go:719 component=tsdb msg="WAL replay completed" checkpoint_replay_duration=32.293µs wal_replay_duration=194.417µs total_replay_duration=277.95µslevel=info ts=2020-10-11T06:36:14.404Z caller=main.go:721 fs_type=EXT4_SUPER_MAGIClevel=info ts=2020-10-11T06:36:14.404Z caller=main.go:724 msg="TSDB started"level=info ts=2020-10-11T06:36:14.404Z caller=main.go:850 msg="Loading configuration file" filename=prometheus.ymllevel=info ts=2020-10-11T06:36:14.409Z caller=main.go:881 msg="Completed loading of configuration file" filename=prometheus.yml totalDuration=4.560441ms remote_storage=2.148µs web_handler=676ns query_engine=1.153µs scrape=2.568956ms scrape_sd=36.388µs notify=1.581758ms notify_sd=47.157µs rules=1.829µslevel=info ts=2020-10-11T06:36:14.409Z caller=main.go:673 msg="Server is ready to receive web requests."
Expression Browser
Prometheus的-web.listen-address=监听的就是PromQL浏览器的地址,例如:-web.listen-address=:9090,就以http://serverip:9090/graph访问PromQL浏览器。
启动完成后,如果是本地自检环境可以通过 http://localhost:9090/graph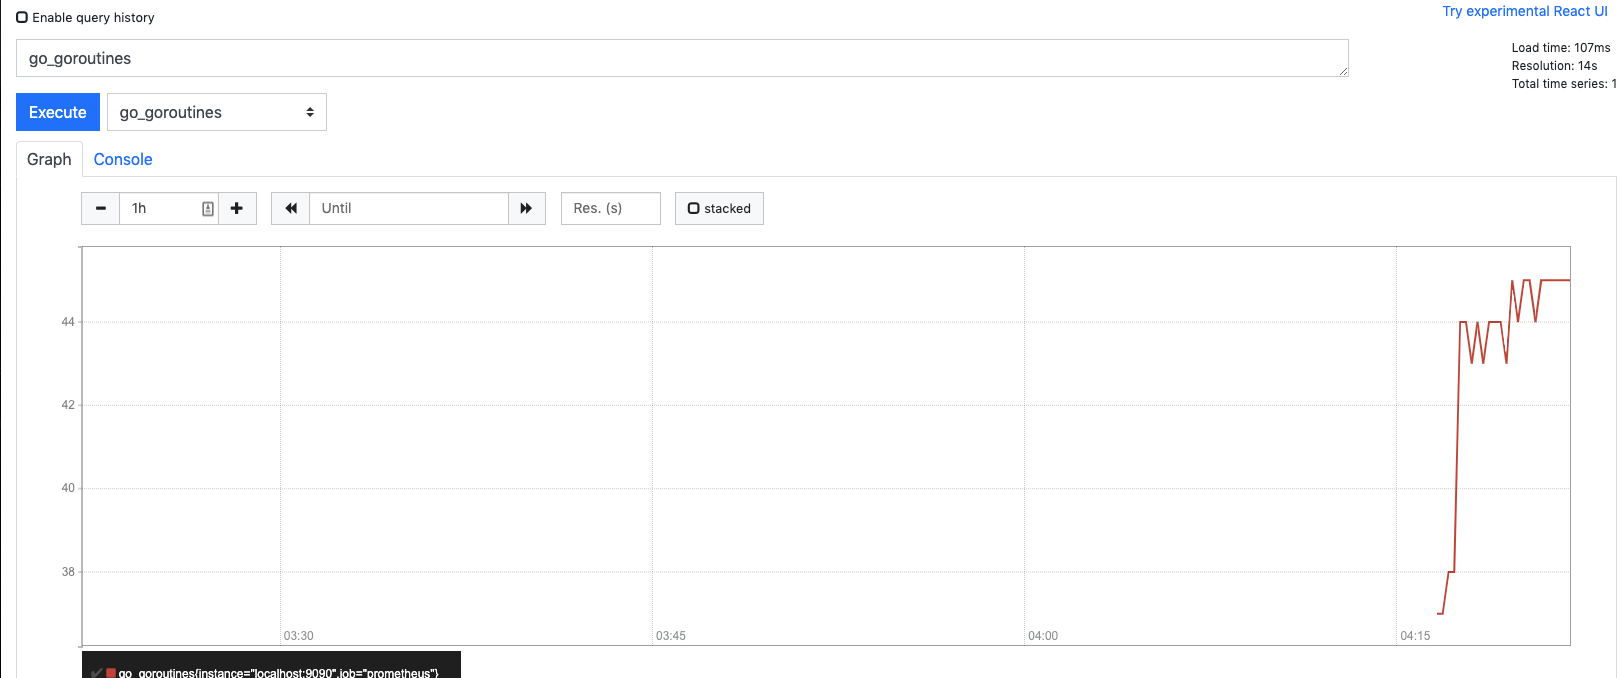
http://localhost:9090/metrics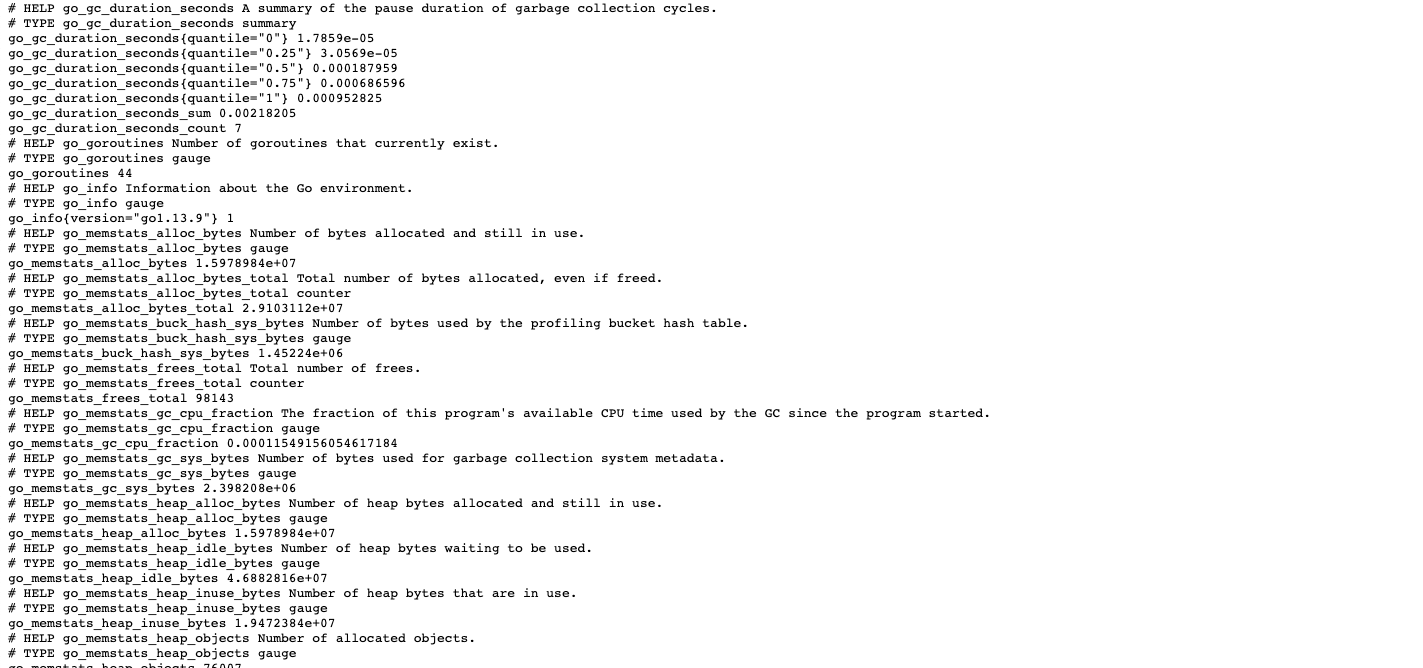
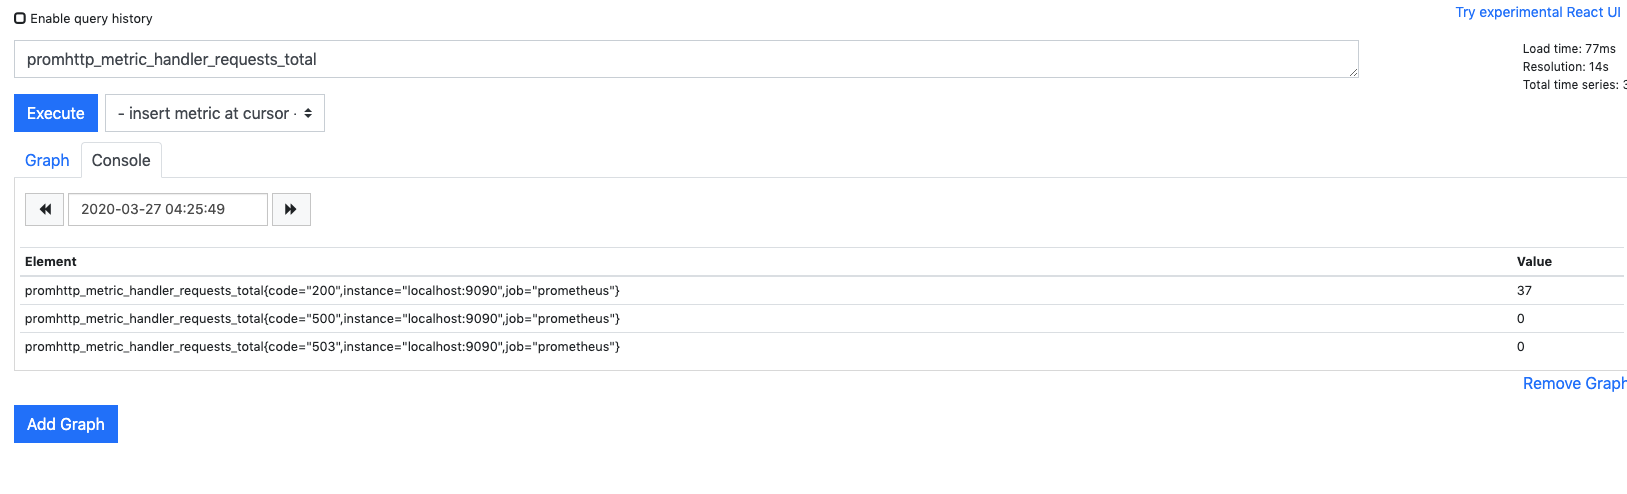
其输入表达式控制台:
promhttp_metric_handler_requests_total
部署优化
远端存储
prometheus默认是将监控数据保存在本地磁盘中的,当然在分布式架构环境下,这样是不太可取的。不过它支持远端存储,可与远端存储系统集成。
Prometheus integrates with remote storage systems in two ways:
- Prometheus can write samples that it ingests to a remote URL in a standardized format.
- Prometheus can read (back) sample data from a remote URL in a standardized format.

目前支持的远端存储系统如下:
The remote write and remote read features of Prometheus allow transparently sending and receiving samples. This is primarily intended for long term storage. It is recommended that you perform careful evaluation of any solution in this space to confirm it can handle your data volumes.
- AppOptics: write
- Chronix: write
- Cortex: read and write
- CrateDB: read and write
- Elasticsearch: write
- Gnocchi: write
- Graphite: write
- InfluxDB: read and write
- IRONdb: read and write
- M3DB: read and write
- OpenTSDB: write
- PostgreSQL/TimescaleDB: read and write
- SignalFx: write
联邦模式
如果prometheus仅能够中心化地进行数据采集存储、分析,不支持集群模式,带来的性能问题显而易见。Prometheus给出了一种联邦的部署方式,就是Prometheus server可以从其他的Prometheus server采集数据,实施步骤直接参考官方文档。参考

若有收获,就点个赞吧
0 人点赞
