利用inferCNV分析单细胞数据的CNV信息
在使用inferCNV之前需要安装JAGS软件,下载地址:https://sourceforge.net/projects/mcmc-jags/files/JAGS/4.x/
##包的安装install.packages("rjags")BiocManager::install("infercnv")
处理逻辑:
数据要求:
- a raw counts matrix of single-cell RNA-Seq expression
- an annotations file which indicates which cells are tumor vs. normal.
- a gene/chromosome positions file
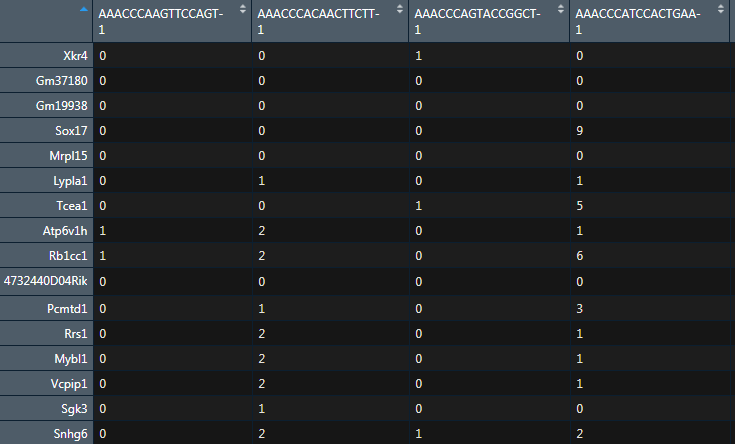
Raw Counts Matrix for Genes x Cells
基因和细胞的原始数据表达矩阵
能够适用 smart-seq2 and 10x single cell transcriptome data
从seurat中获取基因和细胞的表达谱矩阵。行名是基因,列名是细胞编号。
sc <- readRDS("single_seruat.Rds")exp <- as.data.frame(GetAssayData(sc, assay = "RNA", slot = "counts"))
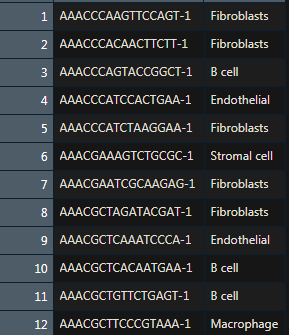
Sample annotation file
The sample annotation file is used to define the different cell types, and optionally, indicating how the cells should be grouped according to sample (ie. patient). The format is simply two columns, tab-delimited, and there is no column header.
注释文件,记录了对应细胞的分组,两列信息,没有表头,一列代表细胞的名字,一列代表了细胞的分组
ann <- as.data.frame(FetchData(object = sc,vars = c("ident"))) %>% rownames_to_column(var="cell")
Gene ordering file
The gene ordering file provides the chromosomal location for each gene.
基因在染色提上的位置信息,四列,无表头,需要排序,基因名无重复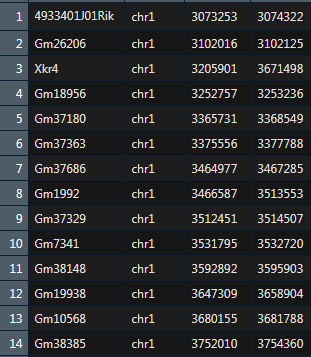
创建inferCNV对象
在获得三种格式的表格后,创建inferCNV对象
需要将文件写到txt的,再进行读取
infercnv_obj <- CreateInfercnvObject(raw_counts_matrix ="exp.txt",annotations_file = "anno.txt",delim = "\t",gene_order_file = "order_gene.txt",ref_group_name=NULL)
关键参数是ref_group_name, 用于设置参考组。假如你并不知道哪个组是正常,哪个组不正常,那么设置为ref_group_name=NULL, 那么inferCNV会以全局平均值作为基线,这适用于有足够细胞存在差异的情况。
**
标准分析流程
infercnv_obj = infercnv::run(infercnv_obj,cutoff=0.1, # use 1 for smart-seq, 0.1 for 10x-genomicsout_dir="./", # 输出文件夹cluster_by_groups=T, # 聚类denoise=T, #去噪HMM=T) # 是否基于HMM预测CNV
- 基本设置
- 平滑参数
- 基于肿瘤亚群的下游分析(HMM或non-DE-masking)
- 根据 BayesNet P(Normal) 过滤低可信度HMM预测结果
- 肿瘤亚群细分
- 去噪参数
- 离群值修剪
- 其他选项
- 实验性参数(不稳定)
- 差异表达分析的实验性参数
结果
主要的结果:
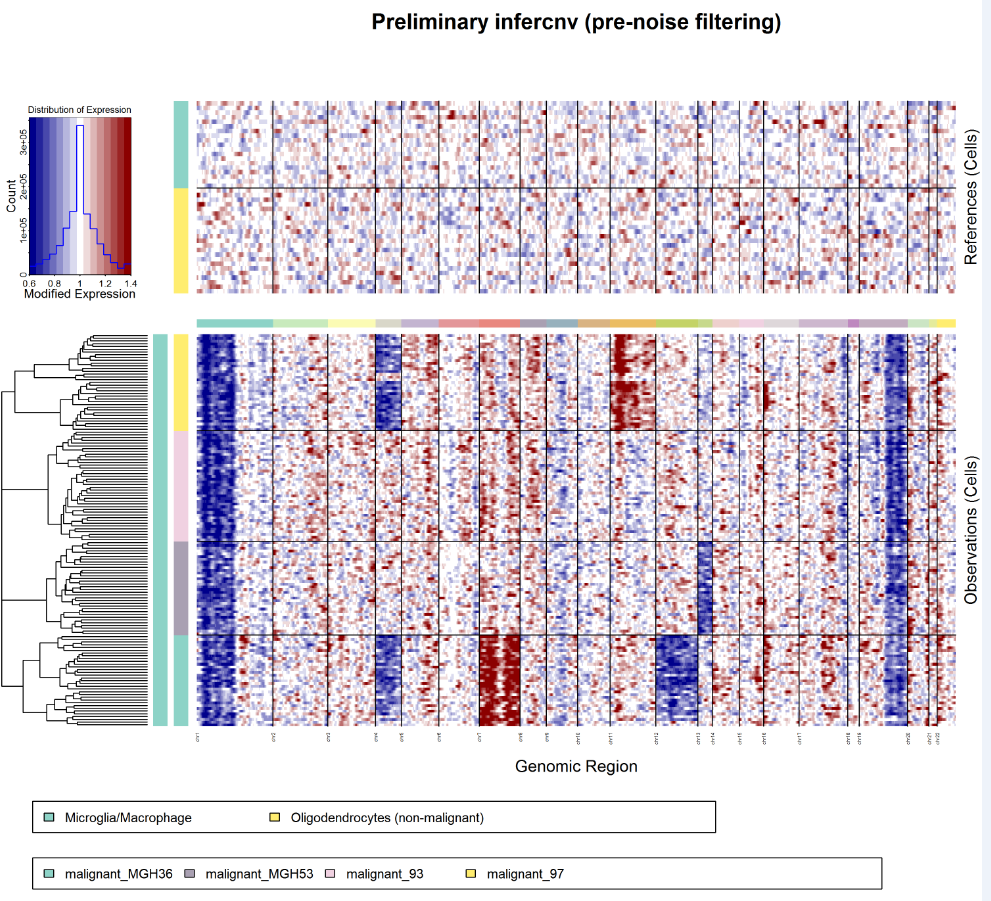
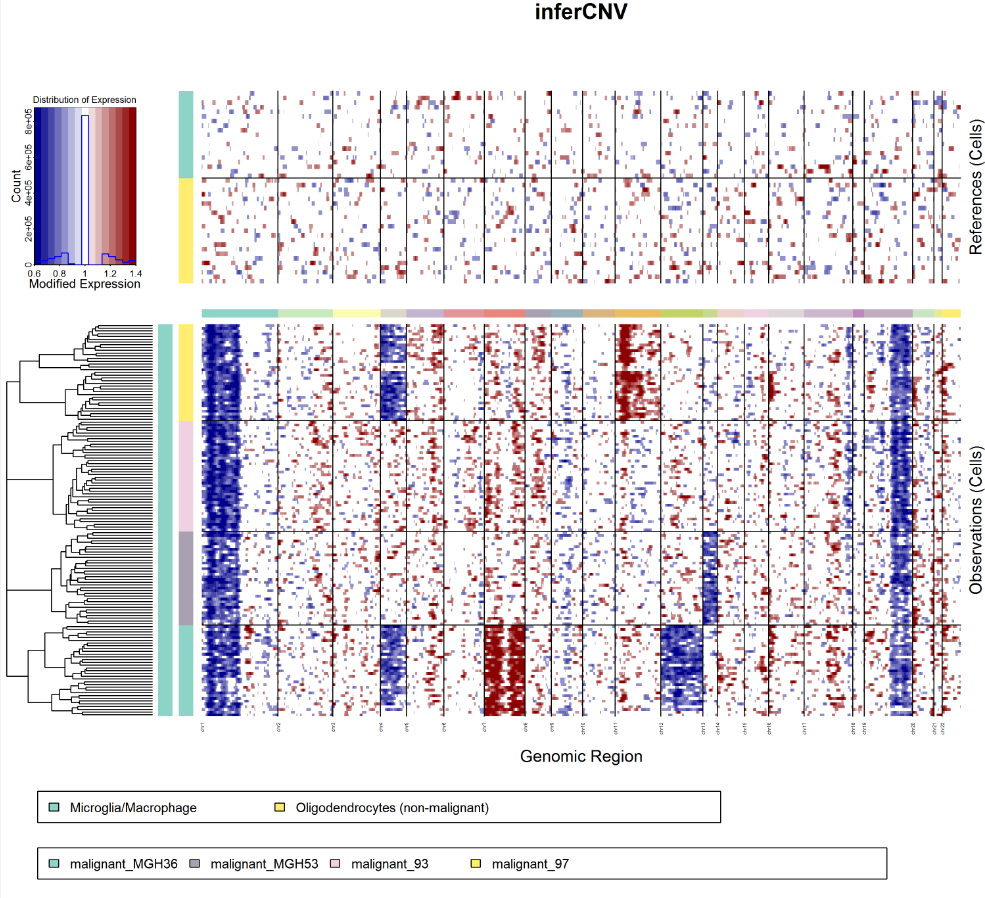
- infercnv.preliminary.png : 初步的inferCNV展示结果(未经去噪或HMM预测)
- infercnv.png : 最终inferCNV产生的去噪后的热图.
- infercnv.references.txt : 正常细胞矩阵.
- infercnv.observations.txt : 肿瘤细胞矩阵.
- infercnv.observation_groupings.txt : 肿瘤细胞聚类后的分组关系.
- infercnv.observations_dendrogram.txt : 与热图匹配的肿瘤细胞的newick格式的树状图
正常细胞的表达值绘制在顶部热图中,肿瘤细胞绘制在底部热图中
基因在整个染色体上从左到右排列。
有效地从肿瘤细胞表达数据中减去正常细胞表达数据以产生差异
其中染色体区域扩增显示为红色块,而染色体区域缺失显示为蓝色块
参考:
使用inferCNV分析单细胞转录组中拷贝数变异https://blog.csdn.net/u012110870/article/details/103200325

若有收获,就点个赞吧
0 人点赞
