4.1 导读
数据统计,大部分功能包括一下:
- 细胞比例分析
- 细胞比例异质性分析
- 分组之间差异分析
- 基因表达异质性分析
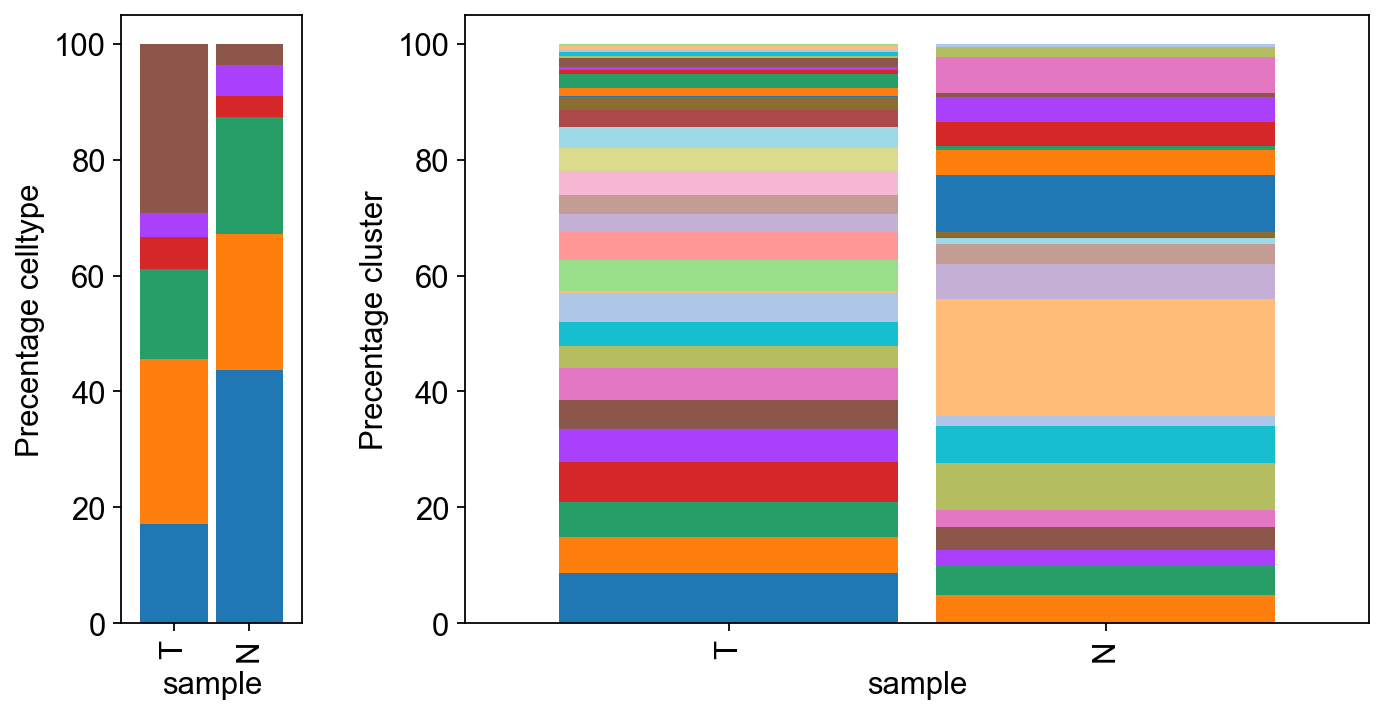
4.2 细胞比例分析
- 统计各个样本之间
cluster以及cell type变化 ```python fig, axes = plt.subplots(1, 2 ,figsize=(10,5) , gridspec_kw={‘width_ratios’: [1, 5 ], ‘wspace’: 0.3}) list_conditions = [“T”,”N”] temp = adata_all.obs.groupby( [‘sample’,’cell_type’]).size().groupby(level=0).apply(lambda x: 100 x / float(x.sum())).unstack() temp.loc[list_conditions].plot(kind=’bar’, stacked=True, width=0.9, ax=axes[0] ) axes[0].grid(None) axes[0].get_legend().remove() axes[0].set_ylabel(‘Precentage celltype’) mask = adata_all.obs[‘sample’].isin(list_conditions) temp = adata_all[mask].obs.groupby( [‘sample’,’louvain_2’]).size().groupby(level=0).apply(lambda x: 100 x / float(x.sum())).unstack() temp.plot(kind=’bar’, stacked=True, ax=axes[1], width=0.9 )
axes[1].grid(None) axes[1].legend(loc=’upper right’, bbox_to_anchor=(1.5, 1), frameon=False)#, labels=[‘celltype’+x for x in adata_sub.obs[‘louvain’].unique() ]) axes[1].get_legend().remove() axes[1].set_ylabel(‘Precentage cluster’)
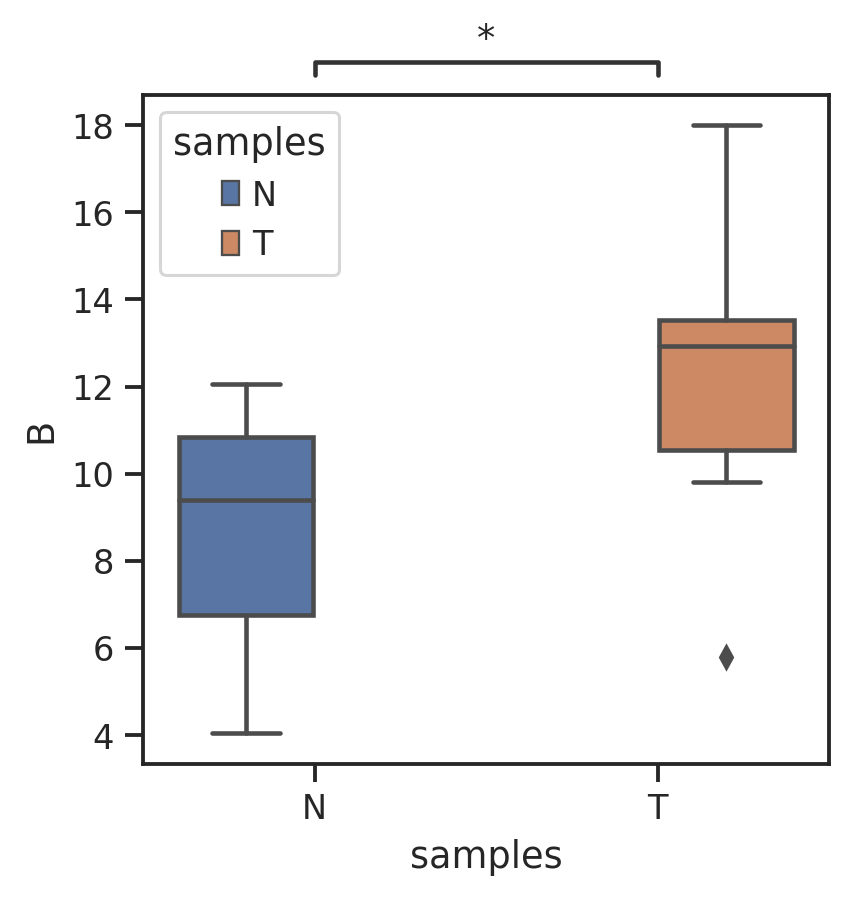
> 示例样本没有分组信息,如果有分组信息可以统计多个维度的数据。- 细胞比例异质性分析> 样本之间某一类细胞比例差异,如:`T``N`样本之间`B细胞`差异。由于每个样本只有一个数据,无法直接通过分组算`p-value`。由别的数据代替,请悉知。```pythonsns.set_style("ticks")x = "samples"y_list = "B"order = ['N', 'T']x_num = 0y_num = 0ax = sns.boxplot(data=temp2, x=x, y=y_list, order=order,hue=x,)add_stat_annotation(ax, data=temp2, x=x, y=y_list, order=order,box_pairs=[("N", "T")],test='Wilcoxon', text_format='star', loc='inside', verbose=3)
同理 分组也是类似方法画图
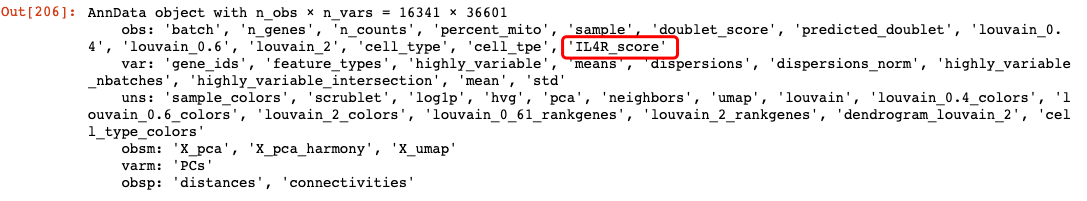
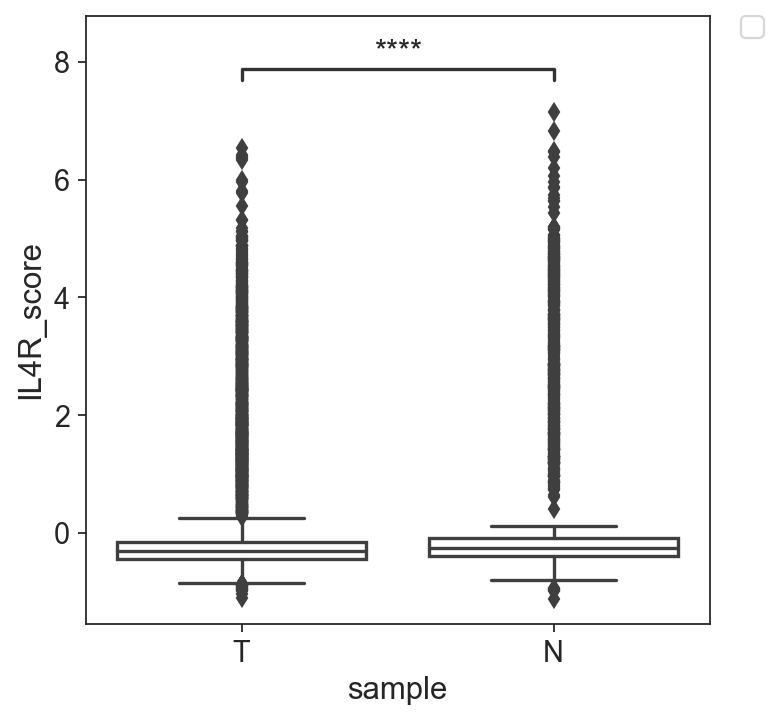
- 基因表达异质性
计算每个细胞中基因的表达分数 如:
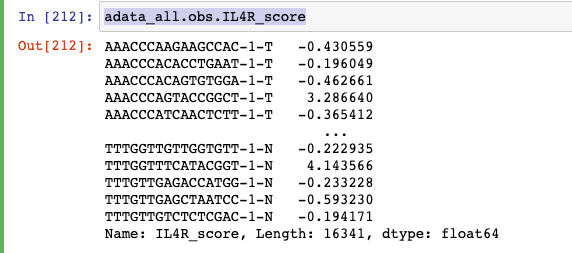
IL4R基因
sc.tl.score_genes(adata_all,gene_list=["IL4R"],score_name="IL4R_score")adata_all.obs.IL4R_score
sns.set_style("ticks")f = plt.figure(figsize=(10, 6))x = "sample"order = ['T', 'N']ax = sns.boxplot(data=adata_all.obs, x=x, y='IL4R_score', order=order)add_stat_annotation(ax, data=adata_all.obs, x=x, y='IL4R_score', order=order,box_pairs=[("T", "N")],test='t-test_ind', text_format='star', loc='inside', verbose=3)ax.tick_params(axis='both', labelsize=13)plt.setp(ax.artists,fill=False)handles, labels = ax.get_legend_handles_labels()legend1 = plt.legend(handles[0:3], order,bbox_to_anchor=(1.05, 1),loc=2, borderaxespad=0.)plt.setp(plt.gca().get_legend().get_texts(), fontsize='12')f.set_size_inches(10,7)
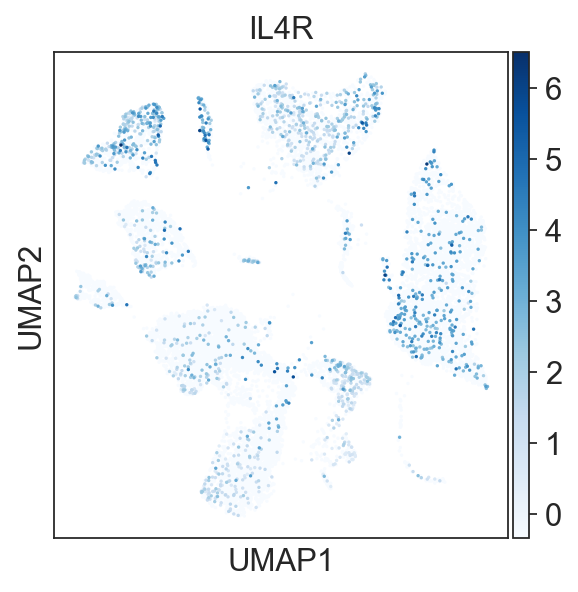
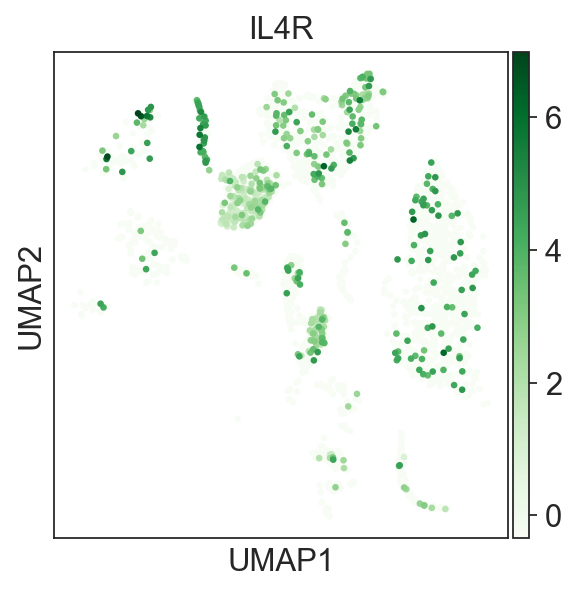
- 基因表达分析
某一个基因在 某一类细胞 中的表达情况。如:
IL4R在每个样本中的表达统计图。
sc.pl.umap(adata_all[adata_all.obs["sample"].isin(["T"])], color=['IL4R'], color_map="Blues")sc.pl.umap(adata_all[adata_all.obs["sample"].isin(["N"])], color=['IL4R'], color_map="Greens")
该示例中既有提取数据案例,也有图示例子。


若有收获,就点个赞吧
0 人点赞
