1.安装 matplotlib
sudo pip3 install matplotlib
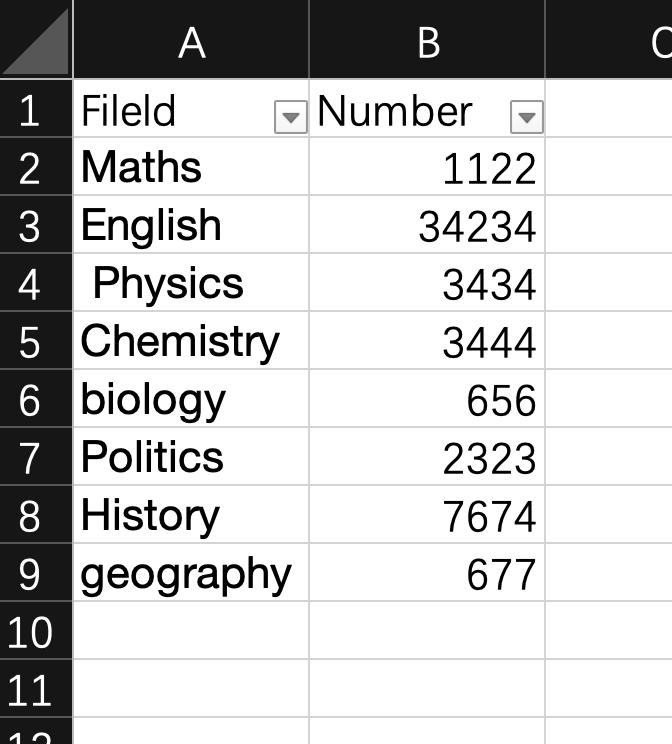
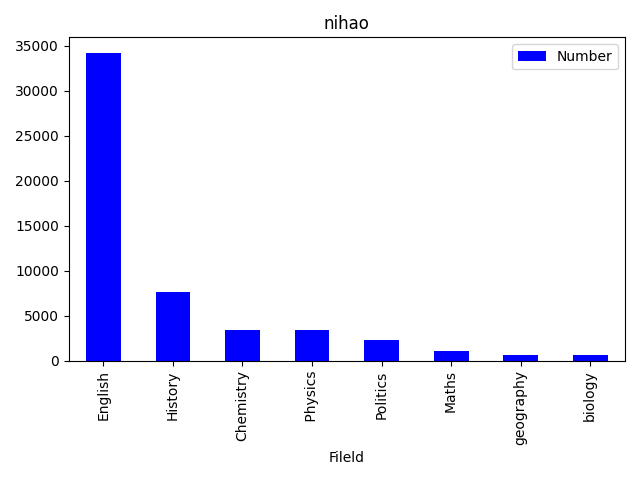
使用pandas绘图
import pandas as pdimport matplotlib.pyplot as pltstudents = pd.read_excel('./fileld.xlsx')students.sort_values(by='Number', inplace=True, ascending=False)students.plot.bar(x='Fileld', y='Number', color='blue', title='nihao')plt.tight_layout()plt.savefig('1.png', dpi=100)plt.show()
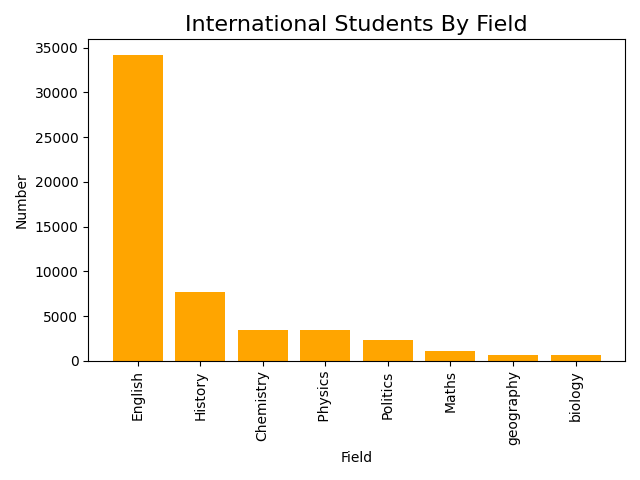
使用 matplotlib 绘图
import pandas as pdimport matplotlib.pyplot as pltstudents = pd.read_excel('./Field.xlsx')# 数据排序students.sort_values(by='Number', inplace=True, ascending=False)# matplotlib 绘图plt.bar(students.Field, students.Number, color='orange')# 设置横坐标文字和方向plt.xticks(students.Field, rotation='90')# 设置横坐标名称plt.xlabel('Field')# 设置纵坐标名称plt.ylabel('Number')# 设置表头plt.title('International Students By Field', fontsize=16)# 设置为紧凑型布局plt.tight_layout()# 保存图片plt.savefig('1.png', dpi=100)# 开始绘制plt.show()

若有收获,就点个赞吧
0 人点赞
