1. 简介
Matplotlib is a Python 2D plotting library which produces publication quality figures in a variety of hardcopy formats and interactive environments across platforms. Matplotlib can be used in Python scripts, the Python and IPython shells, the Jupyter notebook, web application servers, and four graphical user interface toolkits-- [https://matplotlib.org/3.0.3/index.html](https://matplotlib.org/3.0.3/index.html)
2. 基本概念
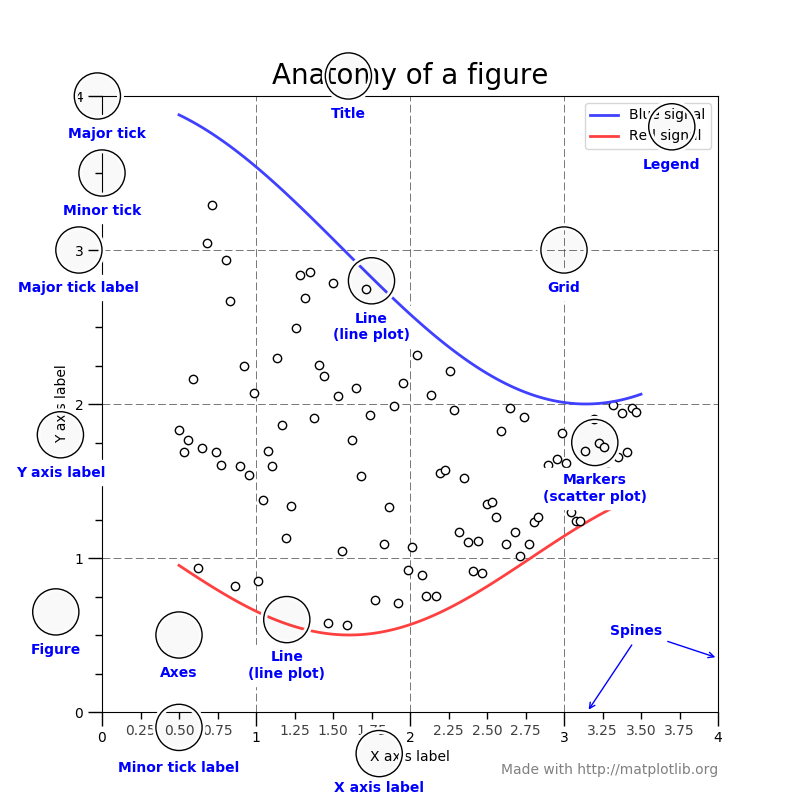 Figure Parts of a Figure
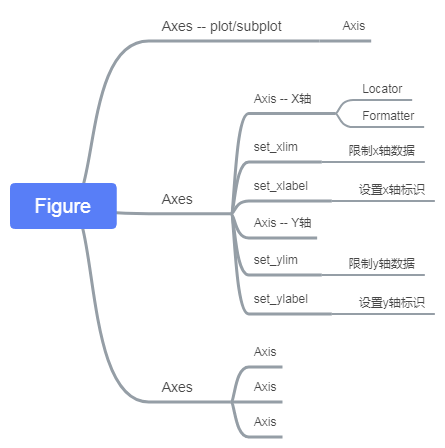
Matplotlib 将整个构图元素分为:Figure , Axes , Axis 以及 Artist 。
Artist 是所有画图的元素(even the Figure, Axes, and Axis objects)。
Artist includes
Textobjects,Line2Dobjects,collectionobjects,Patchobjects … (you get the idea). When the figure is rendered, all of the artists are drawn to the canvas. Most Artists are tied to an Axes; such an Artist cannot be shared by multiple Axes, or moved from one to another.
画图输入:All of plotting functions expect np.array or np.ma.masked_array as input.
Pandas 数据转换请访问https://matplotlib.org/3.0.3/tutorials/introductory/usage.html#types-of-inputs-to-plotting-functions
3. Matplotlib的backend
3.1 backend的分类
matplotlib中,frontend就是我们写的python代码,而backend就是负责显示我们代码所写图形的底层代码。因为不同使用环境下硬件情况不同,所以后端是跟具体的硬件和显示条件相关的。backend又分为两类,一类是interface backend,又叫做interactive backend,这一类是表示跟显示到屏幕相关的后端;另一类是hardcopy backend,又叫做non-interactive backend,这一类是写入到文件相关的后端。下面两图分别是non-interactive backend和interactive backend的[具体值](https://matplotlib.org/3.0.3/tutorials/introductory/usage.html#backends):
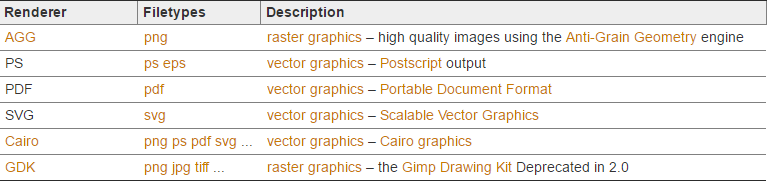
Figure non-interactive backend
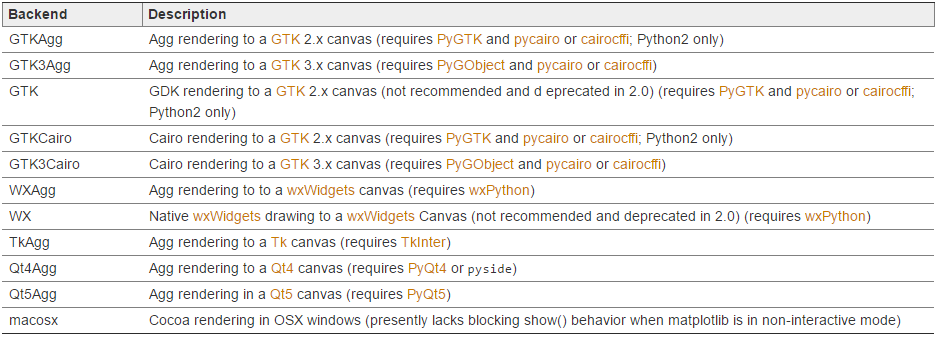 Figure interactive backend
查询当前环境支持的backend方法:
>>> import matplotlib>>> matplotlib.rcsetup.interactive_bk['GTK3Agg', 'GTK3Cairo', 'MacOSX', 'nbAgg', 'Qt4Agg', 'Qt4Cairo', 'Qt5Agg', 'Qt5Cairo', 'TkAgg', 'TkCairo', 'WebAgg', 'WX', 'WXAgg', 'WXCairo']>>> matplotlib.rcsetup.non_interactive_bk['agg', 'cairo', 'pdf', 'pgf', 'ps', 'svg', 'template']
3.2 设置backend的方法
matplotlib的默认配置文件获取方法:
>>> import matplotlib>>> matplotlib.matplotlib_fname()'/usr/lib/python3.6/site-packages/matplotlib-3.0.2-py3.6-cygwin-2.11.2-x86_64.egg/matplotlib/mpl-data/matplotlibrc'
或通过如下方式获取当前搜索优先级更高的定制化配置文件所在目录后,对matplotlibrc文件进行编辑:
>>> import matplotlib>>> matplotlib.get_configdir()'/home/xxx/.matplotlib'
修改默认使用的backend的方式之一,即通过修改配置文件中的 backend 项;
参考matplotlibrc配置文件模板
也可以通过修改环境变量 MPLBACKEND 来修改当前使用的backend:
export MPLBACKEND='Agg'
另外一种修改的方式为在导入pyplot之前,使用matplotlib.**use()**方法修改当前系统支持的backend:
>>> import matplotlib>>> matplotlib.use('Agg')>>> import matplotlib.pyplot as plt
4. 属性方法
4.1 matplotlib.axes.Axes
4.1.1 重要Parameter
- fig :
Figure
The axes is build in the Figure fig
_
rect : [left, bottom, width, height]
The axes is build in the rectangle rect. rect is in
Figurecoordinates.**kwargs
Color相关:[facecolor](https://matplotlib.org/api/_as_gen/matplotlib.axes.Axes.set_facecolor.html#matplotlib.axes.Axes.set_facecolor) color 背景色
位置相关:
显示相关:
label obj s will be converted to a string by calling str
title — 设置图主标题
xlabel — 设置x轴标题
xlim — 设置x轴显示标度限制
ylabel — 设置y轴标题
ylim — 设置y轴显示标度限制
fmt_xdata — 交互式,x轴数据格式化,若无,则退化为 xaxis major formatter
fmt_ydata — 交互式,y轴数据格式化,若无,则退化为 yaxis major formatter
4.1.2 重要method
Axes.plot |
Plot y versus x as lines and/or markers. |
|---|---|
Axes.scatter |
A scatter plot of y vs x with varying marker size and/or color. |
Axes.plot_date |
Plot data that contains dates. |
Axes.bar |
Make a bar plot. |
Axes.pie |
Plot a pie chart. |
Axes.stackplot |
Draw a stacked area plot. |
4.1.3 plot的重要参数
4.1.3.1 fmt — Format Strings
A format string consists of a part for color, marker and line:
fmt = ‘[color][marker][line]’
Each of them is optional. If not provided, the value from the style cycle is used. Exception: If line is given, but no marker, the data will be a line without markers.
Colors
The following color abbreviations are supported:
| character | color |
|---|---|
'b' |
blue |
'g' |
green |
'r' |
red |
'c' |
cyan |
'm' |
magenta |
'y' |
yellow |
'k' |
black |
'w' |
white |
If the color is the only part of the format string, you can additionally use any matplotlib.colors spec, e.g. full names ('green') or hex strings ('#008000').
Markers
| character | description |
|---|---|
'.' |
point marker |
',' |
pixel marker |
'o' |
circle marker |
'v' |
triangle_down marker |
'^' |
triangle_up marker |
'<' |
triangle_left marker |
'>' |
triangle_right marker |
'1' |
tri_down marker |
'2' |
tri_up marker |
'3' |
tri_left marker |
'4' |
tri_right marker |
's' |
square marker |
'p' |
pentagon marker |
'*' |
star marker |
'h' |
hexagon1 marker |
'H' |
hexagon2 marker |
'+' |
plus marker |
'x' |
x marker |
'D' |
diamond marker |
'd' |
thin_diamond marker |
'|' |
vline marker |
'_' |
hline marker |
Line Styles
| character | description |
|---|---|
'-' |
solid line style |
'--' |
dashed line style |
'-.' |
dash-dot line style |
':' |
dotted line style |

若有收获,就点个赞吧
0 人点赞
