- Introduction
- Data Set
- Data Cleaning and Preprocessing
- Exploration analysis
- Feature Extraction
- Model
- Results: deployment of Issue2
- Conclusion
- References
Introduction
With the advent of the era of big data, companies are more and more inclined to analyze customer consumption behaviors, in order to formulate specific marketing strategies to promote consumers to complete the transactions.
Customer groups of different ages and different incomes obviously have different consumption habits. Taking age as an example, young people are more susceptible to online and social media advertisements. And more, because of their relatively less savings, they will be more concerned about the price and the promotion.
In this context, Starbucks has developed an experimental system that simulates user consumption data, and analyzes the data to find the patterns of customer consumption, so as to conduct more targeted promotions and optimize revenue.
Once every few days, Starbucks sends out an offer to users of the mobile app. An offer can be merely an advertisement for a drink or an actual offer such as a discount or BOGO (buy one get one free).
Some users might not receive any offer during certain weeks.
Not all users receive the same offer.
This data set contains simulated data that mimics customer behavior on the Starbucks rewards mobile app, it’s a simplified version of the real Starbucks app because the underlying simulator only has one product whereas Starbucks actually sells dozens of products.
The task is to combine transaction, demographic and offer data to determine which demographic groups respond best to which offer type.
More precisely, I aim to answer two questions:
- What are the main factors that driver customers or groups to complete an offer?
- Given offer characteristics and user demographics, can we predict whether the customer will complete the offer effectively? What’s more, how much money will the customer pay for?
Data Set
- portfolio.json
containing offer ids and meta data about each offer (duration, type, etc.)
| Columns | Data Type | Explanation | Total Count | NaN Count |
|---|---|---|---|---|
| id | str | id of offer | 10 | - |
| offer_type | str | type of offer values: ‘bogo’,’discount’,’informational’ |
10 | - |
| difficulty | int | the minimum consumption to complete the offer | 10 | - |
| reward | int | reward after completing the offer | 10 | - |
| duration | int | the valid duration of the offer | 10 | - |
| channels | str list | the channel to send the offer | 10 | - |
- profile.json
demographic data for each customer | Columns | Data Type | Explanation | Total Count | NaN Count | | —- | —- | —- | —- | —- | | age | int | the age of customer | 14825 | 2175 | | became_member_on | int | the enroll date of customer
e.g. 20170101 | 17000 | - | | gender | str | the gender of customer
values:‘male’,’female’,’other’ | 17000 | - | | id | str | the id of customer | 17000 | - | | income | float | the income of customer | 14825 | 2175 |
- transcript.json
records for transactions, offers received, offers viewed, and offers completed. It shows user purchases made on the app including the timestamp of purchase and the amount of money spent on a purchase. | Columns | Data Type | Explanation | Total Count | NaN Count | | —- | —- | —- | —- | —- | | person | str | the id of customer | 306534 | - | | event | str | the description of transcript
values:‘offer received’,’offer viewed’,’transaction’,’offer completed’ | 306534 | - | | time | int | the happend time of event(hour) | 306534 | - | | value | str dict | some includes id of offer, some includes amount of transaction | 306534 | - |
Data Cleaning and Preprocessing
At the begining, I try to know the basic informations about NaN values, they all bounded with the unusual age value “118”. After all these NaN records have been deleted, Here comes the distributions of gender, age and income.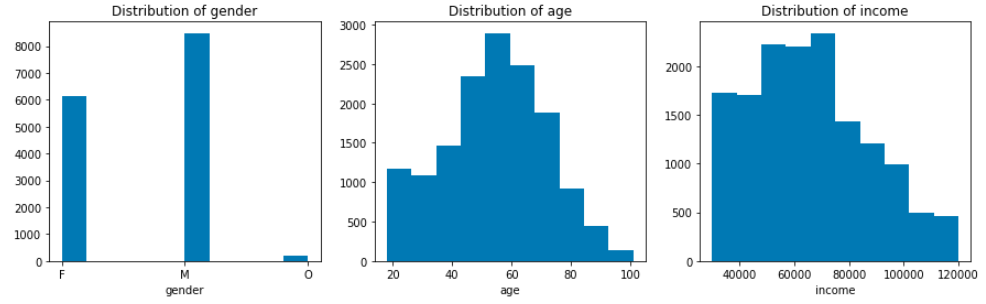
Immediately after, I wrangled the data transcript by extracting the value column to offer id and amount columns. What’s more, I merged the ‘duration’ and ‘offer_type’ infos bounded with the offer id for further data preprocessing. Below is description of the wrangled ‘transcript’:
| Column | Type | Explanation | Total Count | NaN Count |
|---|---|---|---|---|
| person | int | Id of customer | 272762 | - |
| event | str object | State of the record: ‘offer received’, ‘offer viewed’, ‘transaction’, ‘offer completed’ |
272762 | - |
| time | float | Happend time of this record | 272762 | - |
| amount | float | How much money paid under this record Notice: exist only when ‘event’ value is transaction |
272762 | - |
| offer_id | str object | The offer_id bound with this record Notice: ‘-1’ means there is no offer |
272762 | 123957 of ‘-1’ value |
| duration | float | The valid duration of the offer |
272762 | 123957 |
| offer_type | str object | The offer type | 272762 | 123957 |
By using the data set above, based on a self designed program flow chart(File: data_preprocessing_class.py), I extract the transactions infomation direct to the related person and offer.
Meantime, I wrangle the data type of some features (e.g. the ‘value’ column in portfolio is a list, should be unfolded), and transform some features to normal form(e.g. transform the member enroll date from ‘int’ to ‘date’).
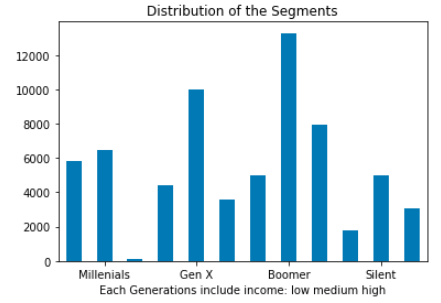
Then I divide all the customers into 12 segments according to ‘age’ and ‘income’, which tends to show a group characteristics.
What’s more important, considering all kinds of response situations to offer, I divide all transactions to 4 groups:
1. none_offer |
never received offer |
|---|---|
2. no_care_offer |
received, but don’t care about the offer |
3. tried_offer |
tried to do some transaction, but not complete within the duration of offer |
4. effective_offer |
complete the offer |
Finally, I get an ideal wrangled data set with label of segments and response groups described as follows(File: model_dataset_raw):
| Column | Type | Explanation | Total Count | NaN Count |
|---|---|---|---|---|
| person | int | id of customer | 66506 | - |
| offer_id | str object | values: ‘-1’, ‘0’-‘9’ represent 10 offers, ‘-1’means no offer received |
66506 | - |
| time_received | float | time when offer received ‘NaN’ represents not received |
66506 | 5 |
| time_viewed | float | time when offer viewed ‘NaN’ represents not viewed |
66506 | 16646 |
| time_transaction | str object | time then transaction(s) takes place ‘’ represents there is no transaction ‘,3.0,5.0’ means there are two transactions under this offer, one is at time 3.0, another in at time 5.0 |
66506 | 8754 |
| time_completed | float | time when offer completed ‘NaN’ represents not completed |
66506 | 26099 |
| amount_with_offer | float | How much money has been paid under this offer ‘0.0’ represent no transaction |
66506 | - |
| label_effective_offer | int | the label to mark the completing level of offer More details See Notice below |
66506 | - |
| reward | float | Reward after completing the offer | 66501 | 5 |
| difficulty | float | The minimum consumption to complete the offer | 66501 | 5 |
| duration | float | The valid duration of the offer ‘NaN’ implies the offer_id is ‘-1’ |
66501 | 5 |
| offer_type | str object | ‘bogo’, ‘discount’,’informational’ | 66501 | 5 |
| float | One Channel to send offer | 66501 | 5 | |
| mobile | float | One Channel to send offer | 66501 | 5 |
| social | float | One Channel to send offer | 66501 | 5 |
| web | float | One Channel to send offer | 66501 | 5 |
| gender | str object | ‘male’,’female’,’other’ | 66506 | - |
| age | int | Age of the customer | 66506 | - |
| income | float | Yearly income of the customer | 66506 | - |
| member_days | int | The days from enroll date to 2019.01.01 | 66506 | - |
| label_group | str object | 4 groups of resonse to offers Values see Notice2. below |
66506 | - |
| label_seg | int | 1-12: 12 segments based on age and income | 66506 | - |
Notice 1.: label_effective_offer (Label describes the completed level of offer)
(Attention: there is no infomation about ‘offer viewed’)
| Values | Meaning |
|---|---|
| 1 | for informational offer there is at least one transaction within duration; for other offer there should be ‘offer completed’ |
| 0 | for informational offer there is no valid transaction within the duration but ‘offer received’; for other offers there is no ‘offer completed’, but within duration there maybe some amount, although the amount of transactions not fulfil requirements |
| -1 | the initial label, when there is no ‘offer received’, the label keeps ‘-1’ |
| -2 | represent some people: they only have transactions within all the experimantal time , no offer was sent to them |
Notice 2.: label_group (4 groups of resonse to offers)
| Group | received | viewed | valid completed | transaction amount | Scenario | Logical expression |
|---|---|---|---|---|---|---|
| 1.none_offer | 0 | 0 | 0 | haven’t received the offer | label_effective_offer.isin([-1, -2]) & time_viewed == NaN |
|
| 2.no_care | 1 | 0 | - | received but not viewed. regarded as “don’t care” |
label_effective_offer.isin([0, 1]) & time_viewed == NaN |
|
| 1 | 1 | 0 | =0.0 | received, viewed but no transaction | label_effective_offer == 0 & amount == 0.0 & time_viewed.notnull() |
|
| 1 | 1 | 1 viewed after completed |
received, but completed unintentionally, namely viewing after completed | label_effective_offer == 1 & time_viewed > time_completed |
||
| 3.tried | 1 | 1 | 0 | >0.0 | received, viewed, have transaction, but amount less than ‘difficulty’ | label_effective_offer == 0 & amount > 0.0 & time_viewed.notnull() |
| 4.effctive_offer | 1 | 1 | 1 viewed before completed |
viewed before completed, effctive offer | label_effective_offer == 1 & time_viewed < time_completed |
Notice 3.: label_seg (12 segments based on age and income)
| Segment # | Age Group (edge included) (Experiment in 2018) |
Income |
|---|---|---|
| 1 | Millenials(-21 & 22-37) | low |
| 2 | Millenials(-21 & 22-37) | medium |
| 3 | Millenials(-21 & 22-37) | high |
| 4 | Gen X(38-53) | low |
| 5 | Gen X(38-53) | medium |
| 6 | Gen X(38-53) | high |
| 7 | Baby Boomer(54-72) | low |
| 8 | Baby Boomer(54-72) | medium |
| 9 | Baby Boomer(54-72) | high |
| 10 | Silent(73-90 & 91+) | low |
| 11 | Silent(73-90 & 91+) | medium |
| 12 | Silent(73-90 & 91+) | high |
Income Level:
| Income | Values($) |
|---|---|
| low | 30,000-50,000 |
| medium | 50,001-82,500 |
| high | 82,501-120,000 |
Notice 4.: offer_id (10 Kinds of offer)
| offer_id | type | duration | requirement | reward |
|---|---|---|---|---|
| 0 | bogo | 7 | 10 | 10 |
| 1 | bogo | 5 | 10 | 10 |
| 2 | infomational | 4 | - | - |
| 3 | bogo | 7 | 5 | 5 |
| 4 | discount | 10 | 20 | 5 |
| 5 | discount | 7 | 7 | 3 |
| 6 | discount | 10 | 10 | 2 |
| 7 | informational | 3 | - | - |
| 8 | bogo | 5 | 5 | 5 |
| 9 | discount | 7 | 10 | 2 |
Exploration analysis
Below is the structure of the analysis data: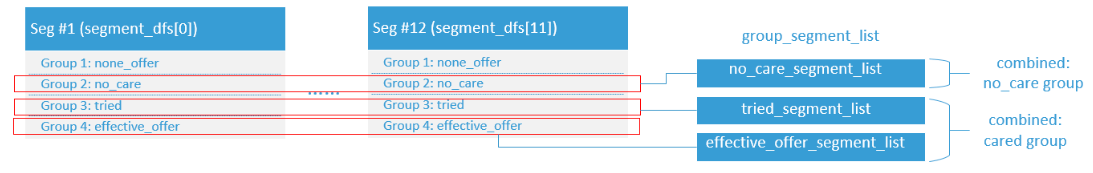
The data set has been divided into 12 Segments based on age and income, and each segment has 4 response groups.
With different combination of the 4 response groups, there are 3 questions to be explored.
| Combined group set 1 | Combined group set 2 | |
|---|---|---|
| 1 Offers Distribution | received none offer Group(s): none_offer |
received offer Group(s): __no_care, tried, effective_offer |
| 2 Interest Distribution towards different offers | don’t care Group(s): no_care |
care Group(s): __tried, effective_offer |
| 3 Difficulty Distribution of different offers | tried but not completed Group(s): tried |
effectively completed Group(s): __effective_offer |
What’s more, I will use the index IIR to discuss, whether the offer is significantly popular by customer.
Q1 Offers Distribution
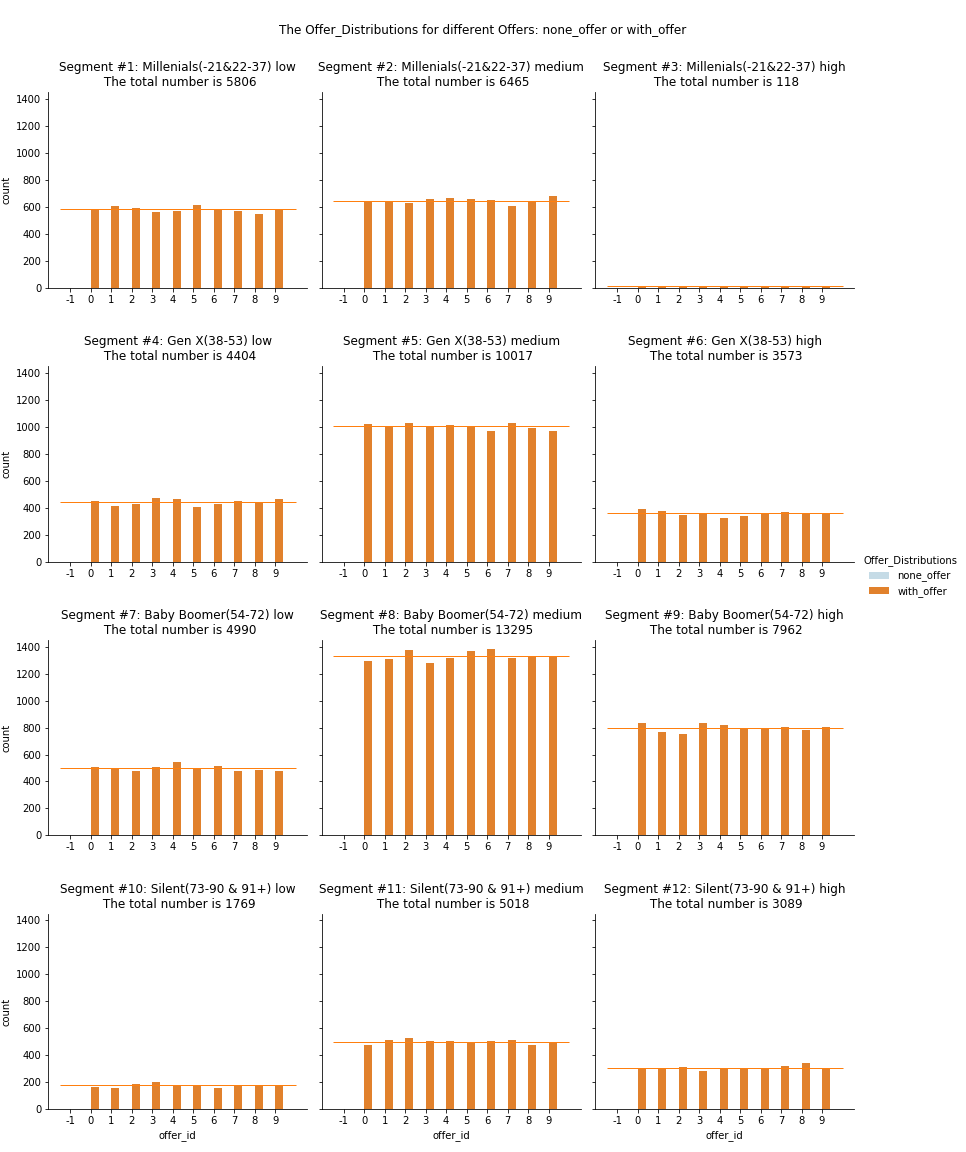
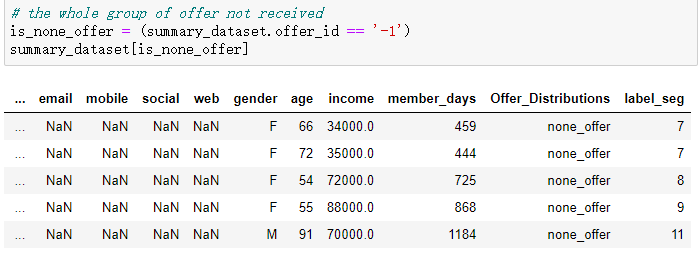
- In general
- There are just 5 person, who never received the offer (offer_id is ‘-1’)
- Two in segment #7; One in each segment #8 #9 #11.
- They all are more than 50 years old and has more than one year membership. It seems they are regular customer and needn’t receive the offer.
- The offer distributions under income: see segment #3 VS. segment #12
- Young people have not so much money.
- Elder people tend to have more savings.
- The offer distributions under age: see segment #1 VS. segment #10
- In the low income group, compared with young person, the elder person seems to receive less offers
- In segments(subplots)
- In each segment, person reveive almost the same quantity of offers. See the average line.
Q2 Interest Distribution towards different offers
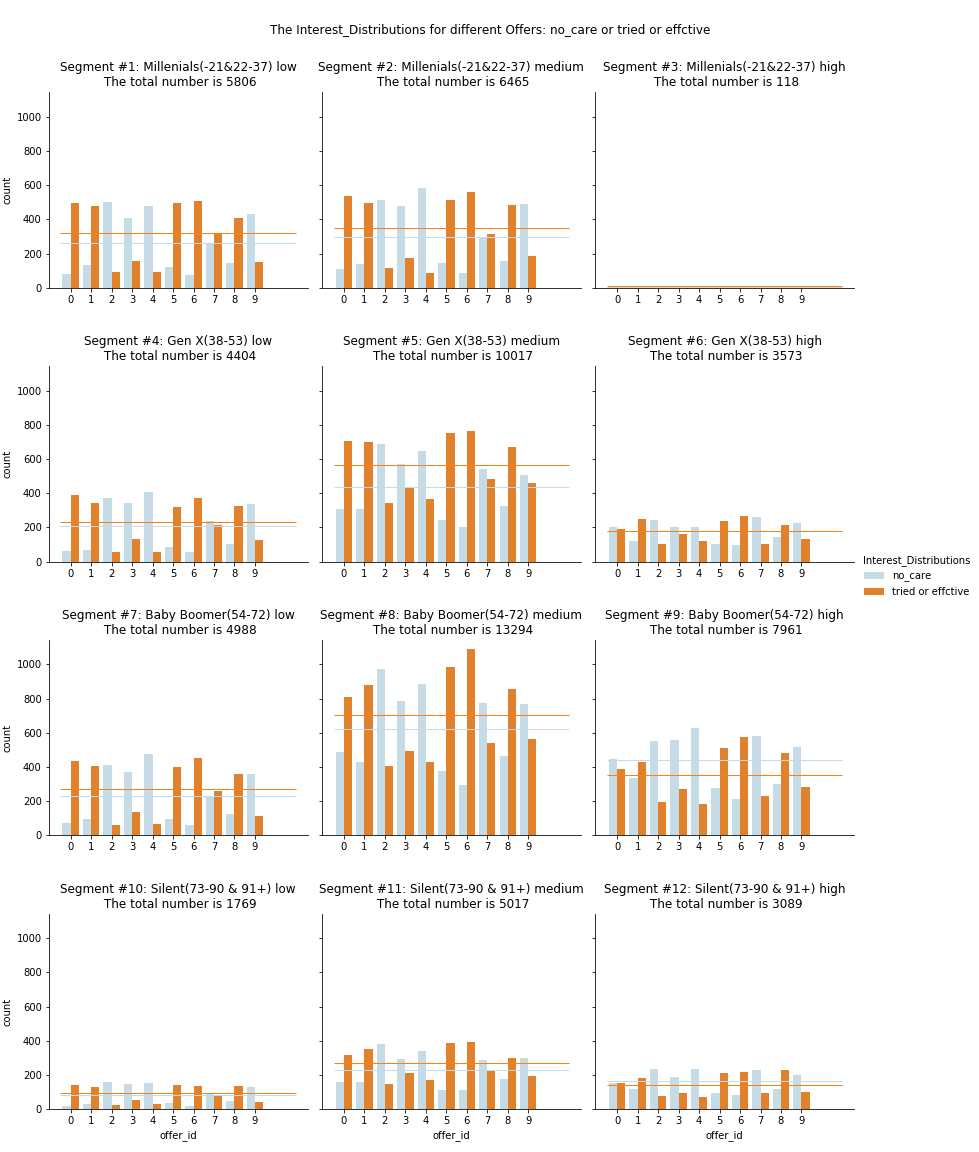
- In general
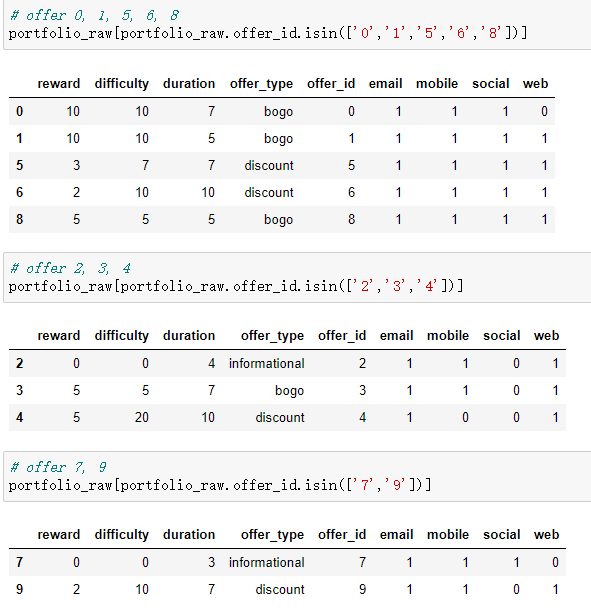
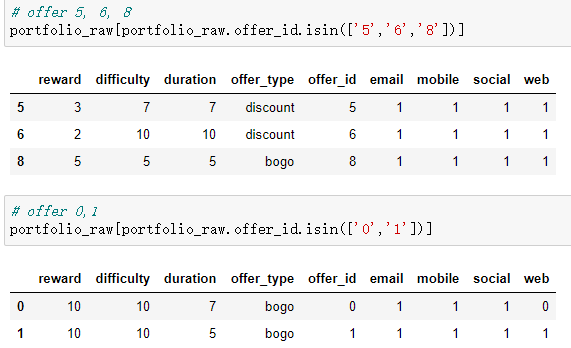
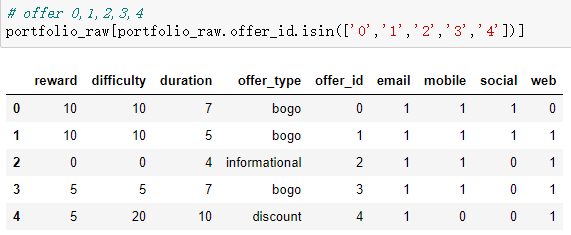
- The customers care more about offer 0, 1, 5, 6, 8
- Offer 2, 3, 4 are not in interest
- For offer 7, 9, some cares, some doesn’t care
From the three tables above, we can conclude that:
- ‘social’ is an import factor to attract people to complete the offer
- ‘bogo’ with medium difficulty are more popular
- ‘discount’ with less difficulty are more popular
- In segments(subplots)
- Offer 0, 1
- The high income groups show less interst compared with other income group. (see Segments #3 #6 #9 #12)
- Offer 5, 6, 8
- Customer shows great interst(in all Segments)
Q3 Difficulty Distribution of different offers
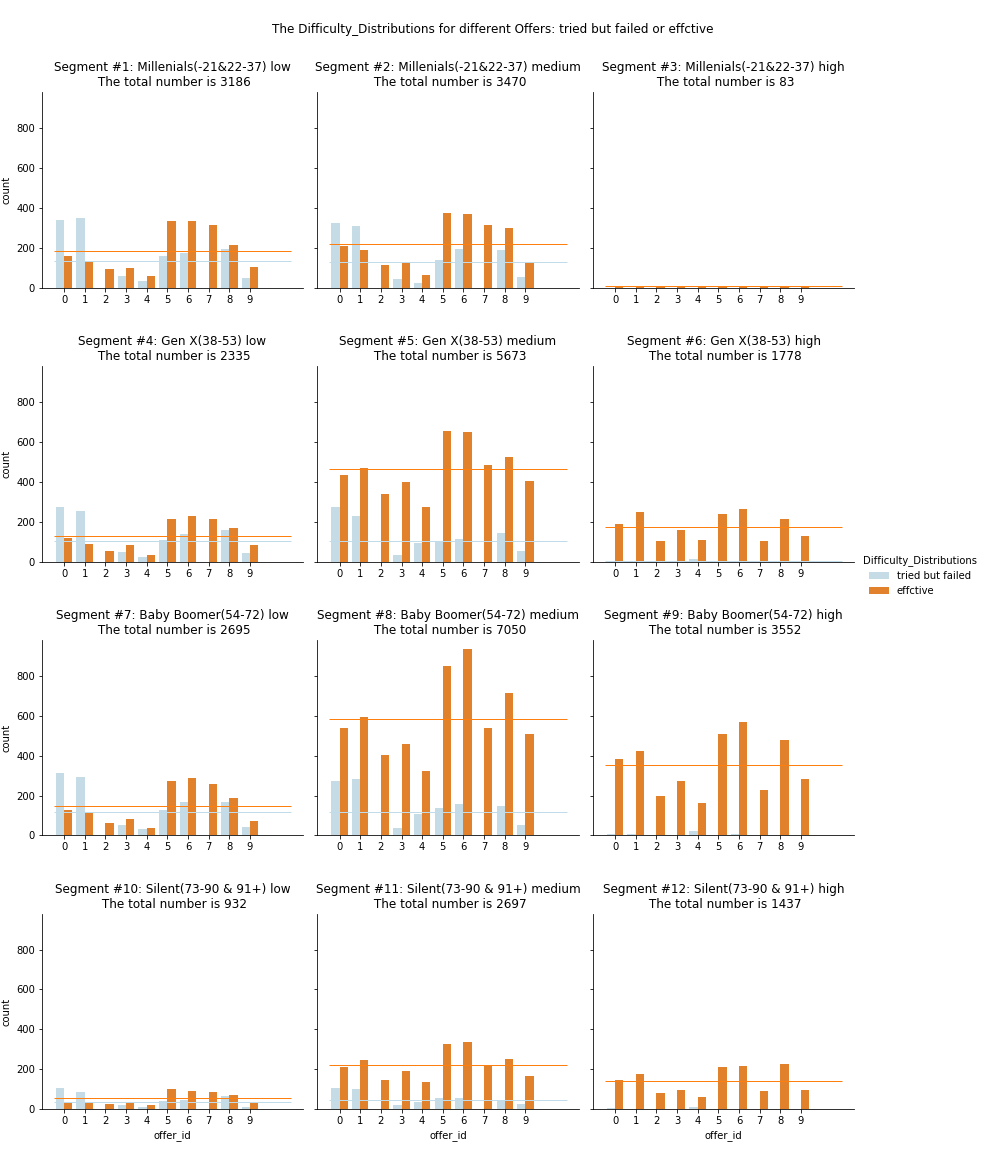
- Summary: Level of completion for each offer
- Offer 5, 6, 8 are better completed
- most are ‘discount’, and there is ‘social’ factor
- ‘difficulty’ of ‘bogo’ is not so much
- Offer 0, 1 are harder to complete
- ‘difficulty’ of ‘bogo’ is a little bit heavy
- Offer 7: an informational offer
- richer customers don’t care (see segment #6 #9 #12, compared to the average line)
- more attracted to less rich people (see average line)
- Offer 2, 3, 4 are more attracted in medium elder and rich people (see segment #5 #8)
- The person with high income tends to complete all offers (see segment #6 #9 #12)
- even for the offer 0, 1
Q4 Index IIR: is the offer significant popular?
Definition of IIR: Incremental Response Rate
| Symbol | Meaning |
|---|---|
| n | number of Purchasers in Treated Group |
| sum | Total number of Purchasers in Treated Group |
| n | number of Purchasers in Control Group |
| sum | Total number of Purchasers in Control Group |
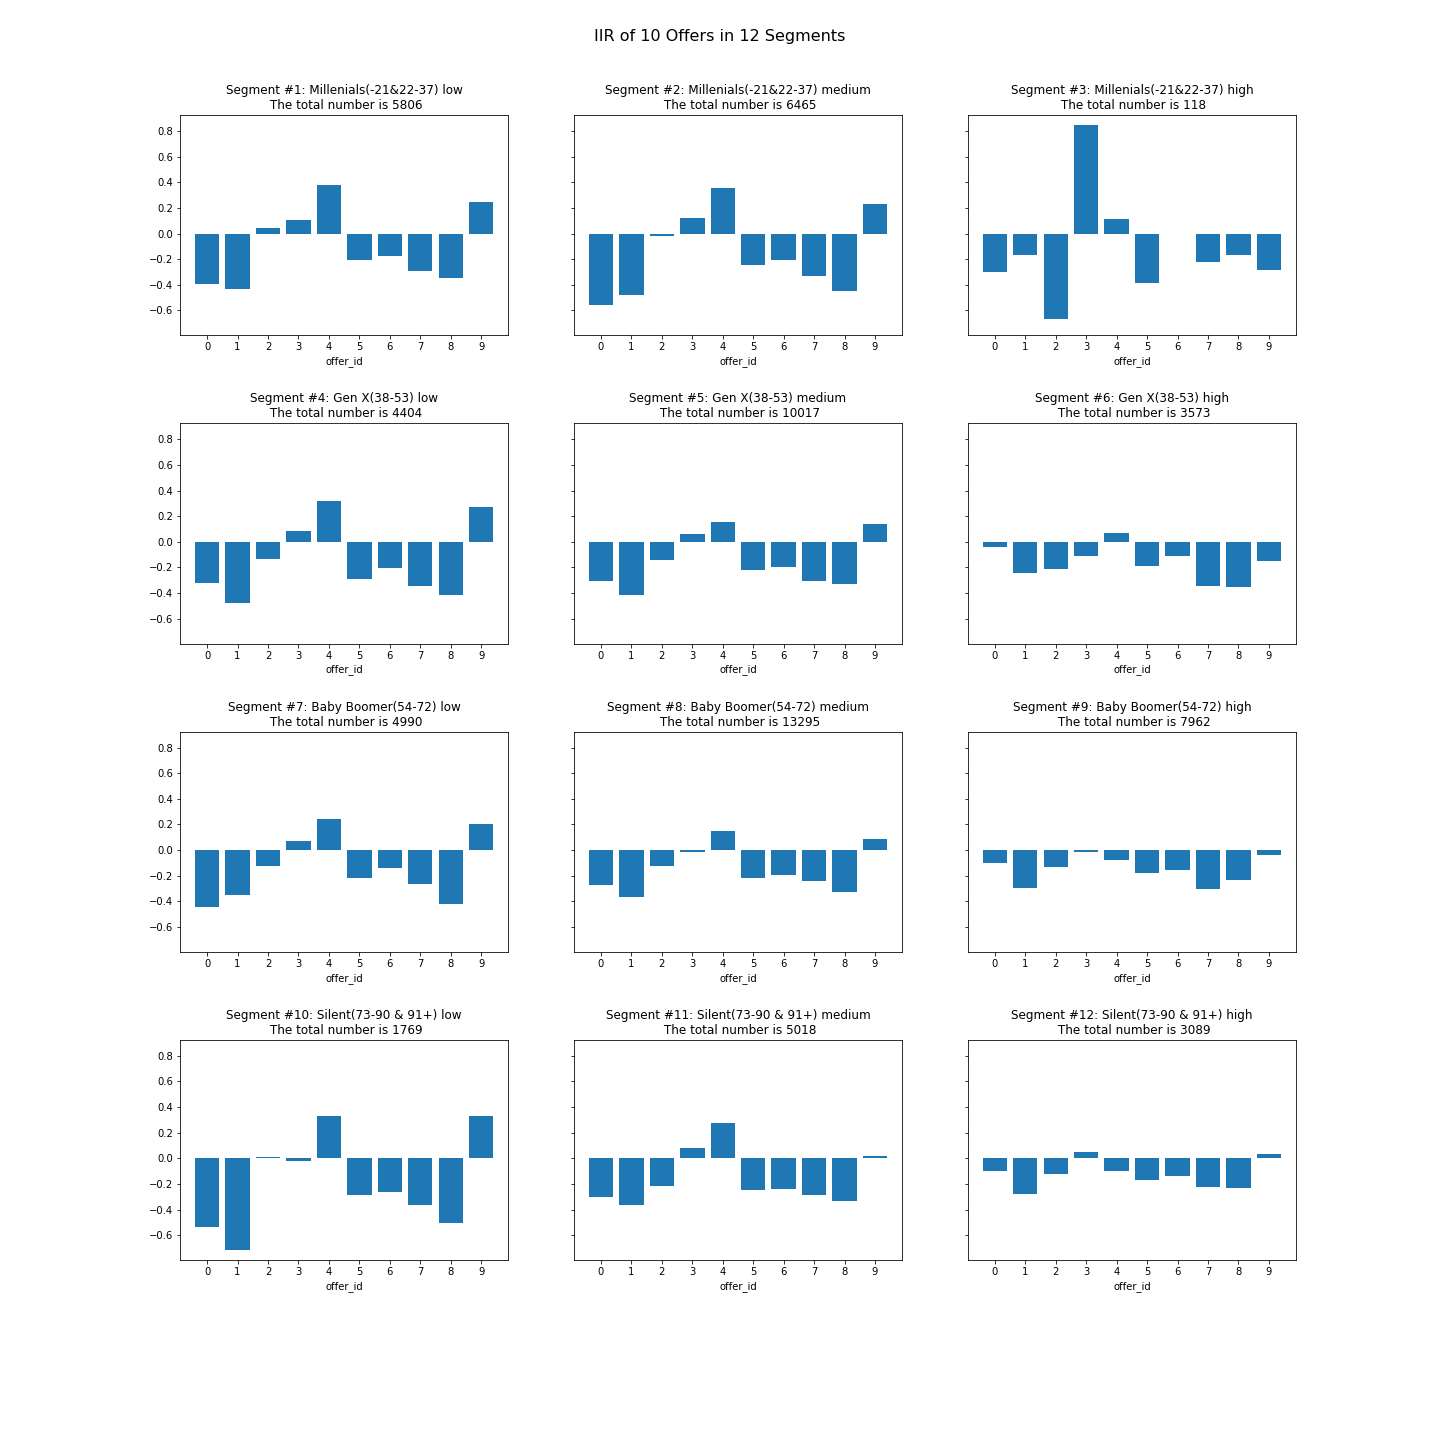
- In general: which offer seems popular?
- Offer 2, 3, 4 have positive IIR
- for offer 4, the difficulty is 20, maybe few people want to complete it, so it shows high IIR
- for offer 3, difficulty is not big, but reward is ok, so it’s popular
- Offer 0,1 have a huge negtive IIR
- specially for the low income person(see segments #1 #4 #7 #10)
- In segments(subplots)
- The rich people seem not so excited about offer received(see Segments #6 #9 #12)
- Maybe they are too rich to be encouraged from the reward of offer
Summary for Data Exploration
- The channel to send an offer
- Through ‘social’ is a better way.
- Through ‘social’ is a better way.
- The type of offer
- People like ‘discount’, because the reward is real money compared to ‘bogo’(get another same thing) and ‘informational’(just information)
- People like ‘discount’, because the reward is real money compared to ‘bogo’(get another same thing) and ‘informational’(just information)
- The content of offer
- If the ‘difficulty’ is too much, e.g. 20, people have less desire to complete the offer
- 5-10 maybe a good range of ‘difficulty’
- For all offers, considering of Interest(care) and Difficulty(Level of completion)
- Offer 5, 6, 8 are more attracted and more easy to complete: could be sent to all customers
- Offer 0, 1 are hard to complete, but could be sent to high income customers
- Offer 2, 3, 4 are more attracted to the medium elder, income people(
Segment #5 #8) - Offer 7 for less income people(maybe the information is attracted by them)
Feature Extraction
Based on the model_dataset_raw above, after some objects columns(offer_id, offer_type, gender etc.) transformed to 0-1 variables, all the potential features have been extracted.
| Features | Type | Explanation | Total Count | NaN Count |
|---|---|---|---|---|
| person | int | 66501 | - | |
| time_received | float | 66501 | - | |
| time_viewed | float | 66501 | - | |
| transaction_cnt | int | count of transactions under this offer of the customer | 66501 | - |
| time_completed | float | 66501 | - | |
| amount_with_offer | float | How much money has been paid under this offer ‘0.0’ represent no transaction |
66501 | - |
| amount_total | float | Total amount of paid money for each customer | 66501 | - |
| offer_received_cnt | float | Count of all received offers | 66501 | - |
| reward | float | Reward after completing the offer | 66501 | - |
| difficulty | float | The minimum consumption to complete the offer | 66501 | - |
| duration | float | The valid duration of the offer |
66501 | - |
| float | One Channel to send offer | 66501 | - | |
| mobile | float | One Channel to send offer | 66501 | - |
| social | float | One Channel to send offer | 66501 | - |
| web | float | One Channel to send offer | 66501 | - |
| age | int | Age of the customer | 66501 | - |
| income | float | Yearly income of the customer | 66501 | - |
| member_days | int | The days from enroll date to 2019.01.01 | 66501 | - |
| label_seg | int | 1-12: 12 segments based on age and income | 66501 | - |
| gender_F gender_M gender_O |
int | 0-1 variables of genedr | 66501 | - |
| group_effective_offer group_no_care group_tried |
int | 0-1 variables of group(the group of none_offer has been removed) | 66501 | - |
| offer_0 offer_1 |
……
offer_9 | int | 0-1 variables of 10 kinds offers | 66501 | - |
Model
I wonder whether Machine Learning will find some intersting points of the data. Especially in the following situations:
- Offer is going to be sent to a customer, will this offer effective?
- Offer is already sent to a customer, is this offer effective?
- Given basic infos of a customer, how to recommend an offer with the most effctivity?
To answer these questions, I build a model pipeline:
- Select features and target(for different issue concerned use different features and target)
- Select classifiers and compare the perform of all classifiers
- Select the suitable parameters of the best performed classifier by using grid search method
- Analyse the result
Notice:** One Neural Network is also built for regeression analysing.
Issue1: Offer is going to be sent to a customer, will this offer effective?
| Object | Description | |
|---|---|---|
| Data Set | Subset data of 3 offer response groups | - no_care - tried - effective_offer |
| Target | label_group | 0: customer doesn’t care the offer 1: Within the duration of offer, customer tried or completed the transactions |
| Features | age | basic info about customer |
| income | basic info about customer | |
| member_days | basic info about customer | |
| gender_ | basic info about customer (3 kinds of 0-1 variables) |
|
| offer_ | offer id (10 kinds of 0-1 variables) |
|
| amount_total | amount paid of all transactions | |
| offer_received_cnt | number of all received offers | |
| time_received | receive time for this offer |
Issue1 Summary:
- The first model KNeighborsClassifier could be a reference model
- SVC and NuSVC take more time, I attempt to continue without them.
- DecisionTreeClassifier and RandomForestClassifier both have a high score in training, is there something speciall?
- Notice that: the test time is much more less than train time. The possible reason is that the data set has a simple structure so that all predict with same result(see the deployment of Issue2: no matter how I change the input data, it all shows the same result.)
- For all, the accuracy of predicting is around 70%, it seems models are not so appropriate in this situation.
Issue2: Offer is already sent to a customer, is this offer effective?
| Object | Description | |
|---|---|---|
| Data Set | Subset data of 3 offer response groups | - no_care - tried - effective_offer |
| Target | label_group | 0: customer doesn’t care the offer 1: Within the duration of offer, customer tried or completed the transactions |
| Features | age | basic info about customer |
| income | basic info about customer | |
| member_days | basic info about customer | |
| gender_ | basic info about customer (3 kinds of 0-1 variables) |
|
| offer_ | offer id (10 kinds of 0-1 variables) |
|
| amount_total | amount paid of all transactions | |
| offer_received_cnt | number of all received offers | |
| time_received | receive time for this offer | |
| amount_with_offer | amount paid for this offer | |
| time_viewed | view time for this offer. If not, the value is 0.0 |
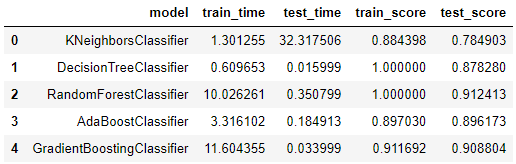
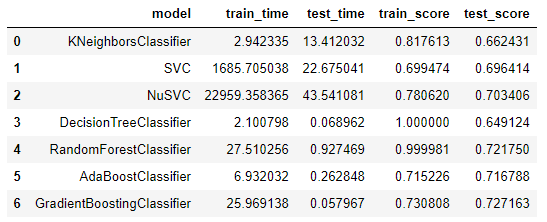
Issue2 Summary:
- As a reference model, KNeighborsClassifier performs not bad.
- DecisionTreeClassifier and RandomForestClassifier both have a full score in training, is there something speciall?
- Notice that: the test time is much more less than train time. The possible reason is that the data set has a simple structure so that all predict with same result(see the deployment of Issue2: no matter how I change the input data, it all shows the same result.)
P.S.: I’ve used the GradientBoostingClassifier as the target model to deploy my project.
Issue3: Given basic infos of a customer, how to recommend an offer with the most effctivity?
| Object | Description | |
|---|---|---|
| Data Set | Subset data of 2 offer response groups(at least transaction exists) | - tried - effective_offer |
| Target | offer_(10 classes) | 0: uneffective in this offer_id 1: effective in this offer_id |
| Features | age | basic info about customer |
| income | basic info about customer | |
| member_days | basic info about customer | |
| gender_ | basic info about customer (3 kinds of 0-1 variables) |
|
| amount_total | amount paid of all transactions | |
| offer_received_cnt | number of all received offers | |
| time_received | receive time for this offer | |
| amount_with_offer | amount paid for this offer | |
| time_viewed | view time for this offer. If not, the value is 0.0 |
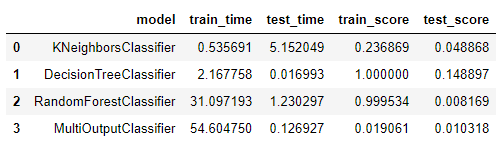
Issue3 Summary:
- For all, the predicting performs are totally bad.
- But still, DecisionTreeClassifier and RandomForestClassifier have high score in training, what’s going on?
- Notice that: the test time if much more less than train time. The possible reason is that the data set has a simple structure so that all predict with same result(see the deployment of Issue2: no matter how I change the input data, it all shows the same result.)
- But still, DecisionTreeClassifier and RandomForestClassifier have high score in training, what’s going on?
- Pay attention to that the GradientBoostingClassifier() is not suitable for multi-class problem.
So I used MultiOutputClassifier(GradientBoostingClassifier())
Additional Issue: Neural Network for regeression
| Object | Description | |
|---|---|---|
| Data Set | all model_dataset | |
| Target | amount_total (float) | The total amount of money paid by a costomer |
| Features | age | basic info about customer |
| income | basic info about customer | |
| member_days | basic info about customer | |
| gender_ | basic info about customer (3 kinds of 0-1 variables) |
|
| reward | bounded with offer | |
| difficulty | bounded with offer | |
| duration | bounded with offer | |
| bounded with offer | ||
| mobile | bounded with offer | |
| social | bounded with offer | |
| web | bounded with offer | |
| transaction_cnt | count of all transactions for a customer | |
| offer_received_cnt | count of received offers for a customer | |
| group_effctive_offer | Label of group(effctive_offer) | |
| group_no_care | Label of group(no_care) | |
| group_tried | Label of group(tried) |
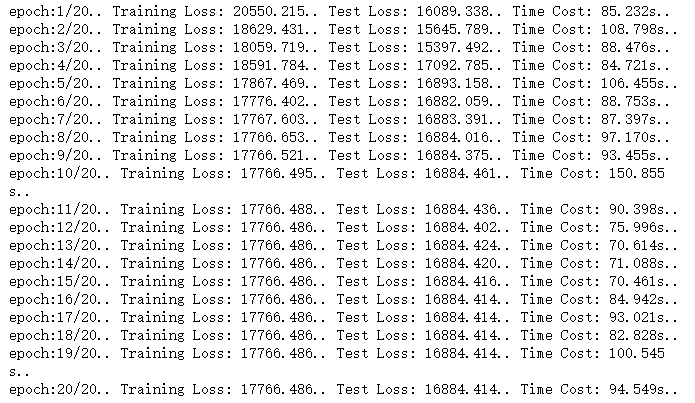
Additional Issue summary:
This experiment for regression analysing seems useless because of the stagnant and huge training loss.
Results: deployment of Issue2
Offer is already sent to a customer, is this offer effective?
Classifier: GradientBoostingClassifier
Features importances order: 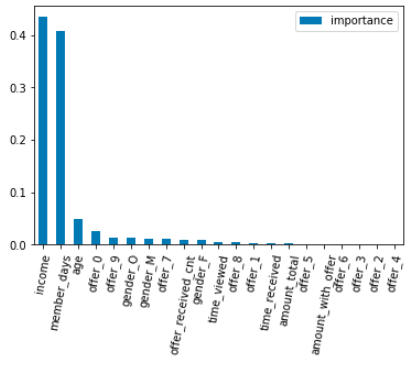
Deployment - input the data: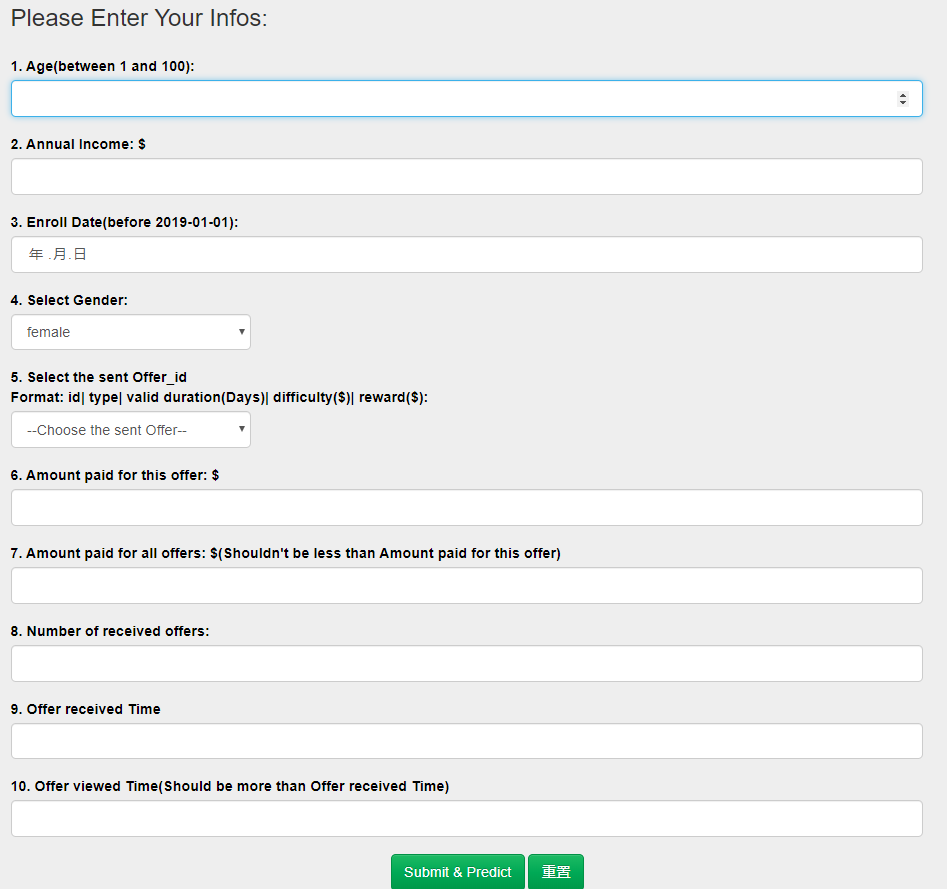
Deployment - result: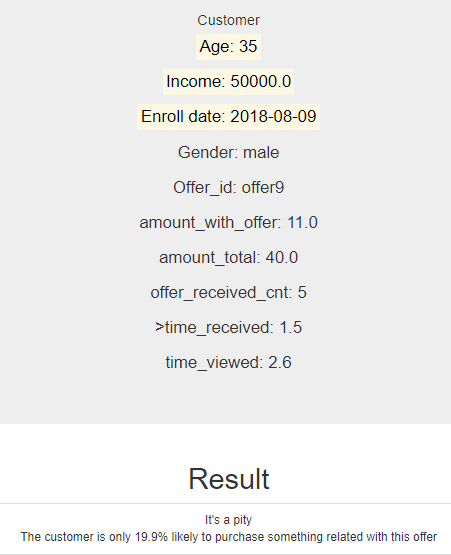
Conclusion
- Two analysis methods: heuristic exploration & model building
- The model method fits not good at the reality: for example the deployment of Issue2, when I change the input data, the result seems always the same.
- But the heuristic exploration makes more sense.
- In this case we could try unsupervised Machine Learning method like Cluster. See References[6]
- About Data Set
- Maybe when the amount of data is big enough, we could get some resonable founds by using the supervised Machine Learning method.
- Besides, there is no features of customer id, the customer exists in the form of the segment group, maybe when the transactions of an unique customer more frequently occurs, there would be some patterns of the consuming behavior.
- About the Segment
- Here I use the information of age and income. We can also use other method to segment the customers, e.g. age and gender.
For more details of this project, you could refer to my Github Repository
I would like to thank Udacity & Starbucks for all the supports, especially for teaching assistant.
References
[1]Create dummies from a column with multiple values in pandas
[2]Starbucks Capstone Challenge: Using Starbucks app user data to predict effective offers
[3]Starbucks Promotion Optimization
[4]generations-and-age
[5]single taxable income
[6]Investigating Starbucks Customers Segmentation using Unsupervised Machine Learning

若有收获,就点个赞吧
0 人点赞
