Prometheus官网:https://prometheus.io/
https://prometheus.io/docs/introduction/overview/
中文介绍引用:https://www.jianshu.com/p/dfd6ba5206dc
Prometheus 组成及架构
Prometheus 生态圈中包含了多个组件,其中许多组件是可选的:
- Prometheus Server: 用于收集和存储时间序列数据。
- Client Library: 客户端库,为需要监控的服务生成相应的 metrics 并暴露给 Prometheus server。当 Prometheus server 来 pull 时,直接返回实时状态的 metrics。
- Push Gateway: 主要用于短期的 jobs。由于这类 jobs 存在时间较短,可能在 Prometheus 来 pull 之前就消失了。为此,这次 jobs 可以直接向 Prometheus server 端推送它们的 metrics。这种方式主要用于服务层面的 metrics,对于机器层面的 metrices,需要使用 node exporter。
- Exporters: 用于暴露已有的第三方服务的 metrics 给 Prometheus。
- Alertmanager: 从 Prometheus server 端接收到 alerts 后,会进行去除重复数据,分组,并路由到对应的接收方式,发出报警。常见的接收方式有:电子邮件,pagerduty,OpsGenie, webhook 等。
Prometheus 官方文档中的架构图: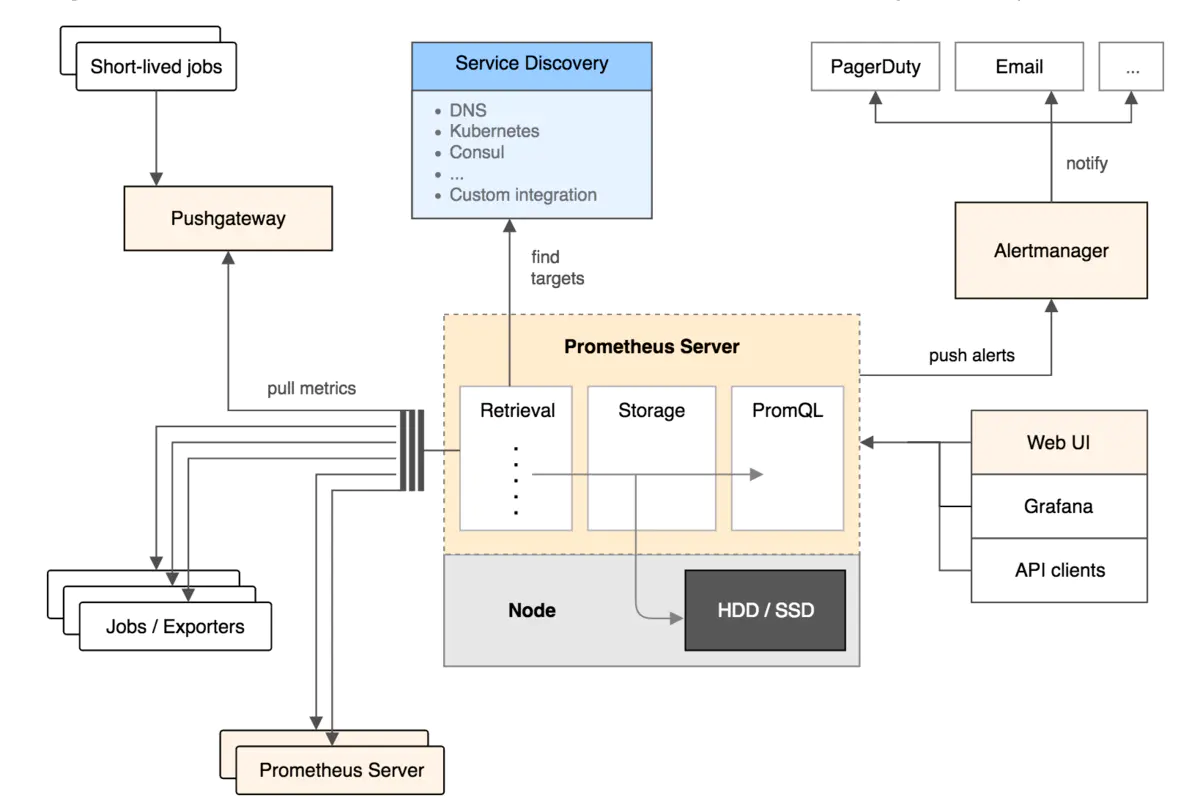
从上图可以看出,Prometheus 的主要模块包括:Prometheus server, exporters, Pushgateway, PromQL, Alertmanager 以及图形界面。
其大概的工作流程是:
- Prometheus server 定期从配置好的 jobs 或者 exporters 中拉 metrics,或者接收来自 Pushgateway 发过来的 metrics,或者从其他的 Prometheus server 中拉 metrics。
- Prometheus server 在本地存储收集到的 metrics,并运行已定义好的 alert.rules,记录新的时间序列或者向 Alertmanager 推送警报。
- Alertmanager 根据配置文件,对接收到的警报进行处理,发出告警。
- 在图形界面中,可视化采集数据。

若有收获,就点个赞吧
0 人点赞
