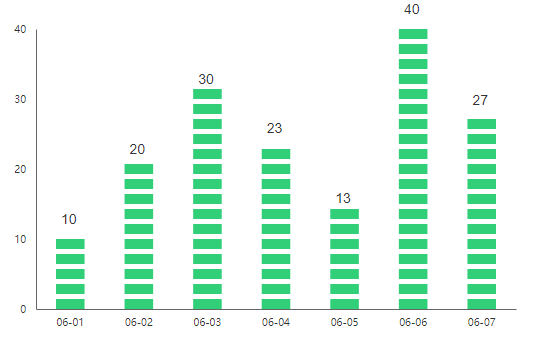
效果图
DashChart组件使用
组件引入
import Vue from 'vue'import {DashChart} from 'special-ui'Vue.use(DashChart)
组件使用
<template><div class="container"><dash-chart :dataset="dataset" :xAxisArr="xAxisArr"/></div></template><script>export default {data () {return {dataset: [10, 20, 30, 23, 13, 40, 27],xAxisArr: ['06-01', '06-02', '06-03', '06-04', '06-05', '06-06', '06-07']}},}</script><style lang="scss" scoped>.container {height: 100%;}</style>
组件参数
| 属性 | 说明 | 默认值 |
|---|---|---|
| dataset | 统计数据数组 | [] |
| xAxisArr | x轴显示 | [0, 1, …] |
| width | 画布宽度 | 600 |
| height | 画布高度 | 400 |
| color | 柱状图颜色 | ‘#31cf78’ |
| dash | 柱状图高度和间隔 | [10, 5] |
| yAxisNum | y轴显示个数 | 5 |
| tickSizeInner | 坐标轴内刻度 | 0 |
| tickSizeOuter | 坐标轴外刻度 | 0 |
| axisColor | 坐标轴颜色 | ‘#666’ |
| axisTextColor | 坐标轴文本颜色 | ‘#333’ |
| padding | 内间距 | {top: 60, bottom: 60, left: 60, right: 60} |
| textStyle | 文本样式 | {fontSize: ‘14px’,color: ‘#333333’,dx: 5,dy: -15} |
textStyle属性说明:
fontSize: 字体大小
color: 字体颜色
dx: 文本偏移量x方向
dy: 文本偏移量y方向

若有收获,就点个赞吧
0 人点赞
