Warm-up Exercise 10/10
function A = warmUpExercise()%WARMUPEXERCISE Example function in octave% A = WARMUPEXERCISE() is an example function that returns the 5x5 identity matrixA = [];% ============= YOUR CODE HERE ==============% Instructions: Return the 5x5 identity matrix% In octave, we return values by defining which variables% represent the return values (at the top of the file)% and then set them accordingly.A = eye(5);% ===========================================end
随后在命令行中输入submit(),根据提示输入Email和Token即可提交!
Computing Cost(for One Variable) 40/40
%3D%5Cfrac%7B1%7D%7B2%20m%7D%20%5Csum%7Bi%3D1%7D%5E%7Bm%7D%5Cleft(h%7B%5Ctheta%7D%5Cleft(x%5E%7B(i)%7D%5Cright)-y%5E%7B(i)%7D%5Cright)%5E%7B2%7D%0A#card=math&code=J%28%5Ctheta%29%3D%5Cfrac%7B1%7D%7B2%20m%7D%20%5Csum%7Bi%3D1%7D%5E%7Bm%7D%5Cleft%28h%7B%5Ctheta%7D%5Cleft%28x%5E%7B%28i%29%7D%5Cright%29-y%5E%7B%28i%29%7D%5Cright%29%5E%7B2%7D%0A&id=GVf0p)
%3D%5Ctheta%5E%7BT%7D%20x%3D%5Ctheta%7B0%7D%2B%5Ctheta%7B1%7D%20x%7B1%7D%0A#card=math&code=h%7B%5Ctheta%7D%28x%29%3D%5Ctheta%5E%7BT%7D%20x%3D%5Ctheta%7B0%7D%2B%5Ctheta%7B1%7D%20x_%7B1%7D%0A&id=wEShW)
以下加入到
plotData.m中,完成plotData()函数
plot(x, y, 'rx', 'MarkerSize', 10); % Plot the dataylabel('Profit in $10,000s'); % Set the y-axis labelxlabel('Population of City in 10,000s'); % Set the x-axis label
以下在命令行中输入
data = load('ex1data1.txt');% 读取训练集X = data(:,1);y = data(:,2);plotData(X,y); % 绘制训练集的图像m = length(X); % m就是训练集的sizeX = [ones(m,1), data(:,1)]; % 给训练集增加一列1对应θ0theta = zeros(2,1); % 2 * 1 注意,已经定义了列向量θ,不用再转置iterations = 1500; % 迭代次数alpha = 0.01; % 学习速率
以下加入到computeCost.m中,完成computeCost()函数
h = X * theta;J = 1 / (2 * m) * sum((h - y) .^ 2);
X——————————————m*2 matrix——————第一列全是1(x{0})第二列是x{1}
theta———————————2*1 matrix——————两个参数\theta{1},\theta{2}
h = X * theta————-m*1 matrix——————第i行对应h(x^{(i)})
sum((h - y) .^ 2)—-a scalar value——-求出各行(h(x^{(i)}) - y{(i)}){2}再相加
最后,得到J是一个标量,代表预测值和实际值之间的误差
测试并提交
computeCost(X,y,[-1;2]) % 54.2425submit()
Gradient Descent (for One Variable) 50/50
%7D%5Cright)-y%5E%7B(i)%7D%5Cright)%20x%7Bj%7D%5E%7B(i)%7D%20%5Cquad%5Cleft(%5Ctext%20%7B%20simultaneously%20update%20%7D%20%5Ctheta%7Bj%7D%20%5Ctext%20%7B%20for%20all%20%7D%20j%5Cright)%0A#card=math&code=%5Ctheta%7Bj%7D%3A%3D%5Ctheta%7Bj%7D-%5Calpha%20%5Cfrac%7B1%7D%7Bm%7D%20%5Csum%7Bi%3D1%7D%5E%7Bm%7D%5Cleft%28h%7B%5Ctheta%7D%5Cleft%28x%5E%7B%28i%29%7D%5Cright%29-y%5E%7B%28i%29%7D%5Cright%29%20x%7Bj%7D%5E%7B%28i%29%7D%20%5Cquad%5Cleft%28%5Ctext%20%7B%20simultaneously%20update%20%7D%20%5Ctheta%7Bj%7D%20%5Ctext%20%7B%20for%20all%20%7D%20j%5Cright%29%0A&id=btGl7)
本次程序中可以作如下简化计算
%7D%5Cright)-y%5E%7B(i)%7D%5Cright)%20x%7Bj%7D%5E%7B(i)%7D%3D%20X%5E%7BT%7D(X%20%20%5Ctheta-y)%0A#card=math&code=%5Csum%7Bi%3D1%7D%5E%7Bm%7D%5Cleft%28h%7B%5Ctheta%7D%5Cleft%28x%5E%7B%28i%29%7D%5Cright%29-y%5E%7B%28i%29%7D%5Cright%29%20x%7Bj%7D%5E%7B%28i%29%7D%3D%20X%5E%7BT%7D%28X%20%20%5Ctheta-y%29%0A&id=Vy9iw)
以下加入到gradientDescent.m中
theta = theta - alpha / m * (X' * (X * theta - y));
测试并提交
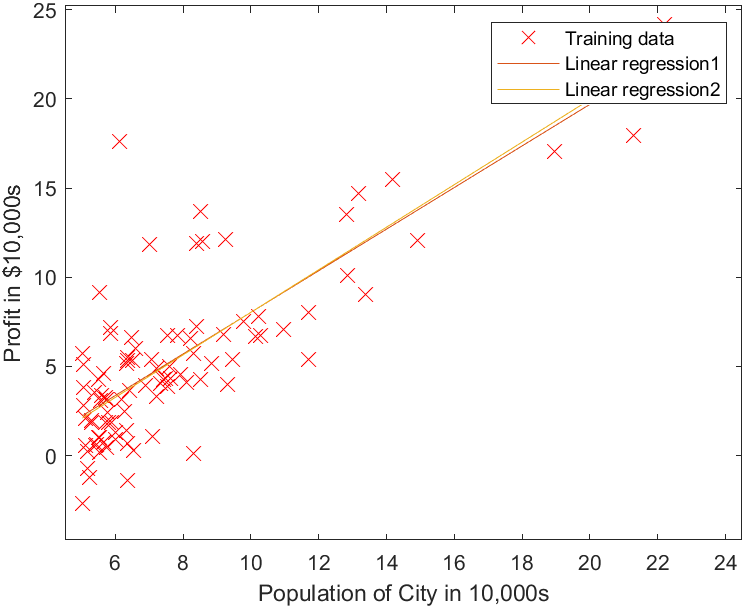
theta = gradientDescent(X, y, theta, alpha, iterations);hold on;plot(X(:,2), X * theta, '-')legend('Training data', 'Linear regression')submit()
到此为止,编程作业含成绩部分已完成(100/100)
下面是关于J(\theta_{0},\theta{1})的可视化


Feature normalization 0/0

若有收获,就点个赞吧
0 人点赞
