Model and Cost Function
Model Representation(表示)
To establish notation(符号) for future use, we’ll use
to denote(表示) the input variables(living area in this example), also called input features
to denote the output or target variable that we try to predict(price)
A pair is called a training example
A list of training examples is called a training set
Note that the superscript in the notation is simple an index into the training set
example:
| Size in feet 2 (x) |
Price($) in 1000‘s (y) |
|---|---|
| 2104 | 460 |
| 1416 | 232 |
| 1534 | 315 |
| 852 | 178 |
| … | … |
Given a training set, to learn a function h : X -> Y(mapping from X to Y), so that h(x) is a good predictor for the corresponding(对应的) value of y, this function h is called a hypothesis.
Linear regression with one variable in the example like this

Cost Function
We want to choose so that is close to for our training examples
Measuring the accuracy of our hypothesis function by using a cost function.
Hypothesis:
Parameters(参数):
Cost Function:
Goal:
是我们常见的方差(variance),我们发现,定义cost function时将方差乘以了 as a convenience for the computation of the gradient descent(梯度下降),因为平方函数的导数会消掉这个
Intuition I
Let ,so
Hypothesis:  fdasf
fdasf
Parameters:
Cost Function:
Goal:
J(1)
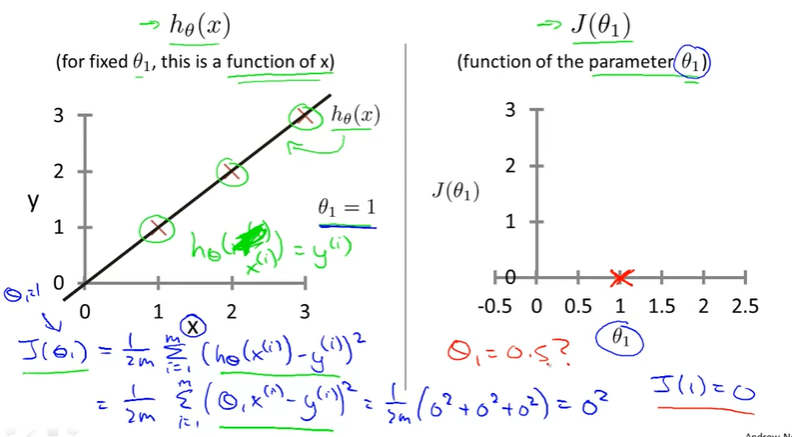
J(0.5)

J(0)

More

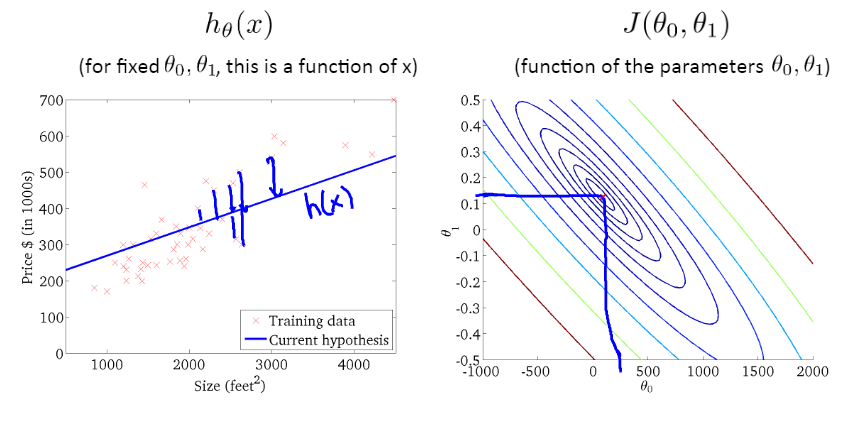
Intuition II

我们下面将要用到等高线图(contour plot),就是上面这种直观的三维图像拍扁在一个二维坐标下的样子,我们使用不同颜色的cycle来代表不同的cost function value,每一个cycle(同一个颜色的线)上的所有得到的的值都是相同的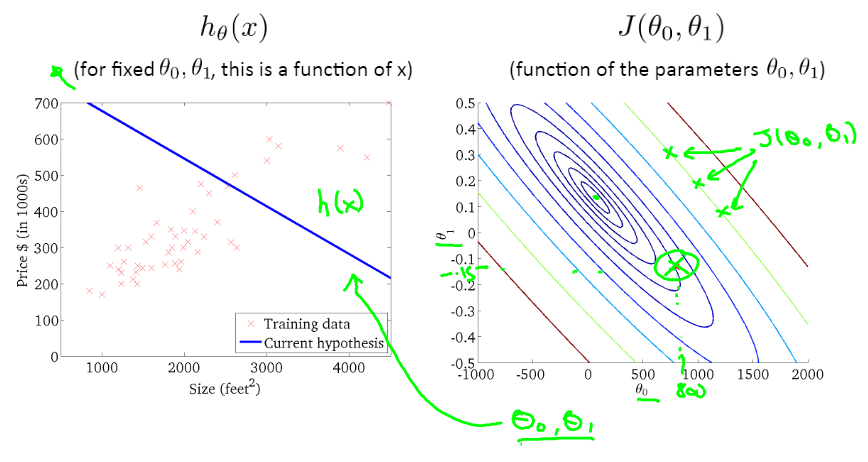
注意,显然这里contour plot中间的那个最小圆圈处代表了的最小值,离那里越远,这个预测值就越不准确


若有收获,就点个赞吧
0 人点赞
