环境准备
基本yum源
yum install -y epel-releaseyum install -y wget bash-com* gityum update -y
yum -y install gcc bc gcc-c++ ncurses ncurses-devel cmake elfutils-libelf-devel openssl-devel flex* bison* autoconf automake zlib* fiex* libxml* ncurses-devel libmcrypt* libtool-ltdl-devel* make cmake pcre pcre-devel openssl openssl-devel jemalloc-devel tlc libtool vim unzip wget lrzsz bash-comp* ipvsadm ipset jq sysstat conntrack libseccomp conntrack-tools socat curl wget git conntrack-tools psmisc nfs-utils tree bash-completion conntrack libseccomp net-tools crontabs sysstat iftop nload strace bind-utils tcpdump htop telnet lsof
关闭防火墙,swap,selinux
#关闭防火墙
systemctl disable --now firewalld

#关闭swap
swapoff -a
sed -ri '/^[^#]*swap/s@^@#@' /etc/fstab

#关闭selinux
setenforce 0
sed -ri '/^[^#]*SELINUX=/s#=.+$#=disabled#' /etc/selinux/config
主机
| hostname | ip |
|---|---|
| prometheus | 10.146.0.10 |
安装prometheus
下载
https://prometheus.io/download/
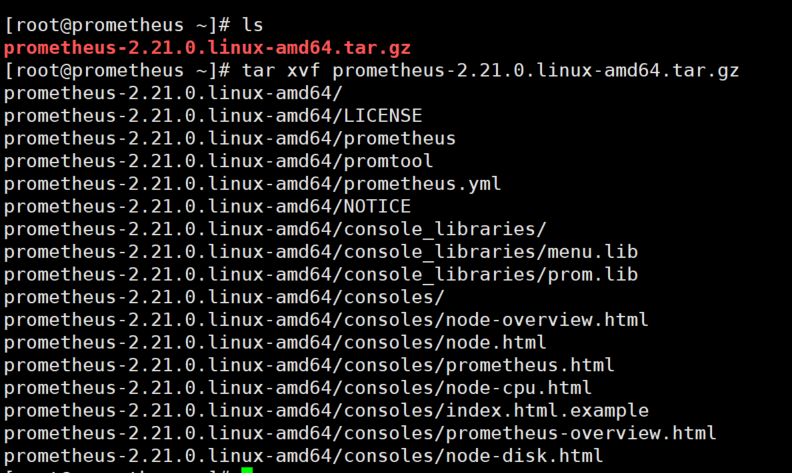
wget https://github.com/prometheus/prometheus/releases/download/v2.21.0/prometheus-2.21.0.linux-amd64.tar.gz
tar xvf prometheus-2.21.0.linux-amd64.tar.gz
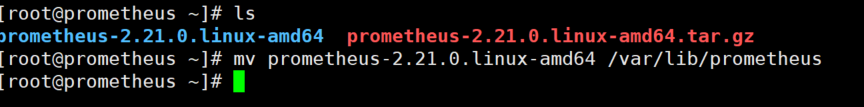
mv prometheus-2.21.0.linux-amd64 /var/lib/prometheus
创建prometheus用户
 useradd -r -d /var/lib/prometheus -m prometheus
 mkdir /var/lib/prometheus/data
 chown -R prometheus:prometheus  /var/lib/prometheus/
创建prometheus服务
cat > /usr/lib/systemd/system/prometheus.service <<EOF
[Unit]
Description=The Prometheus 2 monitoring system and time series database.
Documentation=https://prometheus.io
After=network.target
[Service]
EnvironmentFile=-/etc/sysconfig/prometheus
User=prometheus
ExecStart=/var/lib/prometheus/prometheus \
--storage.tsdb.path=/var/lib/prometheus/data \
--config.file=/var/lib/prometheus/prometheus.yml \
--web.listen-address=0.0.0.0:9090 \
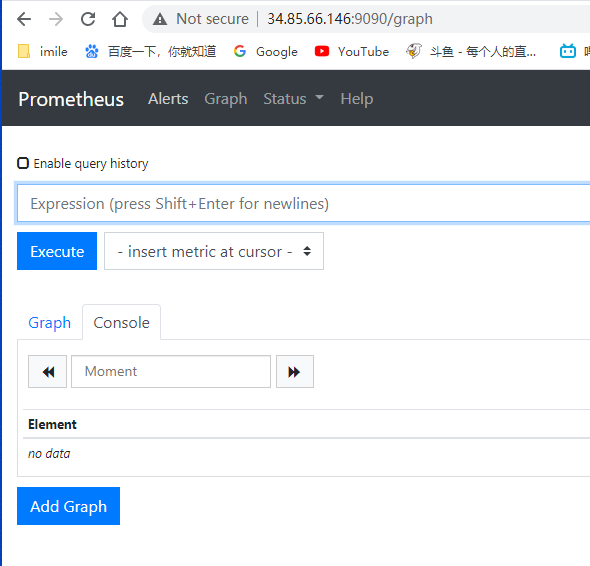
--web.external-url=http://34.85.66.146:9090
Restart=on-failure
StartLimitInterval=1
RestartSec=3
[Install]
WantedBy=multi-user.target
EOF
启动prometheus
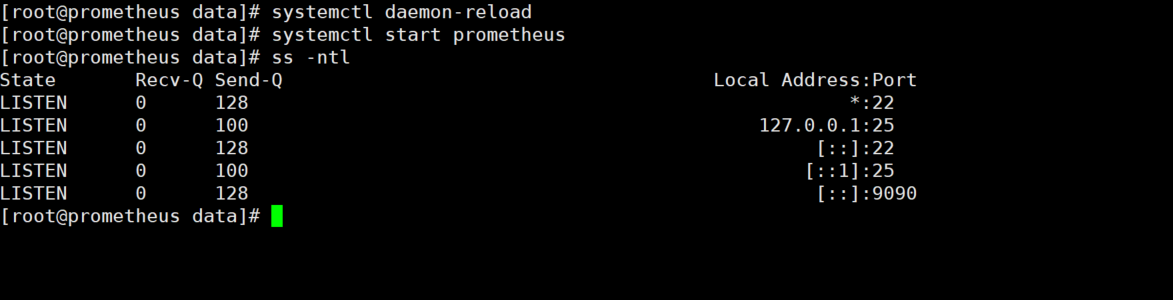
systemctl daemon-reload
systemctl start prometheus
安装node-exproter
下载
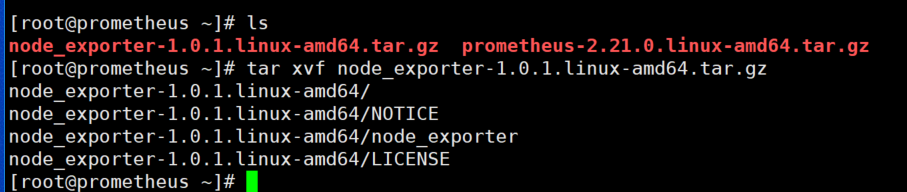
wget https://github.com/prometheus/node_exporter/releases/download/v1.0.1/node_exporter-1.0.1.linux-amd64.tar.gz
tar xvf node_exporter-1.0.1.linux-amd64.tar.gz
mv node_exporter-1.0.1.linux-amd64 /var/lib/node_exporter

创建node_exporter服务
chown -R prometheus:prometheus /var/lib/node_exporter/
cat > /usr/lib/systemd/system/node_exporter.service << EOF
[Unit]
Description=node_exporter
Documentation=https://prometheus.io/
After=network.target
[Service]
EnvironmentFile=-/etc/sysconfig/node_exporter
Type=simple
User=prometheus
ExecStart=/var/lib/node_exporter/node_exporter
Restart=on-failure
[Install]
WantedBy=multi-user.target
EOF
启动node_exporter
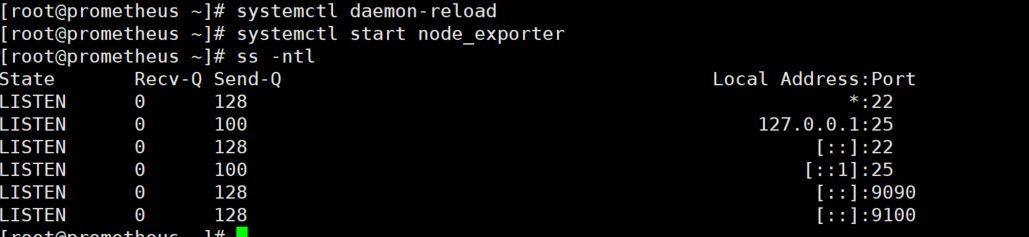
systemctl daemon-reload
systemctl start node_exporter
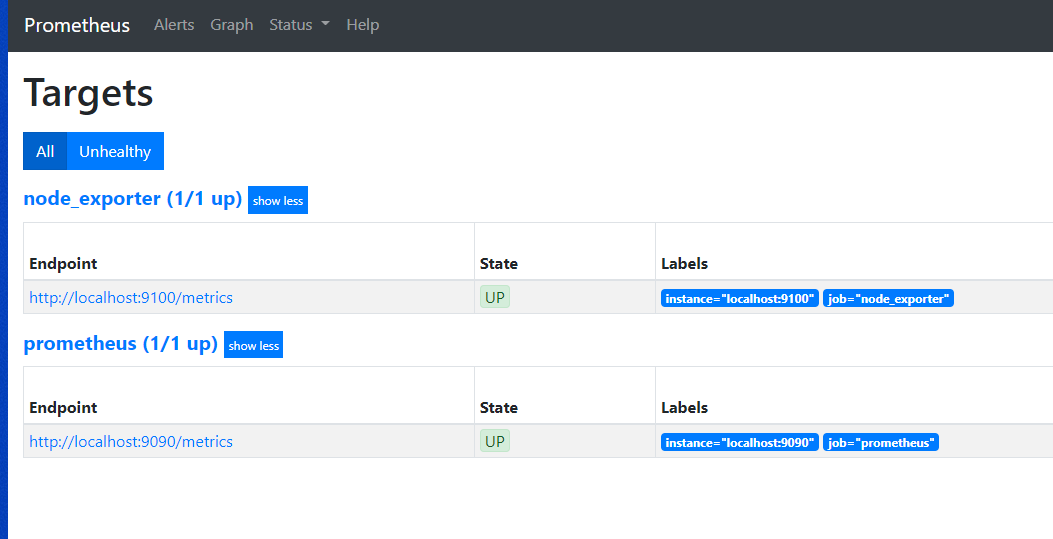
修改prometheus配置
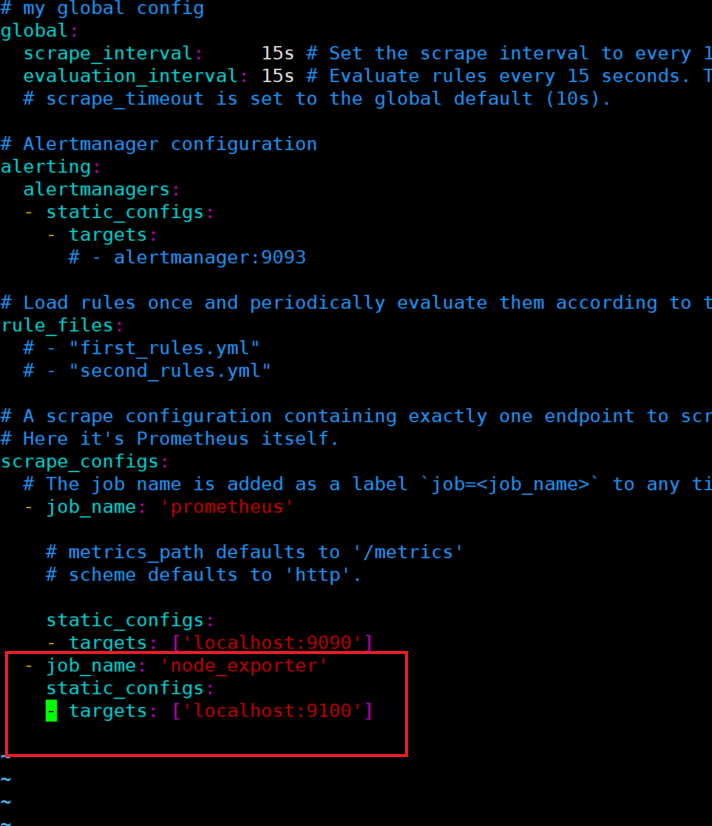
vim /var/lib/prometheus/prometheus.yml
- job_name: 'node_exporter'
    static_configs:
    - targets: ['localhost:9100']
重启Prometheus
systemctl restart prometheus
安装alertmanager
下载
wget https://github.com/prometheus/alertmanager/releases/download/v0.21.0/alertmanager-0.21.0.linux-amd64.tar.gz
tar xvf alertmanager-0.21.0.linux-amd64.tar.gz
mv alertmanager-0.21.0.linux-amd64 /var/lib/alertmanager
创建alertmanager服务
cat > /usr/lib/systemd/system/alertmanager.service << EOF
[Unit]
Description=alertmanager
Documentation=https://prometheus.io/
After=network.target
[Service]
EnvironmentFile=-/etc/sysconfig/alertmanager
Type=simple
User=prometheus
ExecStart=/var/lib/alertmanager/alertmanager \
          --config.file=/var/lib/alertmanager/alertmanager.yml \
          --storage.path=/var/lib/alertmanager/data \
          --data.retention=24h
Restart=on-failure
[Install]
WantedBy=multi-user.target
EOF
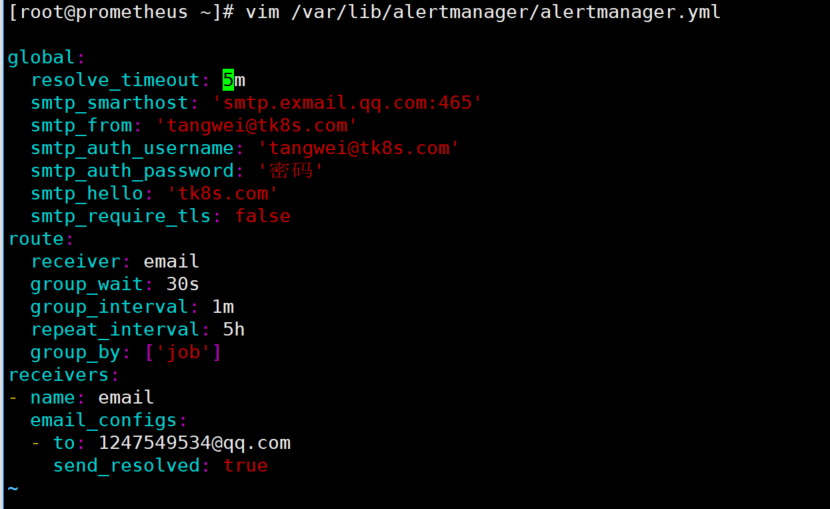
配置alert告警方式
这个实例用邮箱告警
vim /var/lib/alertmanager/alertmanager.yml
global:
  resolve_timeout: 5m
  smtp_smarthost: 'smtp.exmail.qq.com:465'
  smtp_from: 'tangwei@tk8s.com'
  smtp_auth_username: 'tangwei@tk8s.com'
  smtp_auth_password: '密码'
  smtp_hello: 'tk8s.com'
  smtp_require_tls: false
route:
  receiver: email
  group_wait: 30s
  group_interval: 1m
  repeat_interval: 5h
  group_by: ['job']
receivers:
- name: email
  email_configs:
  - to: 1247549534@qq.com
    send_resolved: true
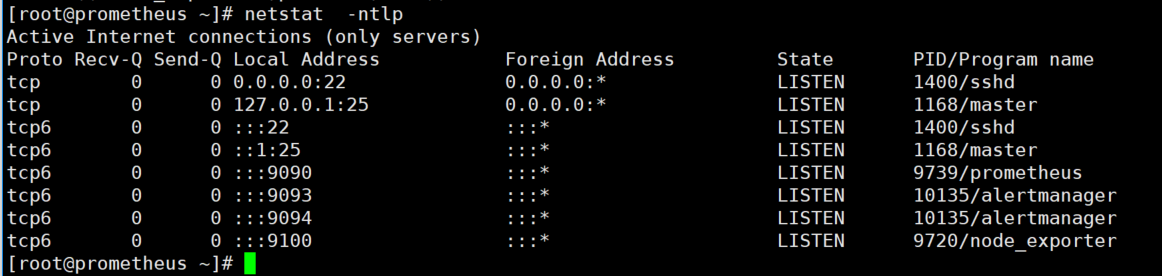
启动alertmanager
chown -R prometheus:prometheus /var/lib/alertmanager/
systemctl daemon-reload
systemctl start alertmanager.service
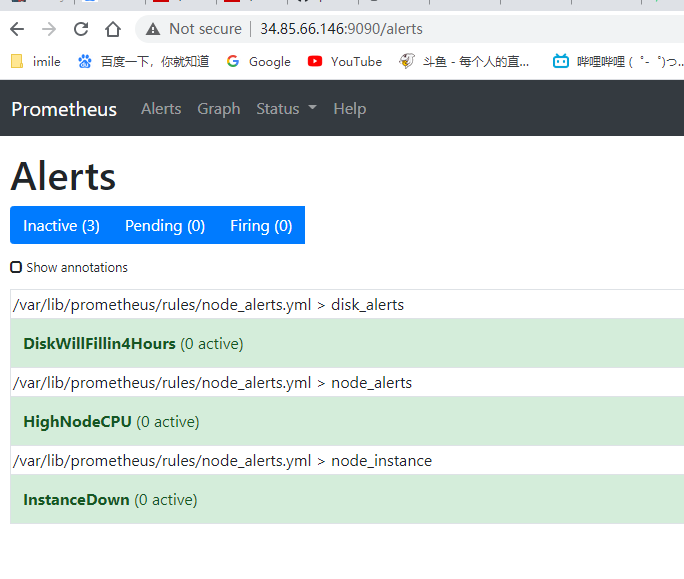
编写rules规则
mkdir /var/lib/prometheus/rules
cat > /var/lib/prometheus/rules/node_alerts.yml <<EOF
groups:
- name: node_alerts                 # 规则名称
  rules:
  - alert: HighNodeCPU              # 告警名称
    expr: instance:node_cpu:avg_rate5m > 4  # 告警条件
    for: 1m                         # 查询时间间隔
    labels:
      severity: warning             # 告警级别
    annotations:                    # 注释
      summary: High Node CPU for 1 hour # 发送告警的内容
      console: Thank you Test
- name: disk_alerts
  rules:
  - alert: DiskWillFillin4Hours
    expr: predict_linear(node_filesystem_free_bytes[1h], 4*3600) < 0
    for: 5m
    labels:
      severity: critical
    annotations:
      summmary: Disk on {{ $labels.instance }} will fill in approximately 4 hours.
- name: node_instance
  rules:
  - alert: InstanceDown
    expr: up{job=~"node.*"} == 0
    for: 1m
    labels:
      severity: critical
    annotations:
      summary: Host {{ $labels.instance }} of {{ $labels.job }} is Down!
EOF
配置prometheus
vim /var/lib/prometheus/prometheus.yml
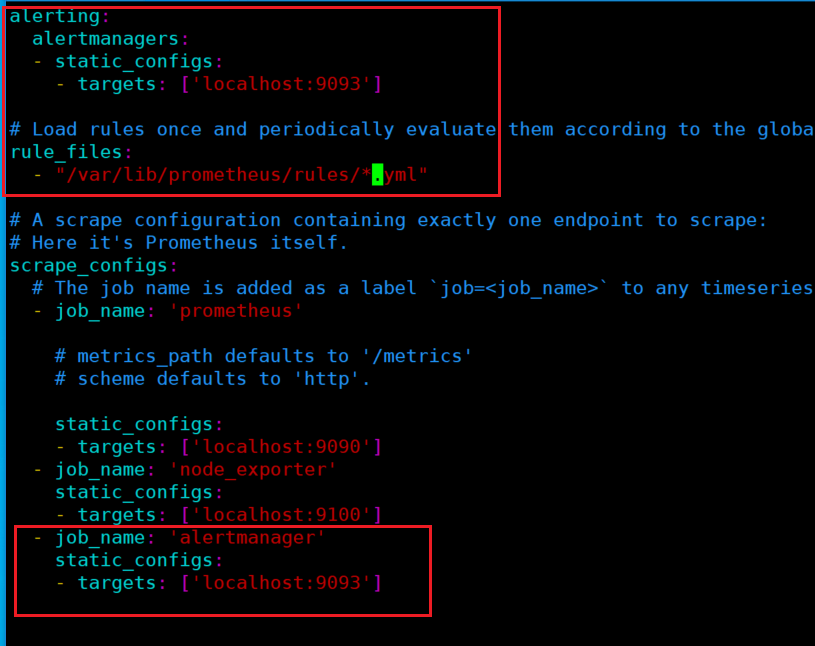
重启prometheus
 chown -R prometheus:prometheus  /var/lib/prometheus/
 systemctl restart prometheus.service
测试关掉node_exproter
systemctl stop node_exporter.service
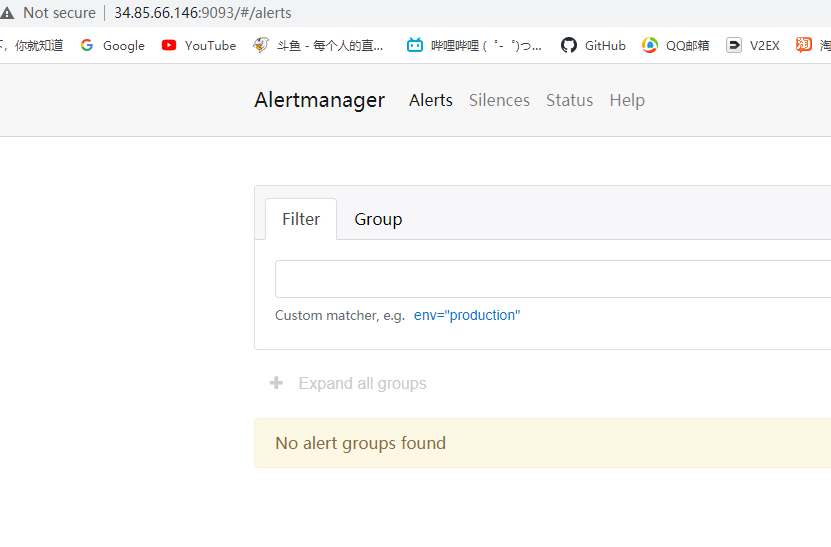
等1分钟,查看告警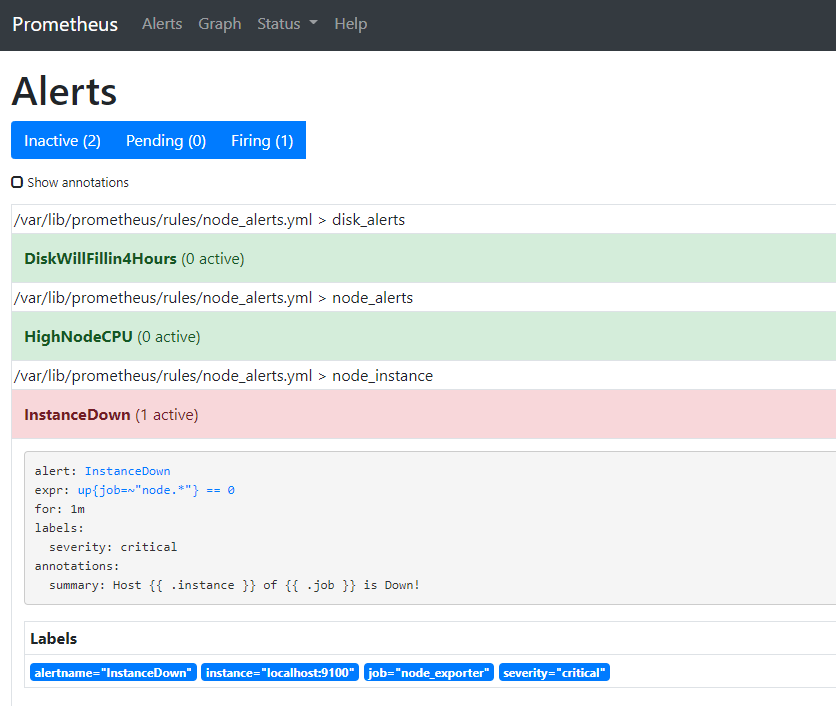
告警已发送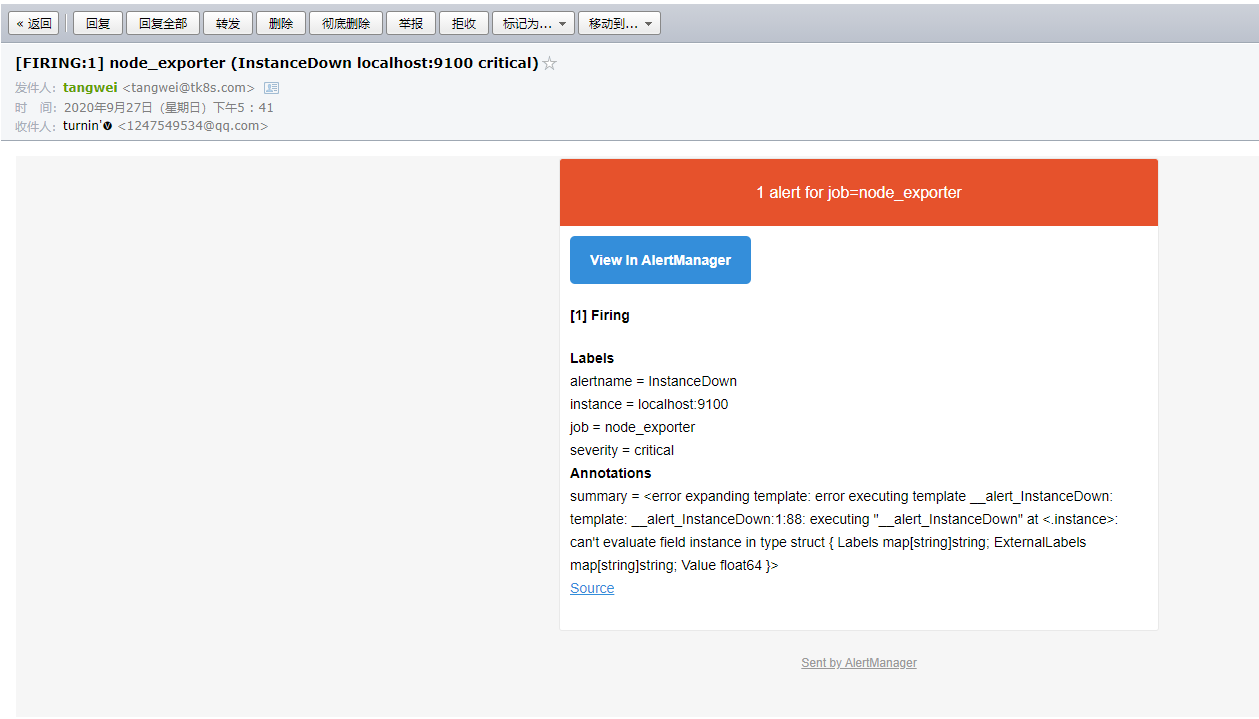
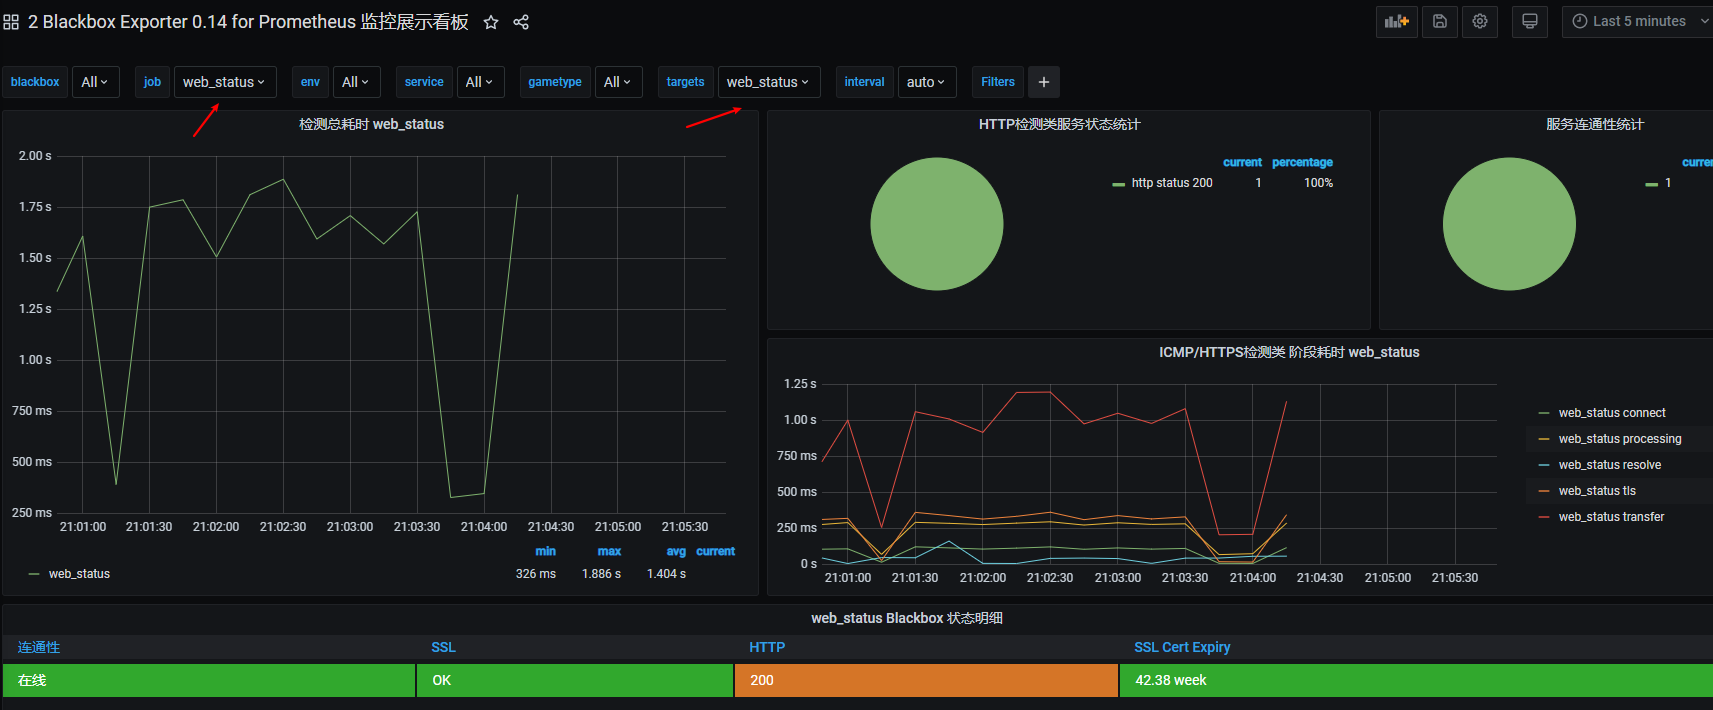
安装black_exporter
wget https://github.com/prometheus/blackbox_exporter/releases/download/v0.17.0/blackbox_exporter-0.17.0.linux-amd64.tar.gz
tar xvf blackbox_exporter-0.17.0.linux-amd64.tar.gz
mv blackbox_exporter-0.17.0.linux-amd64 /var/lib/blackbox_exporter
创建black_exporter服务
cat > /usr/lib/systemd/system/blackbox_exporter.service << EOF
[Unit]
Description=blackbox_exporter
After=network.target
[Service]
EnvironmentFile=-/etc/sysconfig/blackbox_exporter
Type=simple
User=prometheus
ExecStart=/var/lib/blackbox_exporter/blackbox_exporter --config.file=/var/lib/blackbox_exporter/blackbox.yml
Restart=on-failure
[Install]
WantedBy=multi-user.target
EOF
chown -R prometheus:prometheus /var/lib/blackbox_exporter/
启动black_exporter
systemctl start blackbox_exporter.service
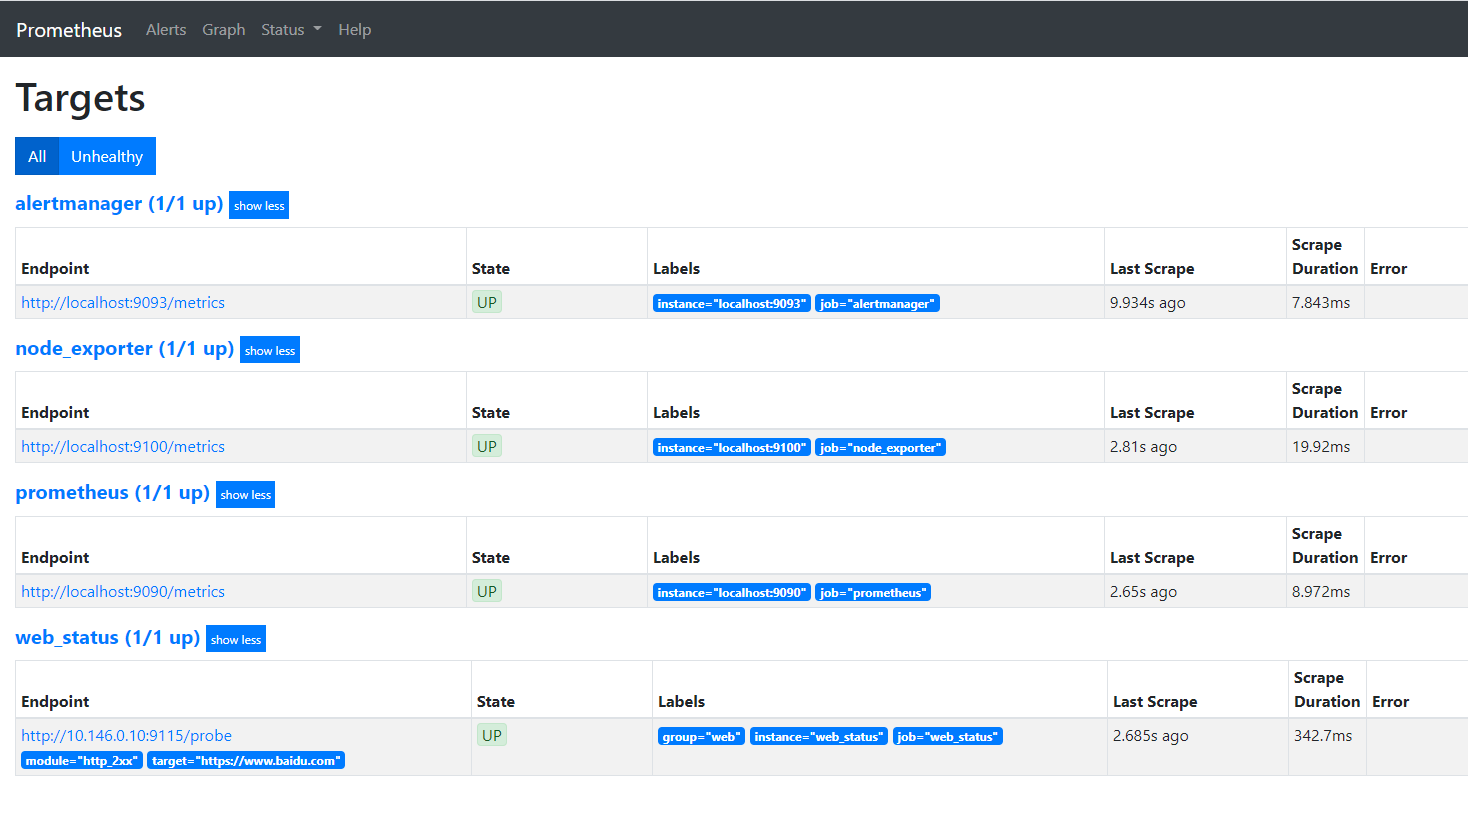
修改Prometheus配置
vim /var/lib/prometheus/prometheus.yml
add job
#监控网站状态
  - job_name: web_status
    metrics_path: /probe
    params:
      module: [http_2xx]
    static_configs:
      - targets: ['https://www.baidu.com']
        labels:
          instance: web_status
          group: web
    relabel_configs:
      - source_labels: [__address__]
        target_label: __param_target
      - target_label: __address__
        replacement: 10.146.0.10:9115
重启prometheus
systemctl restart prometheus.service
安装grafana
下载
wget https://dl.grafana.com/oss/release/grafana-7.2.0-1.x86_64.rpm
yum install grafana-7.2.0-1.x86_64.rpm
启动grafana
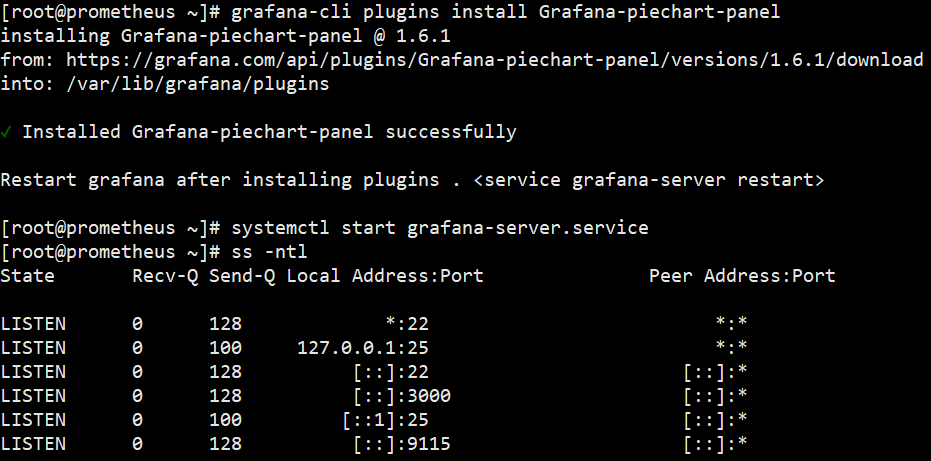
grafana-cli plugins install Grafana-piechart-panel
systemctl start grafana-server.service
访问grafana,账号密码都是admin
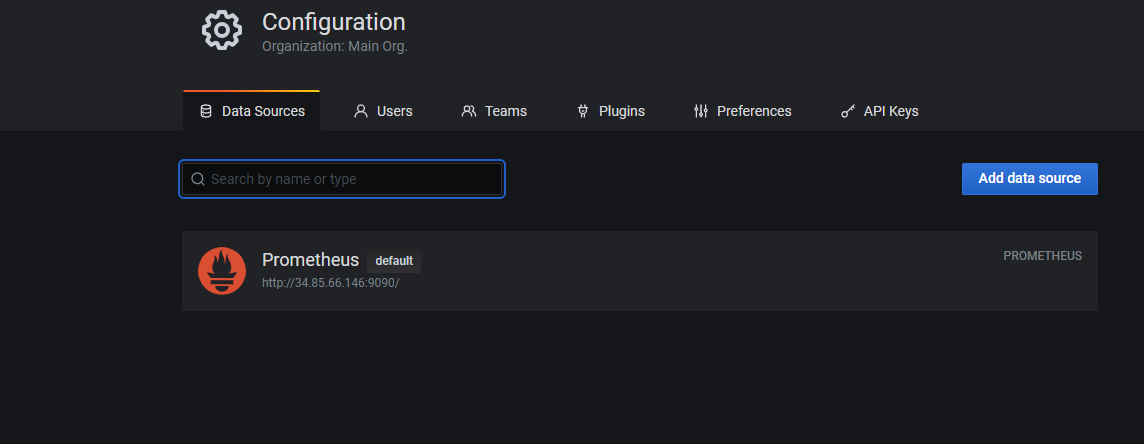
添加数据源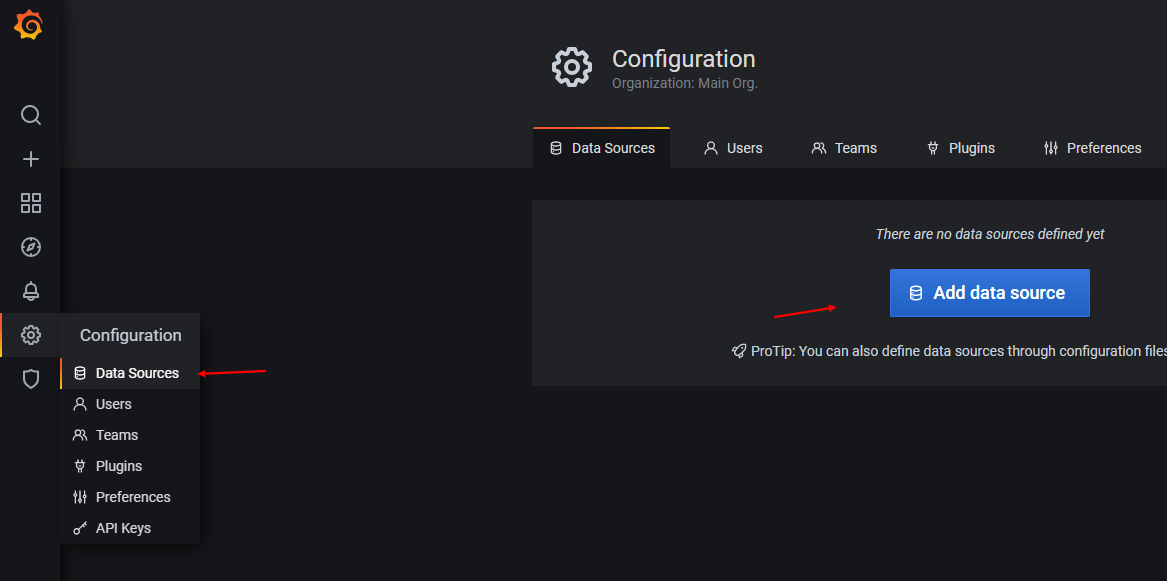
输入prometheus url就行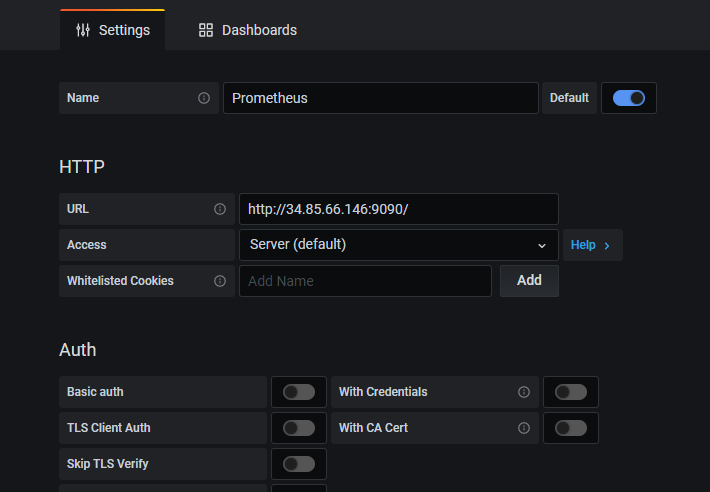
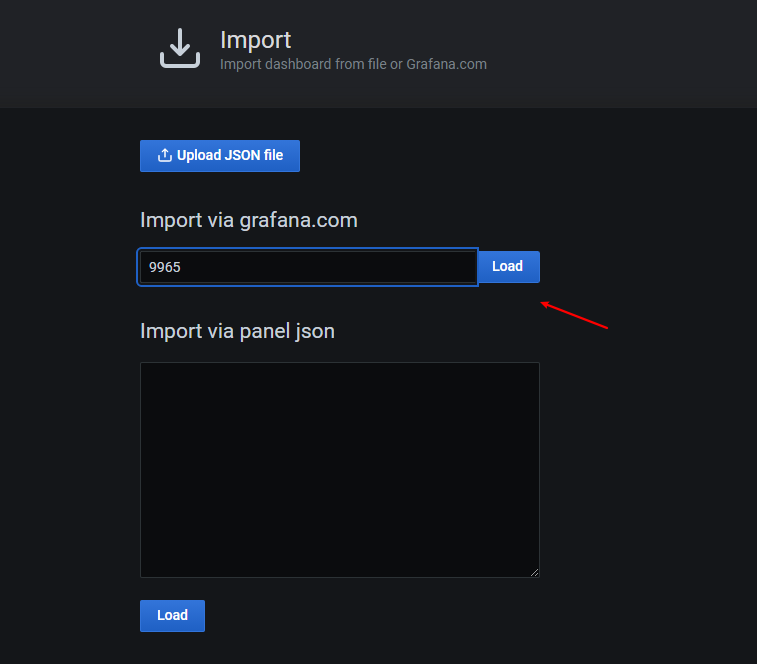
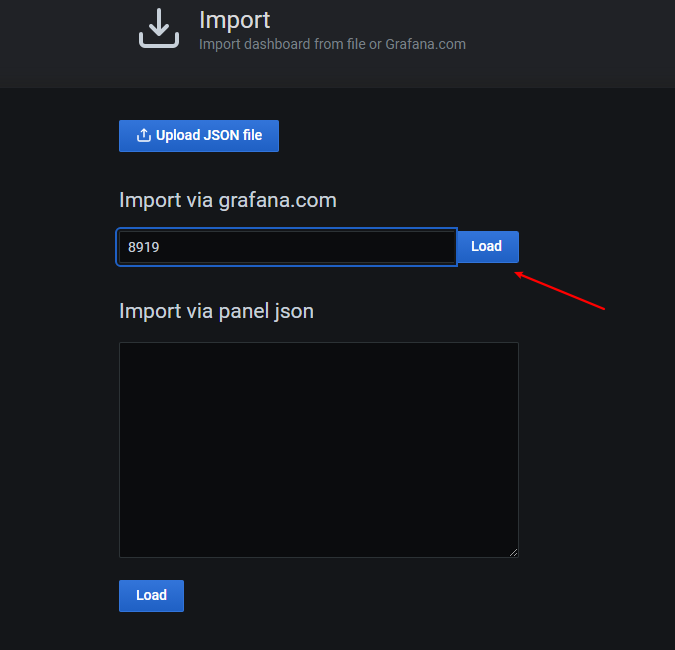
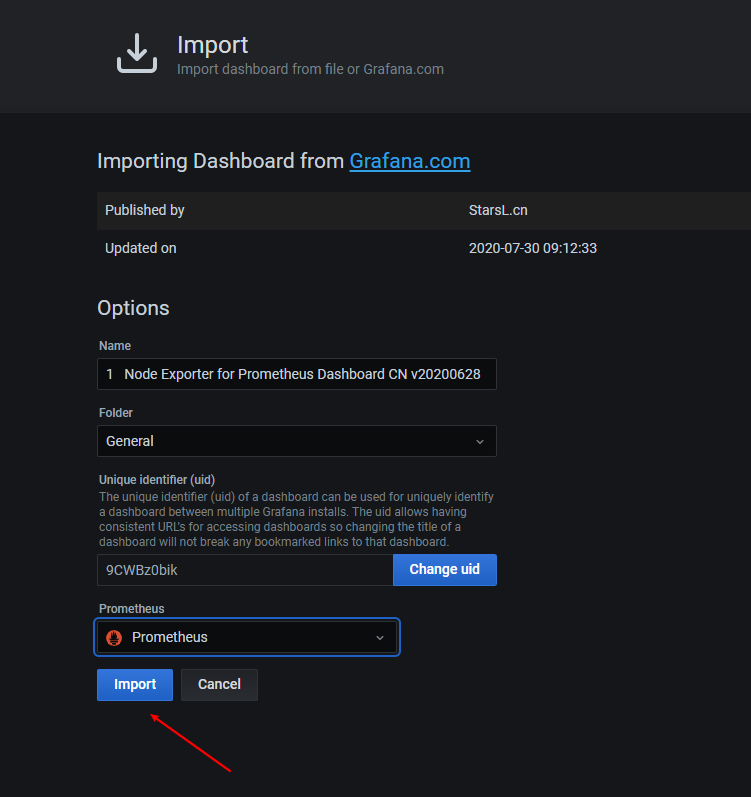
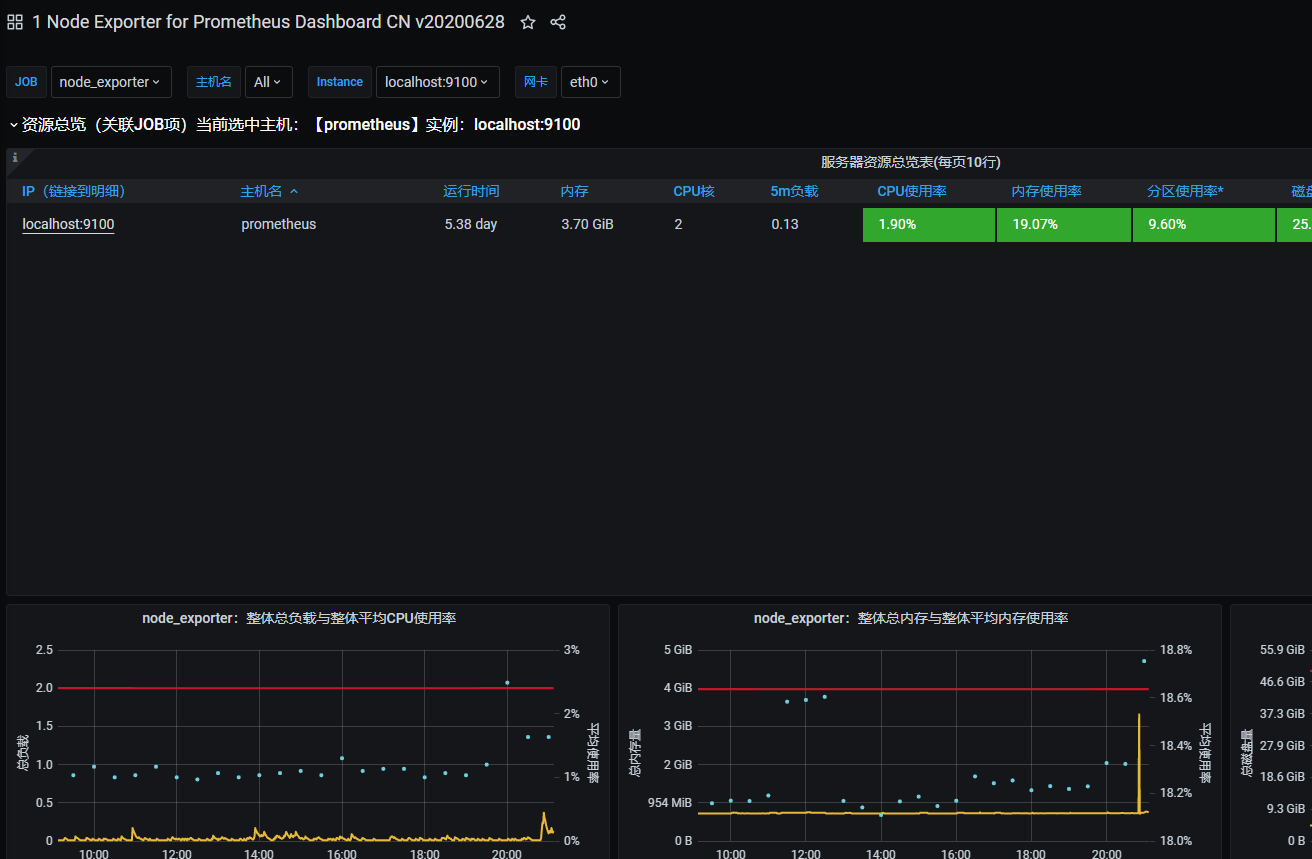
导入dashboard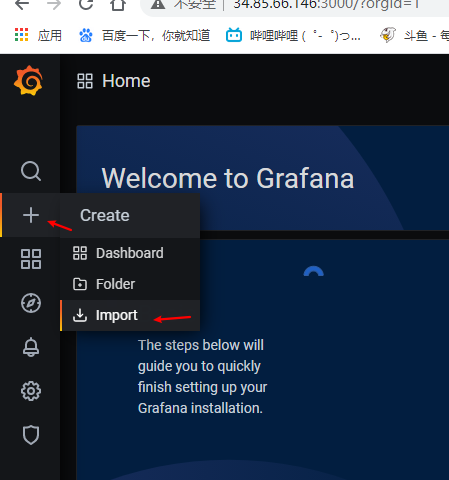

若有收获,就点个赞吧
0 人点赞
