外汇和统计套利
Various forms of pure arbitrage and statistical arbitrage are the basis for almost all quant trading strategies.
When I created this as part of a bank’s proprietary group, our strategies were based on arbitrage and volatility levels between different currencies and interest rate pairs(基于不同货币和利率对之间的套利和波动水平).
We had definite opinions about the level and term structure on volatility in each market, but we’re completely agnostic about the direction of exchange rates and interest rates(我们对每个市场波动的水平和结构有明确的看法,但我们对利率和利率的走向一无所知).
In this section, we’ll take a look at the difference between an exchange arbitrage and a statistical arbitrage. We’ll also look at some of the challenges traders face in managing Stat Arb risk. We will cover each of the steps required to execute exchange or statistical arbitrage. We will then look at how to structure an index arbitrage, and identify the infrastructure the strategy needs. Last, we will take a critical look at the opportunities and challenges that are an integral part of Stat Arb strategies(对机遇和挑战进行批判性分析).
Exchange arbitrage is a form of riskless or pure arbitrage in which the same asset trades on two exchanges with the asking price on one exchange overlapping with the bid price on another exchange(外汇套利是一种无风险或者纯套利形式,同样的资产在两个交易所进行交易,一个交易所的要价和另一个交易所的买入价进行置换). Normally, the bid price is lower than the ask price. In the example you see here, the asking price on Nasdaq is 100 and the bid on NYSE is 100.10 cents, or an Arb profit of 0.10 cents per share. The opportunity to make this type of riskless profit is becomes scarcer as links between exchanges and alternative trading networks gets faster, which reduces the time window in which arbitrage opportunities like these are available(随着交易所和其他交易机构之间的联系越来越快,缩短了此类套利机会可用的时间窗口,获得此类无风险利润的机会越来越少). Also, the increase in high-frequency trading firms specialized in low latency strategies or very fast order execution strategies has reduced the profits available from this type of arbitrage(而且专门从事低延时高频交易的公司或者快速订单执行策略的公司也减少了此类套利的利润).
In carry arbitrage, the acquisition and delivery of an asset are agreed at the same time, but the final delivery of the asset happens at a later date(在套利交易中,资产的收购和交割是在同一时间内完成的,但是资产的最终交割发生在稍晚时间). Carry is the cost of holding and storing an asset, net of any income that the asset pays you(利差是指持有和存储资产的成本,扣除资产中获得的收入). Unlike bonds and stocks, gold only pays a yield if it is leased out, and the rate for a one-year lease on gold is only about 10 basis points right now. The difference between the spot price and the future delivery price is the compensation of the carry trader receives to offset their costs which are funding, storage, and insurance.(现货价格和未来收割之间的差额是套利交易者获得的利差收入,用以抵消其融资、存储和保险的成本)
In the example shown, the total carry is $30 or about two percent of the asset’s price. This would be less by 10 basis points if you’re leasing the gold out. Stat Arb is the most common type of risk Arb strategy and mean reversion is a more formal way of saying buy low, sell high. In this example, you want to trade a stock whose average price has been 100. The issuer is a mature company with limited growth opportunities and you assume the share price will be more or less stable, or more formally, you can model it as a stationary process(发行人公司成熟,增长有限). This is an unusual assumption as most stocks are assumed to have an upward price script due to either profit growth or retaining earnings. The variation of the stock has been five percent over the previous 100 days. So you expect it to vary by the same amount in the future. You create trading rules so that when the stock increases to five percent above its mean, you sell or short it. When it falls to five percent below its mean, you buy it. It seems pretty easy, doesn’t it? Using these rules, you could earn a total profit of 20 based on the buy and sell points marked on the graph. So far so good. But what happens is volatility is greater than expected(实际情况的不稳定性会很大). What happens if you short at 105 and then the price goes to 110? You sell more stock at 110 or do you lock in your loss by covering the short at 110? Similar problem. If you buy the stock for 95 and then the price drops to 90, giving you a five percent loss. Do you buy more at 90 or do you lock in your loss by selling it 90? This is the unavoidable challenge of Stat Arb strategies. If you set your buy and sell levels too close to the current market, you will likely make a transaction, but you’re going to have a low level of confidence that it will end up being profitable. If you set your buy and sell levels too far from the current price, you’re less likely to take a loss, but it’s also less likely that the market is going to reach those levels. So you may never make a trade. Designing a profitable strategy means finding the balance between these extremes and also setting stop-loss orders to preserve your trading capital.
Another common Arb strategy is pairs trading, where you identified two stocks with similar characteristics and go long one and short the other. 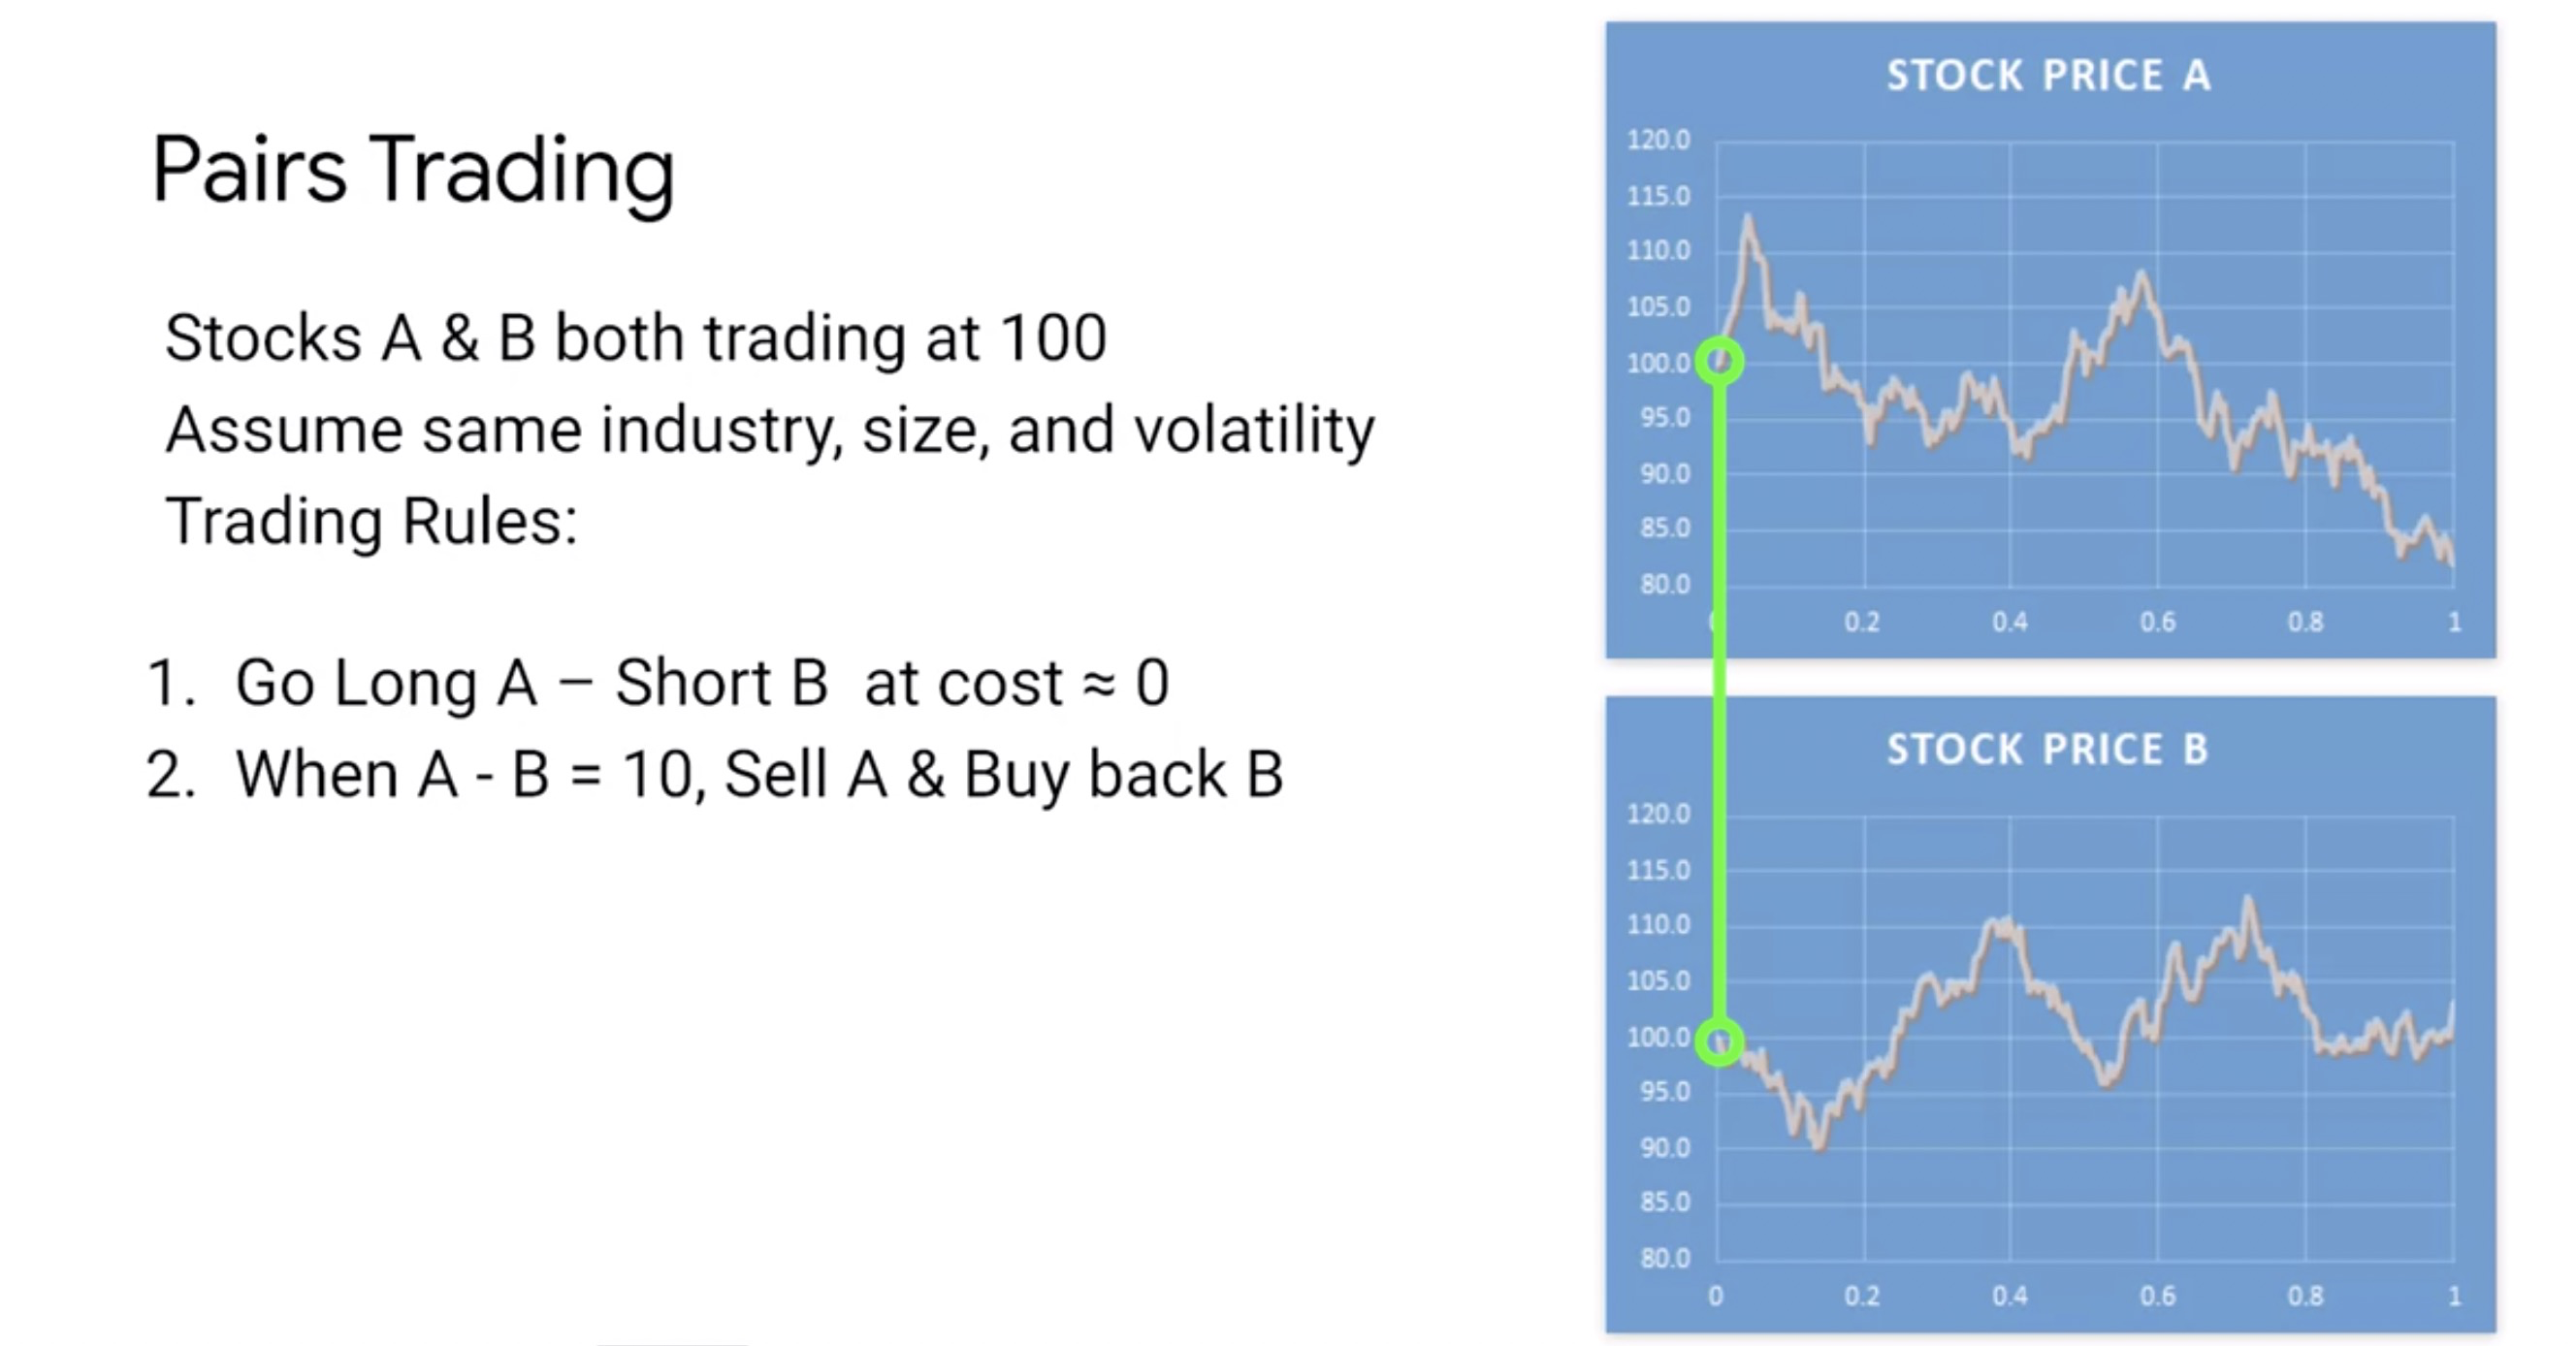
With this example, we assume the stocks are trading at the same price and you were able to finance your purchase of stock A with the proceeds from shorting stock B. In real life, you would have to borrow stock B and you’d have to post part of the proceeds as collateral, but we’re just going to assume you’re able to finance the purchase completely with stock B. The main benefit of this strategy is that since A and B trade in the same market, belong to the same sector of the same industry, you are hedging the industry and sector risks(A和B在同一个交易市场,在同一个行业的同一个领域,所以对冲了行业和领域的风险). So any return that you get will be based only on the strength of the choice you make of which stocks to pair. Your decision about which stock to buy and which stock to sell could be based on either a fundamental evaluation analysis, or on relative historical returns, or correlations, or some combination of all three. You might determine that the fundamental value of A is $10 more than B despite them having the same market price. Or you might have observed that B is outperformed A by 10 percent historically, and going forward, you expect the price of A to catch up to B because you expect their returns to be the same in the long-term. So you buy A for 100 and you sell B for the same price. You are now long the spread between A and B. Almost immediately, A share price increases to 110 while B stays at 100. You sell A and buy B back for a quick $10 profit, and then wait for A and B to be mispriced again which happens when A and B both fall to 95, and you get longer spread again by buying A and shorting B. This time, A’s price drifts and ends up back at 95. Meanwhile, B has rallied to 105 causing you to lose $10 on your short. If you panic and issue a stop-loss order to sell A and buyback B, you will lock in a loss of $10. If instead you decide to write out the trade, you will see your loss increase to $15 when A stays at 95 and B rallies to 110. It would be hard not to cover the trade now as you’ve lost 15 percent of your capital and you will get pressure from your funders. If you’re able to talk them into letting you keep the trade on, your 15 loss eventually transforms into an unrealized seven dollar profit when A rallies to 107 and B falls to 100. By the end of the period, stock A is trading at 83 and stock B at 103 and you have an unrealized loss of $20 on the trade and an overall loss of $10 for the year. Your funders are not happy and you are wishing you issue that stop-loss order or even better had taken that unrealized profit of seven dollars and ended the year up 17. Correlations between stock pairs are notoriously unstable and can move from positive to negative, and then back again depending on what time period you’re looking at. This makes pair trading a fairly risky proposition even though it’s considered fully hedge except for the company or spread risk. Other trade such as pairs of bonds with different maturities and commodities paired with their byproducts have more stable correlations and are potentially better candidates for pairs trading, which is essentially just trading a spread between the price of two related assets.

若有收获,就点个赞吧
0 人点赞
