In this video, we will explore what forecasting is and how to understand some of the terms used in forecasting.
Finally, we will look at how to select the right model for a given dataset and the type of
problem we are asked to solve.
Everyday at all levels of the financial industry, decisions are made about what is likely to happen in the future. Businesses take action today based on yesterday’s data and tomorrow’s expectations.
You can call them expectations, predictions, or projections. It all means one thing: forecasting. We will try to understand terminology(术语) and how to choose the right model for our forecasting needs. Finally, we will look at how we can use BigQuery’s latest edition machine learning to make forecast.
Forecasting is a technique used by businesses for predicting the future based on past information. The forecast can be in terms of either dollars such as revenue or some physical volume such as stock returns or absolute prices.
Predicting, projecting, or estimating some future volume or financial situation is very critical,
and traders use it all the time without realizing that they are performing a forecast. A trader does not buy a stock, for example, without having some expectation of where it’ll be tomorrow, or next week, or next year.
Wikipedia says that forecasting is the process of making predictions of the future based on past and present data and most commonly by analyzing trends. There are two basic ways to make a forecast:
one is a qualitative and the other is quantitative. A qualitative forecast would involve at least two usually multiple rounds of experts answering questions and giving justifications for their answers,
providing the opportunity within grounds for changes and/or revisions.
Qualitative forecasting techniques are subjective based on the opinion and judgment of consumers and experts.
They are appropriate when past data are not available. They’re usually applied to
intermediate or long-range decisions. Examples of qualitative forecasting methods are informed opinion and judgment, market research, and historical life cycle analogy.
On the other hand, quantitative forecasting models are used to forecast future data as a function of past data. They are appropriate to use when past numerical data is available and when it is reasonable to assume that some of the patterns in the data are expected to continue into the future.
These methods are usually applied to short or intermediate range decisions.
On the other hand, a quantitative forecast models the relationship between two or more explanatory variable and a response variable. This can be of two kinds: causal and time series.
In causal models such as regression, we model with a single explanatory variable or a more complex model with multiple variables. You can think of it as fitting a linear equation to observe data or
an exponential function in multidimensional space to multiple data points.
Time series methods, however, use a function of last period’s actual value as a forecast for the future.
You can think of this as technical trading to use trading terms. That is, you’re using past stock prices to predict future stock prices. In one case, we use a simple moving average model which uses an average of a specified number of the most recent observations with each observation receiving the same emphasis or weight. A weighted moving average model on the other hand uses an average of a specified number of the most recent observations with each observation receiving a different emphasis or weight.
There are several variations to using past data. But what we must understand is that in time series models, we use past prices to forecast future prices or past volume to forecast future volume.
Nothing else. To summarize, in both regression and time series forecast, we need to collect data,
organize it, create a model, experiment a lot with it like tweaking it, and finally produce results that we think are acceptable. However, there is a crucial difference. In regression, we use explanatory variables to explain the response which means to predict that variable.
In time series forecast, however, or simply called forecasting, we use past data to predict future data. There is no other variable, explanatory or otherwise. Hope this distinction is clear. Now, let’s look at the way in which we will use both methods to predict stock prices in the future.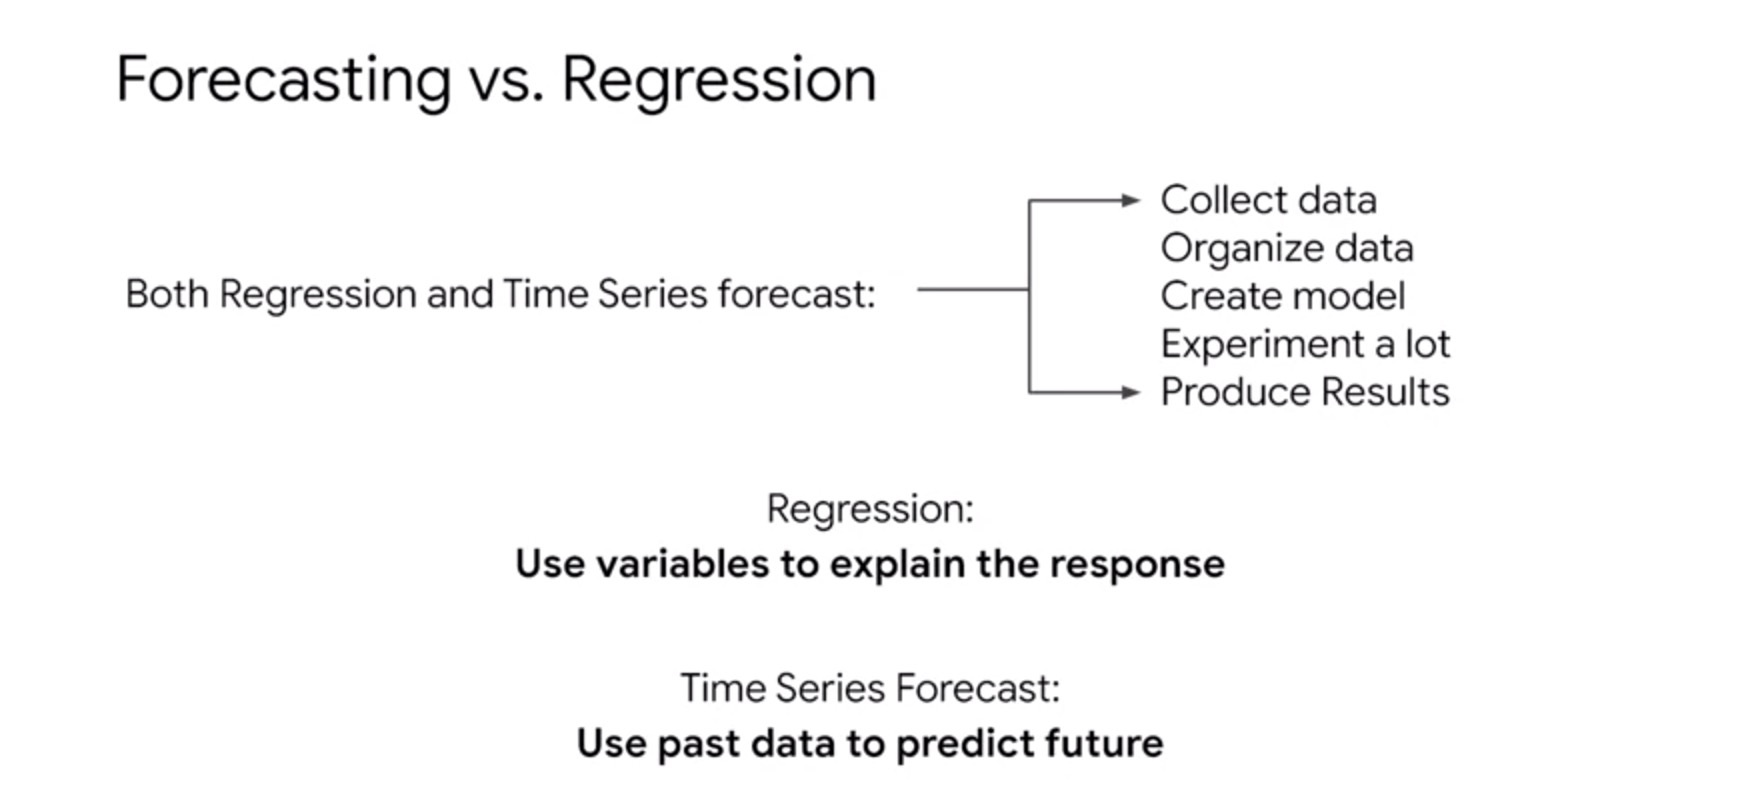
In this section, we will look at what terms are used in forecasting and
what they mean.
Here is a quick scenario where we will be predicting customer lifetime value with the machine learning model. Let’s predict the lifetime value of an e-commerce customer using regression. Our goal is to better target high-value customers to our e-commerce site throughout the customer lifecycle with special promotions and incentives.
After exploring the data, we can provide a number of useful fields to the model,
like the number of different days a visitor has been to our website. How many lifetime page views, how many total visits, what is the average time on site, the total revenue brought in, and the count of
e-commerce transactions on our site.
Now, all that is shown here is basic analytics to get a sense of the data, but
you could feed this historical lifetime value data and use that to predict and power which customers are high-value customers to help you focus and target them for promotions and incentives.
But before we get too deep building models in BigQuery, we first need to define our data terms in the language that data scientists and other machine learning professionals use. Taking the e-commerce example we had in the previous lesson, a record or a row is called an instance or an observation.
In the screenshot you see here, we have eight instances.
A label is the correct answer and will be what you are looking to train the model on with your existing data and predicting with your model on future data.
Here the label is Lifetime Revenue, which is a number we will be trying to predict. Labels could also be things like binary values like high value customer or not as shown here. Knowing what you’re trying to predict a class, a number, etc will greatly influence the type of model you will use later.
Those columns are called features. We have a whole module dedicated to creating machine learning data sets in BigQuery which touches on the critical topic of feature engineering, which is exploring, cleaning, and pre-processing your data before you input it into your machine learning model.
This is often the hardest part of any ML project and why it’s great you already enjoy working with data as analysts. Now, say some new data comes in that you don’t have a label for, we now have a data set of labeled examples and a data set with some unknowns.
Well, this is the fun part, we can draw inference or predict those values with a model. Again, a machine learning model will build a recipe for determining those output values in this case classifying whether that customer is high value or not based on your labeled training data, which is the blue box shown here.
Next up, you’ll learn how to code these models yourself with just SQL.
Your model will learn the way to give each feature as you can see on the screen.
Some features such as distinct days visited have more weight than average session quality.
After the model is trained you can see the relative importance of each field.
A label is the correct answer and will be what you are looking to train the model on with your existing data and predict with your model and future data. Here the label is Lifetime Revenue, which is a number we will be trying to predict. Now, let’s say you have to predict future values of lifetime value for a customer. We now will use past values of LTV for that customer to predict future value. Now say some new data comes in that you don’t have a label for, we now have a data set of labeled examples and a data set with unknowns.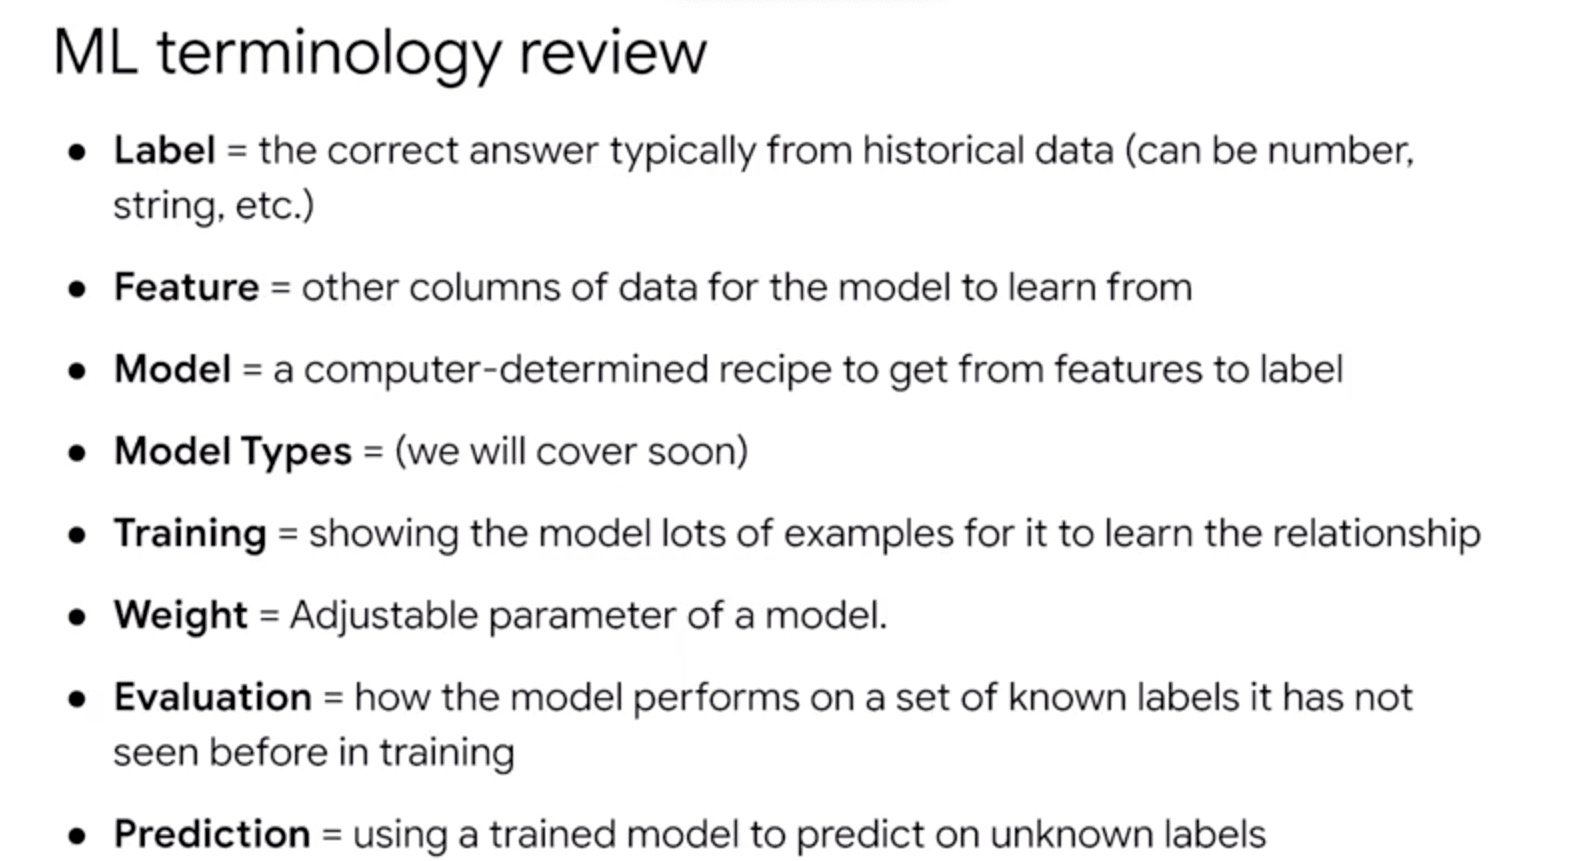

若有收获,就点个赞吧
0 人点赞
