https://social.msdn.microsoft.com/Forums/en-US/9edb3009-25b9-4f16-9775-b672a4834c48/create-chart-from-datagridview?forum=winformsdatacontrols
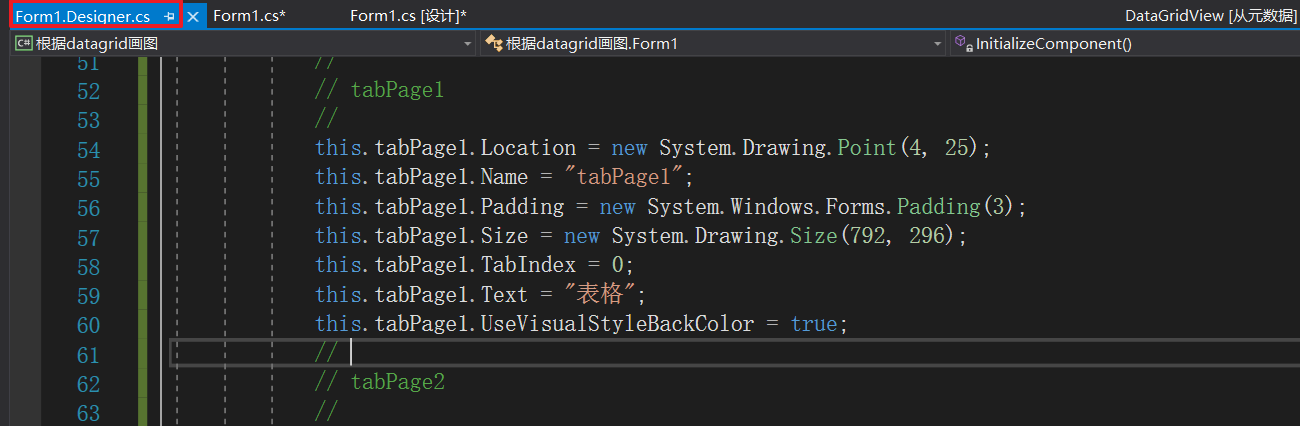
如果我有什么属性会用的话,我可以抄写formdesign里面的啊
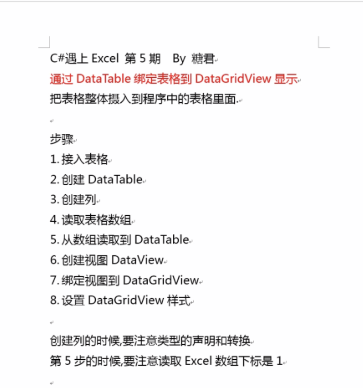
1. DataGridView
1. 常用属性
ColumnCount 列数
Rows.Count 行数
ColumnHeadersDefaultCellStyle 默认列头单元格格式
AutoSizeMode 如何确定列宽或行高
AutoSizeRowsMode 获取或设置一个值,该值指示如何确定行高
AutoSizeColumnsMode 确定列宽
ColumnHeadersBorderStyle 获取应用于列标题的边框样式。
CellBorderStyle 获取应用于单元格的边框样式。
.Columns[0].Name = “Release Date”; 设置列标题
.Columns[4].DefaultCellStyle.Font 设置列默认字体
GridColor 单元格框线颜色
SelectionMode 选择模式
MultiSelect属性 是否允许多选 行 列 单元格
private void SetupDataGridView(){this.Controls.Add(songsDataGridView);songsDataGridView.ColumnCount = 5;// 行标题设置格式songsDataGridView.ColumnHeadersDefaultCellStyle.BackColor = Color.Navy;songsDataGridView.ColumnHeadersDefaultCellStyle.ForeColor = Color.White;songsDataGridView.ColumnHeadersDefaultCellStyle.Font =new Font(songsDataGridView.Font, FontStyle.Bold);//获取或设置一个值,该值指示如何确定行高 ,DisplayedCellsExceptHeaders 标题行高不变songsDataGridView.AutoSizeRowsMode =DataGridViewAutoSizeRowsMode.DisplayedCellsExceptHeaders;songsDataGridView.ColumnHeadersBorderStyle =DataGridViewHeaderBorderStyle.Single;songsDataGridView.CellBorderStyle = DataGridViewCellBorderStyle.Single;songsDataGridView.GridColor = Color.Black;songsDataGridView.RowHeadersVisible = false;songsDataGridView.Columns[0].Name = "Release Date";songsDataGridView.Columns[1].Name = "Track";songsDataGridView.Columns[2].Name = "Title";songsDataGridView.Columns[3].Name = "Artist";songsDataGridView.Columns[4].Name = "Album";songsDataGridView.Columns[4].DefaultCellStyle.Font =new Font(songsDataGridView.DefaultCellStyle.Font, FontStyle.Italic);//选择整行 选择整列songsDataGridView.SelectionMode =DataGridViewSelectionMode.FullRowSelect;//是否允许选择 多个单元格 行 或列songsDataGridView.MultiSelect = false;}
2. 常用事件
1. CellFormatting
CellEndEdit
编辑完单元格后发生
3. 常用方法
Rows.add() 添加一列
private void PopulateDataGridView(){string[] row0 = { "11/22/1968", "29", "Revolution 9","Beatles", "The Beatles [White Album]" };songsDataGridView.Rows.Add(row0);}
Rows.RemoveAt(int a) 移除某列
.Rows.RemoveAt( this.songsDataGridView.SelectedRows[0].Index);
2. DataTable
1. 常用属性
常用事件
常用方法
添加列(列名,列数据类型)
table.Columns.Add(“姓名”, typeof(string));
添加行
var row = table.NewRow();row[0] = "马鸿飞"; //确定行每个单元格的内容 是个数组就能呈现了数据row[1] = Convert.ToDouble(i);table.Rows.Add(row); //添加行
private void button1_Click(object sender, EventArgs e){var table = new DataTable();// 添加列和列数据类型table.Columns.Add("姓名", typeof(string));table.Columns.Add("学号", typeof(double));//添加行 和行数据类型for (int i = 0; i < 10; i++){var row = table.NewRow(); //创建table的行对象 var太好用了 我只需要知道后面的即可row[0] = "马鸿飞"; //确定行每个单元格的内容 是个数组就能呈现了数据row[1] = Convert.ToDouble(i);table.Rows.Add(row); //添加行}//绑定dataGridView1.DataSource = table;// 调整格式--行宽foreach (DataGridViewColumn c in dataGridView1.Columns){c.AutoSizeMode = DataGridViewAutoSizeColumnMode.Fill;}}//=============================================================//将一个打开的excel表格复制到DataGridview中 excel->table->datagridview//添加引用 Microsoft Excel 16.0 Object Libraryusing Excel=Microsoft.Office.Interop.Excel; // needusing System.Runtime.InteropServices;//DataTable接上excelvar ExcelApp = Marshal.GetActiveObject("Excel.Application") as Excel.Application;var st = ExcelApp.ActiveSheet as Excel.Worksheet; //st 就代表了 excel表格var Table = new DataTable(st.Name); //exceltable 就是数据源// 1.添加列 data typeTable.Columns.Add(st.Cells[1, 1].Value.ToString(),typeof(double)); //添加列(列名,列数据类型)Table.Columns.Add(st.Cells[1, 2].Value.ToString(), typeof(string));Table.Columns.Add("日期", typeof(DateTime));//创建二维数组 复制excel数据object[,] SheetArr = st.Range["A2:C40"].Value;// 2.添加行for (int i = 0; i < SheetArr.GetLength(0); i++){var newRow = Table.NewRow();// st 的行复制到table中newRow[0] =Convert.ToDouble(SheetArr[i + 1, 1]) ;newRow[1] = Convert.ToString(SheetArr[i + 1, 2]);newRow[2] = Convert.ToDateTime(SheetArr[i + 1, 3]);Table.Rows.Add(newRow);}// 创建视图dataview 并绑定到datagridview控件// table 绑定到datagridview控件dataGridView1.DataSource = Table;
3. C#读取EXCEL三种方法
方法一:
优点:将Excel直接当做数据源处理,通过SQL直接读取内容,读取速度较快。
缺点:读取数据方式不够灵活,无法直接读取某一个单元格,只有将整个Sheet页读取出来后(结果为Datatable)再在Datatable中根据行列数来获取指定的值。
当Excel数据量很大时。会非常占用内存,当内存不够时会抛出内存溢出的异常。
HDR=Yes,这代表第一行是标题,不做为数据使用,系统默认的是YES
当IMEX=0时为“汇出模式”,这个模式开启的Excel档案只能用来做“写入”用途。0一输出模式;
当IMEX=1时为”汇入模式“,这个模式开启的Excel档案只能用来做”读取”用途。 1—输入模式;
当IMEX-2时为“链接模式”,这个模式开启的Excel档案可同时支持”读取”与”写入”用途。2—链接模式(完全更新能力)
原来OLEDB会根据表中数据的前8行来决定该列的类型。
**
//根据excle的路径把第一个sheel中的内容放入datatablepublic static DataTable ReadExcelToTable(string path)//excel存放的路径{try{//连接字符串string connstring = "Provider=Microsoft.ACE.OLEDB.12.0;Data Source=" + path + ";Extended Properties='Excel 12.0;HDR=YES;IMEX=1';"; // Office 07及以上版本 不能出现多余的空格 而且分号注意// string connstring =" Provider=Microsoft.JET.OLEDB.4.0;Data Source=" + path + ";Extended Properties='Excel 8.0;HDR=NO;IMEX=1';"; //Office 07以下版本using (OleDbConnection conn = new OleDbConnection(connstring)){conn.Open();DataTable sheetsName = conn.GetOleDbSchemaTable(OleDbSchemaGuid.Tables, new object[] { null, null, null, "Table" }); //得到所有sheet的名字string firstSheetName = sheetsName.Rows[0][2].ToString(); //得到第一个sheet的名字string sql = string.Format("SELECT * FROM [{0}]", firstSheetName); //查询字符串//string sql = string.Format("SELECT * FROM [{0}] WHERE [日期] is not null", firstSheetName); //查询字符串OleDbDataAdapter ada = new OleDbDataAdapter(sql, connstring);DataSet set = new DataSet();ada.Fill(set);conn.Close();return set.Tables[0];}}catch (Exception err){MessageBox.Show("数据绑定Excel失败!失败原因:" + err.Message, "提示信息",MessageBoxButtons.OK, MessageBoxIcon.Information);return null;}}//==========================================================================================//读取excel文件对话框 并将数据输出到datagridviewprivate void button2_Click(object sender, EventArgs e){OpenFileDialog openFileDialog1 = new OpenFileDialog();openFileDialog1.InitialDirectory = "I:\\";openFileDialog1.Filter = "Excel文件|*.xls|Excel文件|*.xlsx|Excel宏文件|*.xlsm";openFileDialog1.Title = "打开";openFileDialog1.FilterIndex = 2; // 默认打开文件类型为 xlsx格式openFileDialog1.RestoreDirectory = true;if (openFileDialog1.ShowDialog() == DialogResult.OK){ExcalPath = openFileDialog1.FileName;}if (ExcalPath == null){MessageBox.Show("文件不存在!");return;}else{dataGridView1.DataSource = GetDataFromExcel.ReadExcelToTable(ExcalPath); // 直接读取excel文件foreach (DataGridViewColumn g in dataGridView1.Columns){g.AutoSizeMode = DataGridViewAutoSizeColumnMode.Fill;}MessageBox.Show("导入成功!");}}
说明:C#以oledb的方式读取excel时,xls格式的文件读取正常,但是xlsx格式的提示错误:未在本地计算机上注册”microsoft.ACE.oledb.12.0”提供程序
解决方法:
解决办法:
1、下载对应组件安装:https://www.microsoft.com/zh-CN/download/details.aspx?id=13255注意:要选择AccessDatabaseEngine.exe,而不是AccessDatabaseEngine64.exe,否则还会提示错误!!!
2、控制面板-管理工具中打开IIS(如果没,在控制面板程序与功能-启用或关闭windows功能-选择IIS功能),设置如下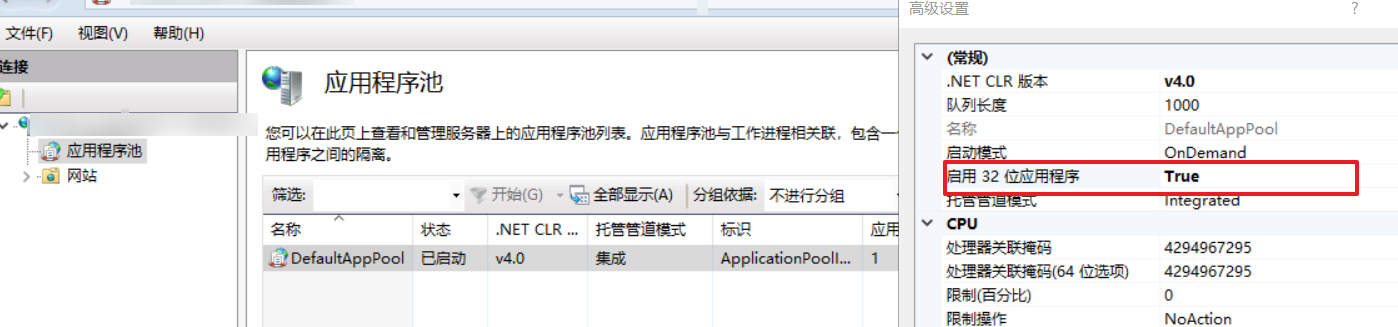

前提是看服务器是x64的还是x86的,x64的服务器两个版本都能安装;如果下载安装的是x64的,那么你的桌面程序就要选择anycpu或x64发布,而web项目是不兼容的,不管你是如何发布的;如果下载安装的是x86的,那么你的桌面程序就要选择x86发布,而web项目正常发布就好;
总结:如果你是web项目,你就下载x86的,发布选anycpu就好了,然后设置应用程序池32位兼容就好了;
最后说一句,用这个,是不需要安装office软件的;
方法二:
引用的com组件:Microsoft.Office.Interop.Excel.dli取EXCEL文件首先是Excel.dll的获取将Office安装目录下的Excel.exe文件Copy到DotNet的bin目录下,cmd到该目录下,运行TIblmp EXCELEXE Excel.dll得到DII文件。再在项目中添加引用该d文件.
优点:能够非常灵活的读取Excel中的数据,用户可以灵活的调用各种函数进行处理。
缺点:基于单元格的处理,读取速度较慢,对于数据量较大的文件最好不要使用此种方式读取。
需要添加相应的DLL引用,必须存在此引用才可使用,如果是Web站点部署在IIS上时,还需要服务器机子已安装了Excel,有时候还需要为配置II权限。
//读取EXCEL的方法   (用范围区域读取数据)
private void OpenExcel(string strFileName)
{
    object missing = System.Reflection.Missing.Value;
    Application excel = new Application();//lauch excel application
    if (excel == null)
    {
        Response.Write("<script>alert('Can't access excel')</script>");
    }
    else
    {
        excel.Visible = false; excel.UserControl = true;
        // 以只读的形式打开EXCEL文件
        Workbook wb = excel.Application.Workbooks.Open(strFileName, missing, true, missing, missing, missing,
         missing, missing, missing, true, missing, missing, missing, missing, missing);
        //取得第一个工作薄
        Worksheet ws = (Worksheet)wb.Worksheets.get_Item(1);


        //取得总记录行数   (包括标题列)
        int rowsint = ws.UsedRange.Cells.Rows.Count; //得到行数
        //int columnsint = mySheet.UsedRange.Cells.Columns.Count;//得到列数


        //取得数据范围区域 (不包括标题列)
        Range rng1 = ws.Cells.get_Range("B2", "B" + rowsint);   //item


        Range rng2 = ws.Cells.get_Range("K2", "K" + rowsint); //Customer
        object[,] arryItem= (object[,])rng1.Value2;   //get range's value
        object[,] arryCus = (object[,])rng2.Value2;
        //将新值赋给一个数组
        string[,] arry = new string[rowsint-1, 2];
        for (int i = 1; i <= rowsint-1; i++)
        {
            //Item_Code列
            arry[i - 1, 0] =arryItem[i, 1].ToString();
            //Customer_Name列
            arry[i - 1, 1] = arryCus[i, 1].ToString();
        }
        Response.Write(arry[0, 0] + " / " + arry[0, 1] + "#" + arry[rowsint - 2, 0] + " / " + arry[rowsint - 2, 1]);
    }
     excel.Quit(); excel = null;
    Process[] procs = Process.GetProcessesByName("excel");


    foreach (Process pro in procs)
    {
        pro.Kill();//没有更好的方法,只有杀掉进程
    }
    GC.Collect();
}
方法三:
将EXCEL文件转化成CSV(逗号分隔)的文件,用文件流读取(等价就是读取一个txt文本文件)。
4.Chart
命名空间
using System.Windows.Forms.DataVisualization.Charting;
chart常用属性和集合
https://blog.csdn.net/qq_27825451/article/details/81305387
TickMark刻度线类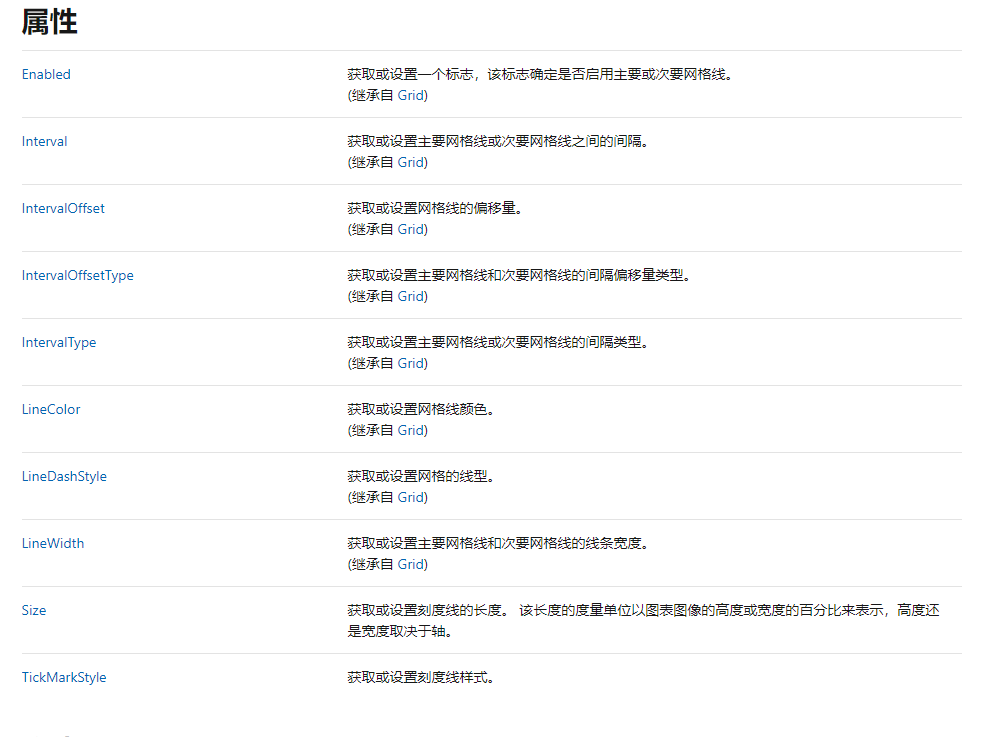
常用属性
series
chart.Series.Add(serise); //添加曲线
serise.Color = Color.Red;
serise.Name="时间-压力";
serise.BorderWidth = 3;
series1.BorderDashStyle = ChartDashStyle.Dash; // 虚线 点线 实线
serise.ChartType = SeriesChartType.Spline; //曲线图
for (int i = 0; i < data.RowCount-1; i++)
{
chart.Series["时间-压力"].Points.AddXY(time[i],pressure[i]); //addxy 添加数据到集合点后
}
///////////////////////////////Series属性设置///////////////////////////////
//设置显示类型-线性
this.chart1.Series["随机数"].ChartType = SeriesChartType.Line;
this.chart1.Series["随机数"].BorderDashStyle = ChartDashStyle.Dash;
// this.chart1.Series["随机数"].ChartType = SeriesChartType.Column;
// 设置坐标轴显示类型
this.chart1.Series["随机数"].XValueType = ChartValueType.Time;
//是否显示标签的数值
this.chart1.Series["随机数"].IsValueShownAsLabel = true;
// 设置标签的图形
this.chart1.Series["随机数"].MarkerStyle = MarkerStyle.Cross;
//设置图案的宽度
this.chart1.Series["随机数"].MarkerSize = 2;
//设置图案的颜色
this.chart1.Series["随机数"].MarkerBorderColor = Color.Red;
//设置曲线的粗细
this.chart1.Series["随机数"].BorderWidth = 3;
//设置阴影的颜色
this.chart1.Series["随机数"].ShadowColor = Color.DarkGray;
//阴影位置的角度
this.chart1.Series["随机数"].ShadowOffset = 2;
//==========================================================================
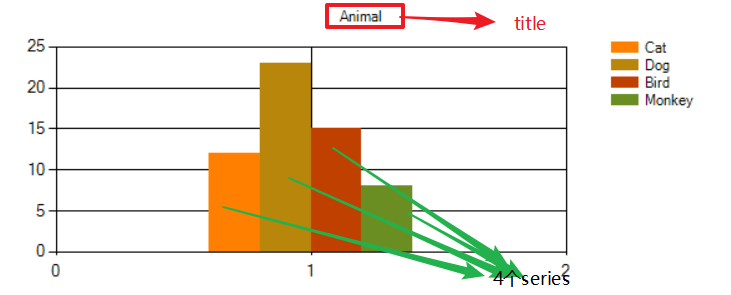
// 添加多个series
string[] seriesArr = { "Cat", "Dog", "Bird", "Monkey" };
double[] pointArr = { 12, 23, 15, 8 };
for (int i = 0; i < seriesArr.Length; i++)
{
Series series = this.chart2.Series.Add(seriesArr[i]); // 最终
series.Points.Add(pointArr[i]);
}
ChartArea
    chartArea1.Name = "ChartArea1";
    this.chart2.ChartAreas.Add(chartArea1);
    chartArea.BackColor = Color.AliceBlue;

    ////设置网格的颜色  垂直于x轴、y轴线的颜色
    this.chart1.ChartAreas["ChartArea1"].AxisX.MajorGrid.LineColor = Color.Red;
    this.chart1.ChartAreas["ChartArea1"].AxisY.MajorGrid.LineColor = Color.Green;

    // 设置坐标轴的名字
    this.chart1.ChartAreas["ChartArea1"].AxisX.Title= "随机数";
    this.chart1.ChartAreas["ChartArea1"].AxisY.Title = "数值";

    //设置坐标轴线箭头
    this.chart1.ChartAreas["ChartArea1"].AxisX.ArrowStyle = AxisArrowStyle.Triangle;
    this.chart1.ChartAreas["ChartArea1"].AxisY.ArrowStyle = AxisArrowStyle.Triangle;

    //  坐标轴间隔
    this.chart1.ChartAreas["ChartArea1"].AxisY.Interval = 20;         //  坐标轴间隔  0 20 40 60

    //坐标轴刻度线 TickMark类
    TickMark majorTick = new TickMark();
    majorTick.TickMarkStyle = TickMarkStyle.InsideArea ;
    majorTick.Interval = Math.Log10(20);
    this.chart1.ChartAreas["ChartArea1"].AxisY.MajorTickMark = majorTick;

    ////啟用3D顯示
    this.chart1.ChartAreas["ChartArea1"].Area3DStyle.Enable3D = false;
Legend
    legend1.Name = "Legend1";
    this.chart2.Legends.Add(legend1); //添加图例
    series1.Legend = "Legend1";  // 曲线的图例
Title
   // Set title  Title类
    this.chart2.Titles.Add("Animal");

    //chart1.Titles.Add("柱状图");
    Title title = new Title();  //Title 也是一个类
    title.Text = "柱状图";
    title.Font = new Font("黑体", 12, FontStyle.Bold);
    chart1.Titles.Add(title);
Annotation
palette
// Set 调色板
    this.chart2.Palette = ChartColorPalette.EarthTones;
常用事件
常用方法
//series添加数据 一个一个添加
this.chart2.Series["income"].Points.AddXY("Sep", 12);
// 循环添加
    for (int i = 0; i < data.RowCount-1; i++)
{
    chart.Series["时间-压力"].Points.AddXY(time[i],pressure[i]); //addxy 添加数据到集合点后
}
保存为图片
chart2.SaveImage(savePic.FileName, format); / /saveimage(文件名,文件格式)
private void button2_Click(object sender, EventArgs e)
        {

            //creat a savefile dialog
            SaveFileDialog savePic = new SaveFileDialog();
            savePic.InitialDirectory = "D:\\";

            //保存图片格式
            savePic.Filter= "Bitmap (*.bmp)|*.bmp|JPEG (*.jpg)|*.jpg|EMF (*.emf)|*.emf|PNG (*.png)|*.png|GIF (*.gif)|*.gif|TIFF (*.tif)|*.tif";
            savePic.FilterIndex = 2;
            savePic.RestoreDirectory = true;

            //Set image file format
            if (savePic.ShowDialog()==DialogResult.OK)
            {
                var format = ChartImageFormat.Bmp;
                if (savePic.FileName.EndsWith("bmp"))
                {
                    format = ChartImageFormat.Bmp;
                }
                else if(savePic.FileName.EndsWith("jpg"))
                {
                    format = ChartImageFormat.Jpeg;
                }
                else if (savePic.FileName.EndsWith("emf"))
                {
                    format = ChartImageFormat.Emf;
                }
                else if (savePic.FileName.EndsWith("png"))
                {
                    format = ChartImageFormat.Png;
                }
                else if (savePic.FileName.EndsWith("gif"))
                {
                    format = ChartImageFormat.Gif;
                }
                else if (savePic.FileName.EndsWith("tif"))
                {
                    format = ChartImageFormat.Tiff;
                }

                // 保存图片
                chart2.SaveImage(savePic.FileName, format);

            }

        }
  public partial class Form1 : Form
    {
        public Form1()
        {
            InitializeComponent();
        }

        DataGridView data = new DataGridView();  //生成datagridview实例

        Chart chart = new Chart();
        ChartArea chartArea = new ChartArea();
        Series serise = new Series();
        Series dpt = new Series();
        Legend legend = new Legend();

        List<int> time = new List<int>();
        List<double> pressure = new List<double>();
        List<double> dpre_dlnt = new List<double>();

        private void button1_Click(object sender, EventArgs e)
        {
            data.Size = new Size(600, 500);  // 表格大小
            data.Location = new Point(1, 1);
            data.Anchor = AnchorStyles.Left | AnchorStyles.Top;
            data.BackgroundColor = Color.BurlyWood;
            data.Font = new Font("Times New Roman", 14.0f);


            //设置列数据
            data.ColumnCount = 3; //2 列
            data.ColumnHeadersVisible = true;  //列头数据显示
            data.Columns[0].Name = "时间";
            data.Columns[1].Name = "压力";
            data.Columns[2].Name = "压力导数";

            //单元格格式
            DataGridViewCellStyle columnHeaderStyle = new DataGridViewCellStyle();
            columnHeaderStyle.Font = new Font("Verdana", 10, FontStyle.Bold);
            columnHeaderStyle.BackColor = Color.White;
            data.ColumnHeadersDefaultCellStyle = columnHeaderStyle; //列头的默认格式

            data.RowCount = 7; //7 行数据
            //生成数据
            ProduceData();

            //操作表格结束后,触发事件
            data.CellEndEdit += (sender1, args) =>
            {
                UpdateData();
            }
            ;
            tabPage1.Controls.Add(data);

        }


        public void ProduceData()
        {
            //生成数据 ,我每次操作这个东西就可
            for (int i = 0; i < data.RowCount - 1; i++)
            {
                int t = Convert.ToInt32(Math.Exp(i + 1));
                double p = 0.5 * Math.Log(t) + 0.809;
                double dp = 0.5;
                data.Rows[i].Cells[0].Value = t;
                data.Rows[i].Cells[1].Value = p;
                data.Rows[i].Cells[2].Value = dp;
                time.Add(t);
                pressure.Add(p);
                dpre_dlnt.Add(dp);
            }
        }

        public void UpdateData()
        {
            time.Clear();
            pressure.Clear();
            dpre_dlnt.Clear();
            for (int i = 0; i < data.RowCount - 1; i++)
            {

                int t = Convert.ToInt32(data.Rows[i].Cells[0].Value);
                double p = Convert.ToDouble(data.Rows[i].Cells[1].Value);
                double dp = Convert.ToDouble(data.Rows[i].Cells[2].Value);
                time.Add(t);
                pressure.Add(p);
                dpre_dlnt.Add(dp);
            }

        }

        private void button2_Click(object sender, EventArgs e)
        {

            // 添加图表
            //属性设置
            chart.Location = new Point(100, 50);
            chart.Size = new Size(600, 300);
            chart.BackColor = Color.BurlyWood;
            chart.Anchor = AnchorStyles.Left | AnchorStyles.Top;


            chart.ChartAreas.Add(chartArea); //添加图表区域
            chartArea.BackColor = Color.AliceBlue;

            chart.Series.Add(serise);     //添加曲线
            serise.Color = Color.Red;
            serise.Name="时间-压力";
            serise.BorderWidth = 3;
            serise.ChartType = SeriesChartType.Spline;  //曲线图
            for (int i = 0; i < data.RowCount-1; i++)
            {
                chart.Series["时间-压力"].Points.AddXY(time[i],pressure[i]); //addxy 添加数据到集合点后
                    }

            // 同一个图上再加一条线
            chart.Series.Add(dpt);
            dpt.Color = Color.DarkBlue;
            dpt.BorderWidth = 3;
            dpt.Name = "时间-压力导数";
            dpt.ChartType = SeriesChartType.Line;
         //   dpt.ChartType = SeriesChartType.RangeBar;  //?
            for (int i = 0; i < data.RowCount-1; i++)
            {
                chart.Series["时间-压力导数"].Points.AddXY(time[i],dpre_dlnt[i]);
            }

            chart.Legends.Add(legend);  //添加图例
            tabPage2.Controls.Add(chart);  //tabPage 添加图表

            //更新图表的按钮
            Button button = new Button();
            tabPage2.Controls.Add(button);
            button.Text = "更新图表";
            button.Size = new Size(100, 50);
            button.Location = new Point(0, 0);

            button.Click += (sender1, args) =>
            {
                UpdateChart();
            };

        }


        public void UpdateChart()
        {
            chart.Series[0].Points.Clear();
            chart.Series[0].Points.Clear();
            for (int i = 0; i < data.RowCount - 1; i++)
            {
                chart.Series["时间-压力"].Points.AddXY(time[i], pressure[i]); //addxy 添加数据到集合点后
                chart.Series["时间-压力导数"].Points.AddY(dpre_dlnt[i]);
            }

        }

    }
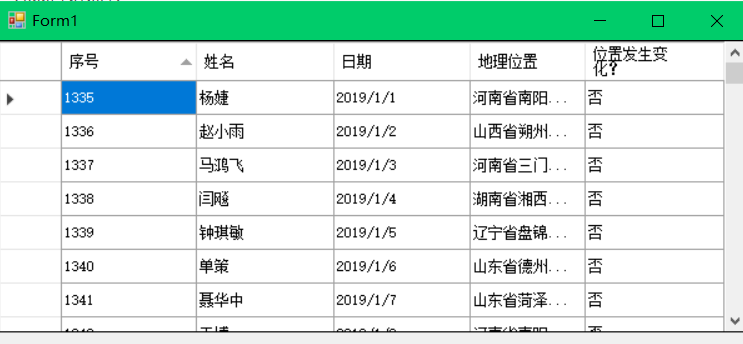
 datagridvie的各个区域
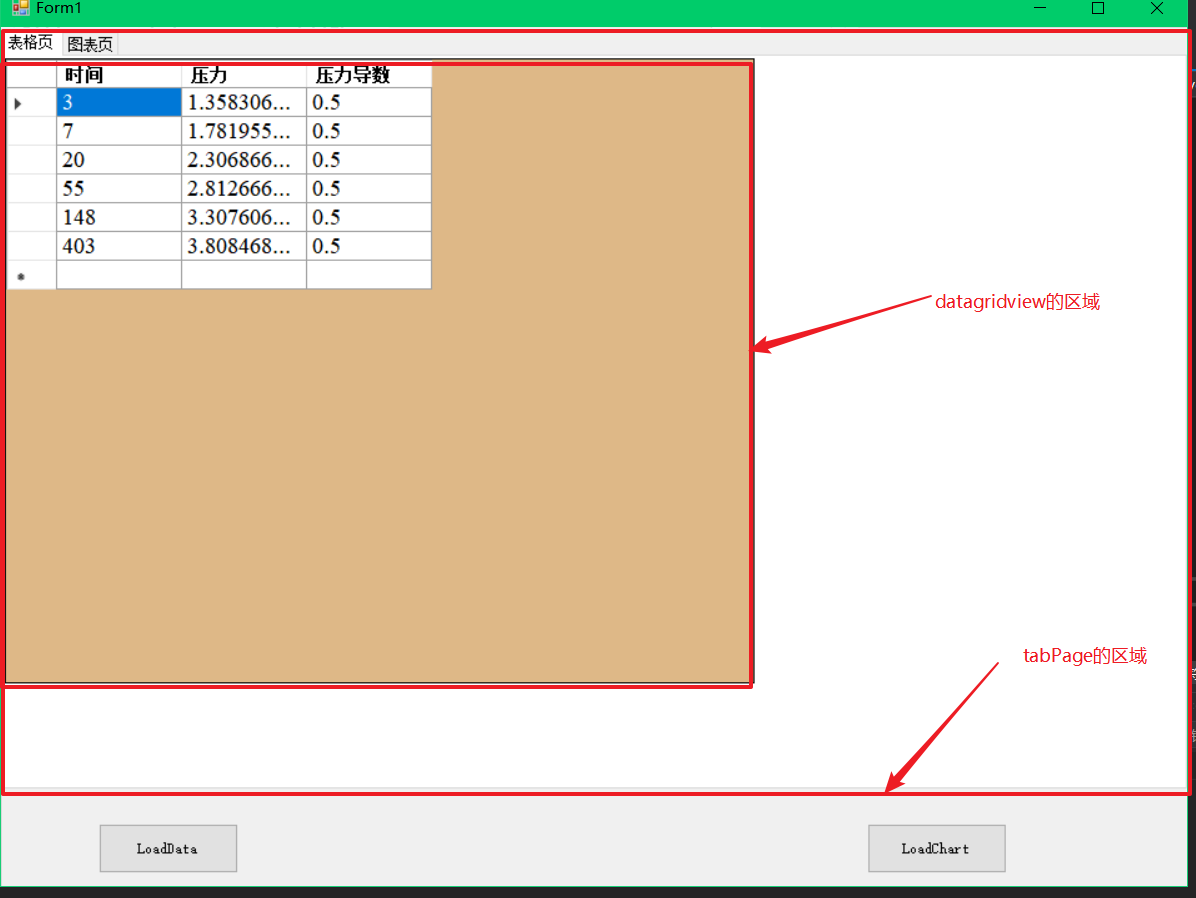
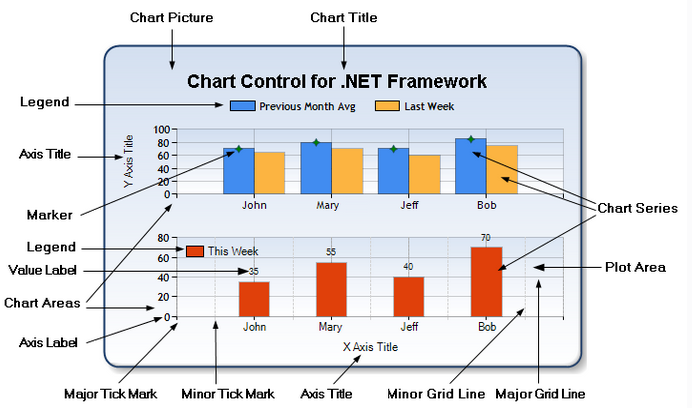
chart的各个区域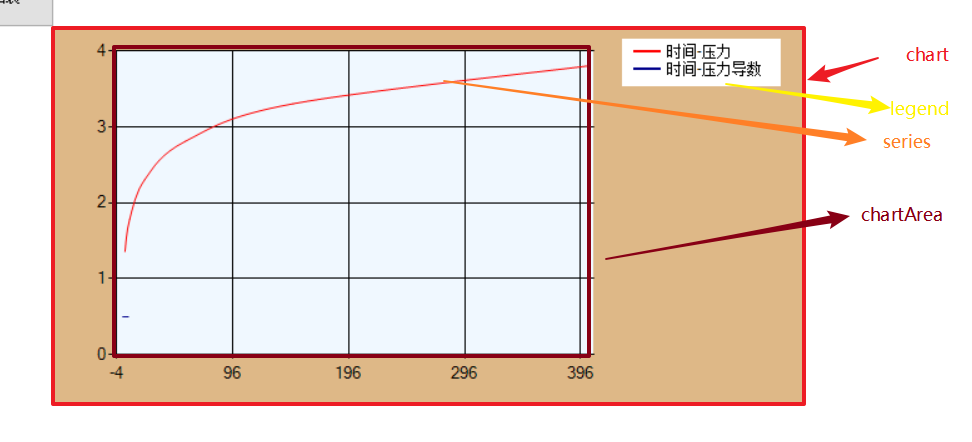

若有收获,就点个赞吧
0 人点赞
