背景
公司所有微服务都是使用同一个监控elasticsearch集群,这个集群存放应用监控metrics,还有一些错误log日志包堆栈信息。公司以nodejs为主要开发语言,使用measured-core这个库。库里面提供常用统计指标histogram, timer, meter, gauge 等指标。应用监控上传间隔1分钟,5分钟。
集群配置
日志集群由5台集群组成,其中3台角色同时为data-node, master, 5台机器配置如下:
| cpu | intel 8 core |
|---|---|
| 内存 | 64G |
| 数据盘 | 2T * 2 SSD,两个盘各自独立数据盘 |
| elasticsearch, logstash | 6.2.4 |
整个集群有10 SSD 盘作为数据盘。由于日志、监控数据不是重要数据,备份数目为1。
指标日志收集
上传指标量通过logstash进行收集的,然后按应用名称和环境提交es制定index上,收集配置如下:
input {http {host => "0.0.0.0"port => "{{ metrics_port }}" # 端口logstash接口metircs端口tags => ["metrics-reporter"]}}filter {if "metrics-reporter" in [tags] and [metrics] and [defaultLabels][app] {split {field => "[metrics]"}mutate {remove_field => [ "headers" ]}}}output {if "metrics-reporter" in [tags] and [metrics] and [defaultLabels][app] and [defaultLabels][nodeEnv] {# stdout { codec => json_lines }# stdout { codec => rubydebug }elasticsearch {# hosts => {{ es_discovery_hosts | to_json }}hosts => [{% for host in es_discovery_hosts %}"{{ host }}:{{ es_http_port }}"{% if not loop.last %},{% endif %}{% endfor %}]index => "metrics-%{[defaultLabels][nodeEnv]}-%{[defaultLabels][app]}-%{+YYYY.MM.dd}"}}}
按照这个配置,APP每个环境每天都会生成一个索引。日志格式:metrics-环境名称-应用名称-YYYY.MM.DD
索引规模
每个应用不同环境,每天都会产生一个索引,格式大概这样metrics-环境名称-应用名称-YYYY.MM.DD,可以通过下面脚本查看当前索引数目,例如当天2021.8.20, 命令如下:
$ curl -XGET http://<es-ip>:9200/_cat/indices/metrics-*-2021.08.20# 统计数目$ curl -XGET http://<es-ip>:9200/_cat/indices/*-2021.08.20 | wc -l
通过命令查询当天日志索引有221个。就是说,当日期切换时候,有211个新建索引初始化,这个数目不少,当时压力肯定比较大。创建空索引没有问题,但是logstash根据指标量变化增加新的mapping字段
监控图表情况
在grafana界面上也是每天8点钟,大概有10分钟日志是段开的,图表如下: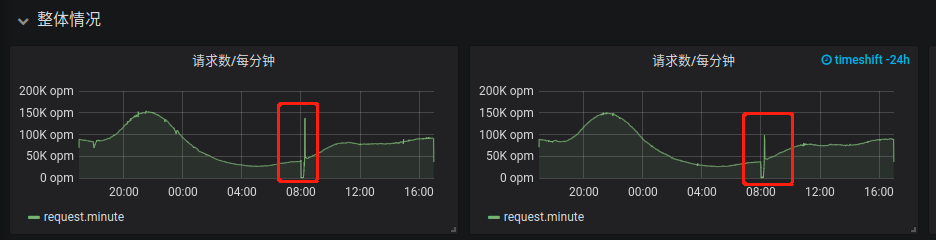
在APP错误日志里里面:
- 上报logstash10秒超时
- 代码收到nginx/logstash http 420并发过高错误码。
告警系统
- 由于应用监控数据上报不成功,导致触发许多错误告警
在elasticsearch日志里面报很多下面错误:
[2021-08-16T08:01:49,253][DEBUG][o.e.a.a.i.m.p.TransportPutMappingAction] [es-log-node-224] failed to put mappings on indices [[[metrics-xxxxxxx-2021.08.16/6xJPWn1nRb-QsBfZrsQKZA]]], type [doc]org.elasticsearch.cluster.metadata.ProcessClusterEventTimeoutException: failed to process cluster event (put-mapping) within 30sat org.elasticsearch.cluster.service.MasterService$Batcher.lambda$onTimeout$0(MasterService.java:125) ~[elasticsearch-6.2.4.jar:6.2.4]at java.util.ArrayList.forEach(ArrayList.java:1257) ~[?:1.8.0_181]at org.elasticsearch.cluster.service.MasterService$Batcher.lambda$onTimeout$1(MasterService.java:124) ~[elasticsearch-6.2.4.jar:6.2.4]at org.elasticsearch.common.util.concurrent.ThreadContext$ContextPreservingRunnable.run(ThreadContext.java:573) [elasticsearch-6.2.4.jar:6.2.4]at java.util.concurrent.ThreadPoolExecutor.runWorker(ThreadPoolExecutor.java:1149) [?:1.8.0_181]at java.util.concurrent.ThreadPoolExecutor$Worker.run(ThreadPoolExecutor.java:624) [?:1.8.0_181]at java.lang.Thread.run(Thread.java:748) [?:1.8.0_181]
问题分析
为什么在8点
由于elasticsearch和logstash统一使用UTC时间,北京时间是: UTC+8, 所以在8点时候,logstash接收到数据以后,切换新index去提交数据。
同一时刻创建大量索引
logstash在日期切换以后,接收每个app指标量以后,使用对应app新索引存放数据。这个索引是在接收数据,发现不存在,才新创建的。这个时刻大量索引去新建,elasticsearch每创建一个索引耗时比较大的,应用提交监控数据到logstash响应也变慢。同时应用那边上传失败也会不断重试,所以出现http 420并发过高错误码。
创建索引耗时
获取其中一个es索引属性如下,
$ curl -XGET http://<es-ip>:<es-port>/<metrics-index-name>
截取里面mapping配置mapping.json, 如下:
{"mappings": {"doc": {"dynamic_templates": [{"floats": {"match_mapping_type": "long","mapping": {"type": "float"}}}],"properties": {"@timestamp": {"type": "date"},"@version": {"type": "text","fields": {"keyword": {"type": "keyword","ignore_above": 256}}},"defaultLabels": {"properties": {"app": {"type": "text","fields": {"keyword": {"type": "keyword","ignore_above": 256}}},"hostname": {"type": "text","fields": {"keyword": {"type": "keyword","ignore_above": 256}}},"nodeEnv": {"type": "text","fields": {"keyword": {"type": "keyword","ignore_above": 256}}},"pid": {"type": "float"}}},"host": {"type": "text","fields": {"keyword": {"type": "keyword","ignore_above": 256}}},"metrics": {"properties": {"labels": {"properties": {"file": {"type": "text","fields": {"keyword": {"type": "keyword","ignore_above": 256}}},"reportUrl": {"type": "text","fields": {"keyword": {"type": "keyword","ignore_above": 256}}}}},"name": {"type": "text","fields": {"keyword": {"type": "keyword","ignore_above": 256}}},"value": {"properties": {"gauge": {"type": "float"},"meter": {"properties": {"15MinuteRate": {"type": "float"},"1MinuteRate": {"type": "float"},"5MinuteRate": {"type": "float"},"count": {"type": "float"},"currentRate": {"type": "float"},"mean": {"type": "float"}}},"timer": {"properties": {"histogram": {"properties": {"count": {"type": "float"},"max": {"type": "float"},"mean": {"type": "float"},"median": {"type": "float"},"min": {"type": "float"},"p75": {"type": "float"},"p95": {"type": "float"},"p99": {"type": "float"},"p999": {"type": "float"},"stddev": {"type": "float"},"sum": {"type": "float"},"variance": {"type": "float"}}},"meter": {"properties": {"15MinuteRate": {"type": "float"},"1MinuteRate": {"type": "float"},"5MinuteRate": {"type": "float"},"count": {"type": "float"},"currentRate": {"type": "float"},"mean": {"type": "float"}}}}}}}}},"tags": {"type": "text","fields": {"keyword": {"type": "keyword","ignore_above": 256}}},"timestamp": {"type": "date"}}}}}
通过下面命令创建索引,把mapping应用进去:
$ curl -XPUT http://<es-ip>:<es-port>/metrics-环境名称-应用名称-2021.08.21 -H 'Content-Type: application/json' -d @"mapping.json"
测试创建一个index, curl需要5s才返回成功响应。如果logstash在同一时间点创建索引,阻塞时间肯定大于5s,导致提交logstash的请求延时变大,CPU消耗也变大。上面mapping是动态模板,logstash根据metrics字段生成的。
解决方法
面对集中式创建引起大量耗时,可以把集中式创建修改分时创建。
- 可以通过列举当天索引,提取名称,把明天日期的标记字符加上去,逐个提交创建。
- 索引
mapping配置怎么办,通过从天对应日志index获取,配置明天索引上就可以。
由于都是动态字段,使用nodejs动态类型语言比较简单实现。下面截取nodejs代码。
列举上天所有索引
涉及到日志转字符串格式,使用moment库比较方便,和es通信使用elasticsearch库,es使用UTC时间,所以列举最好使用UTC时间,否则获取不到当天库就麻烦了。
// 环境对应 development, stage, production 环境
private async listMetricsIndexToday(env) {
    const utcDate = moment(Date.now())
      .utc()
      .format('YYYY.MM.DD')
      .toString()
    const index = `metrics-${env}-*-${utcDate}`
    const metrics = await this.client.cat.indices({ index, format: 'json' })
    // 加入活跃metrics判断和提取
    const activeMetrics = metrics.filter((metric) => {
      if (metric['docs.count'] > 0) {
        return true
      }
      return false
    })
    return activeMetrics
 }
上面代码相当下面http api操作:
export env=development
export d=2021.08.20

curl -XGET http://<es-ip>:<es-port>/_cat/indices/metrics-${env}-*-2021.08.20?format=json
读取索引mapping配置
列举索引后,可以通过索引数组获取每个索引名称,可以通名称获取索引配置信息。由logstash自动生成索引配置信息字段编排大概如下:
{
  // index name
  "metrics-xxxx-2021.08.20":{
    "mappings": {
      // mapping 配置信息, 创建的时候,mapping配置只要去
    }
  }
}
mapping需要通过索引名称字段上获取:
  private async getIndexMappings(index: string) {
    const resp = await this.client.indices.getMapping({ index })
    const mappings = resp[index]
    return mappings
  }
代码相当于下面 http api
curl -XGET http://<es-ip>:<es-port>/<index-name>/_mapping?pretty
预先创建明天索引
读取当前索引mapping,可以根据这个信息创建新索引。索引:metrics-环境名称-应用名称-YYYY.MM.DD,其实就是把最后-后面日期替换新日期。
获取当天日期字符传
由于es使用UTC时间的,所以每天北京时间8点以后,UTC日期才和北京时间日期是一致的。获取日期字符串时候做了一些处理; 8点前当天UTC日期比北京时间前一天
private getNextDateIndexString() {
    const now = moment(Date.now())
    // 8点以后UTC时间才进入今天
    if (now.hour() < 8) {
      const nextDayIndex = now.format('YYYY.MM.DD')
      return nextDayIndex
    } else {
      const nextDayIndex = now.add(1, 'days').format('YYYY.MM.DD')
      return nextDayIndex
    }
  }
遍历当天索引创建明天索引
创建明天索引,使用API比较简单:
private async createTomorrowMetricIndex(metricName: string, mappings) {
    const nextDayIndex = this.getNextDateIndexString()
    const indexName = `${metricName}-${nextDayIndex}`
    console.log('creating ', indexName, mappings)
    // 使用nodejs,无类型处理json比较简单直观
    await this.client.indices.create({
      index: indexName,
      timeout: '10s',
      body: {
        ...mappings
      }
    })
  }
下面遍历遍历当天index:
  private async createAllTomorrowMetricsIndex(env: string) {
    // 拉取当天index
    const metrics = await this.listMetricsIndexToday(env)
    for (const metric of metrics) {
      try {
        // 获取mapping信息
        const mappings = await this.getIndexMappings(metric.index)
        // 分离日期后index名称
        const metricName = this.splitIndexName(metric.index)
        console.log(metricName)
        // 创建这个metric明天index
        await this.createTomorrowMetricIndex(metricName, mappings)
        // 减少压力
        await P.delay(10 * 1000)
      } catch (err) {
        console.log(err)
      }
    }
  }
创建任务都单线程执行
整个程序单任务逐个执行,每个index创建以后都休眠10s,把创建压力平分平时时间
public async start() {
    await this.init()
    await this.createAllTomorrowMetricsIndex('production')
    await this.createAllTomorrowMetricsIndex('stage')
    await this.createAllTomorrowMetricsIndex('development')
 }
总结
当前elasticsearch集群硬件设施支持当前日志并发量能力还是充足的,只有由于创建压力集中在8点这个时间点导致数据丢失,可以通过脚本,把创建压力均衡分配平时时间。这样没有比较再增加硬件处理必要了。
修改以后: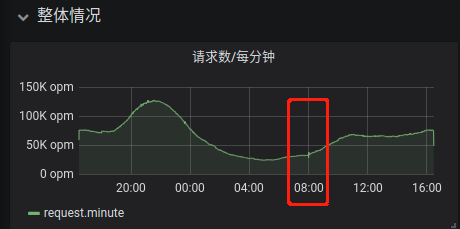
只有一点点锯齿,有可能切换index导致,最好一分钟数据提交时候切换明天index。这样已经解决索引应用metrics切换时候导致告警系统错误告警问题。

若有收获,就点个赞吧
0 人点赞
