sidecar模式
环境
[root@LF-MYSQL-136-130 haha]# /root/k8s.sh ht -n loki get pod -o wide|grep thanos
thanos-alertmanager 1/1 Running 0 4d 11.45.235.48 11.5.98.169
thanos-compact 1/1 Running 0 4d 11.45.241.180 11.5.32.34
thanos-gateway 1/1 Running 0 4d 11.45.240.101 11.5.32.39
thanos-prometheus1 1/1 Running 0 4d 11.45.241.182 11.5.31.5
thanos-prometheus2 1/1 Running 0 4d 11.45.241.183 11.5.31.40
thanos-prometheus3 1/1 Running 0 4d 11.45.235.47 11.5.98.170
thanos-query 1/1 Running 0 4d 11.45.241.206 11.5.32.40
thanos-query-frontend 1/1 Running 0 7s 11.45.241.185 11.5.32.41
thanos-ruler 1/1 Running 0 4d 11.45.241.181 11.5.31.6
thanos-s3 1/1 Running 0 4d 11.45.241.205 11.5.32.41
S3
MINIO_ACCESS_KEY=key123456
MINIO_SECRET_KEY=password123456
thanos-storage-minio.yaml
type: s3
config:
bucket: thanos
endpoint: 11.45.241.205
access_key: key123456
secret_key: password123456
insecure: true
signature_version2: false
Prometheus+Thanos Sidecar
#Prometheus
./prometheus —config.file=/export/prometheus/config_out/prometheus.yaml \
—storage.tsdb.path=/export/prometheus/data \
—storage.tsdb.retention.time=1h \
—web.route-prefix=/ \
—web.enable-lifecycle \
—storage.tsdb.no-lockfile \
—storage.tsdb.min-block-duration=2h \
—storage.tsdb.max-block-duration=2h \
—log.level=debug
#Thanos Sidecar
./thanos sidecar \
—log.level=debug \
—tsdb.path=/export/prometheus/data \
—prometheus.url=http://127.0.0.1:9090 \
—objstore.config-file=/export/thanos/thanos-storage-minio.yaml \
—reloader.config-file=/export/prometheus/prometheus1.yaml \
—reloader.config-envsubst-file=/export/prometheus/config_out/prometheus.yaml \
—reloader.rule-dir=/export/prometheus/rules/
./thanos sidecar \
—log.level=debug \
—tsdb.path=/export/prometheus/data \
—prometheus.url=http://127.0.0.1:9090 \
—objstore.config-file=/export/thanos/thanos-storage-minio.yaml \
—reloader.config-file=/export/prometheus/prometheus3.yaml \
—reloader.config-envsubst-file=/export/prometheus/config_out/prometheus.yaml \
—reloader.rule-dir=/export/prometheus/rules/
- Prometheus 使用 StatefulSet 方式部署,挂载数据盘以便存储最新监控数据。
- 由于 Prometheus 副本之间没有启动顺序的依赖,所以 podManagementPolicy 指定为 Parallel,加快启动速度。
- 为 Prometheus 绑定足够的 RBAC 权限,以便后续配置使用 k8s 的服务发现 (
kubernetes_sd_configs) 时能够正常工作。 - 为 Prometheus 创建 headless 类型 service,一方面是 StatefulSet 本身需要指定 headless 的
serviceName,另一方面是为后续 Thanos Query 通过 DNS SRV 记录来动态发现 Sidecar 的 gRPC 端点做准备 (使用 headless service 才能让 DNS SRV 正确返回所有端点)。 - 使用两个 Prometheus 副本,用于实现高可用。
- 使用硬反亲和,避免 Prometheus 部署在同一节点,既可以分散压力也可以避免单点故障。
- Prometheus 使用
--storage.tsdb.retention.time指定数据保留时长,默认15天,可以根据数据增长速度和数据盘大小做适当调整(数据增长取决于采集的指标和目标端点的数量和采集频率)。 - Sidecar 使用
--objstore.config-file引用我们刚刚创建并挂载的对象存储配置文件,用于上传数据到对象存储。 通常会给 Prometheus 附带一个 quay.io/coreos/prometheus-config-reloader 来监听配置变更并动态加载,但 thanos sidecar 也为我们提供了这个功能,所以可以直接用 thanos sidecar 来实现此功能,也支持配置文件根据模板动态生成:
--reloader.config-file指定 Prometheus 配置文件模板,--reloader.config-envsubst-file指定生成配置文件的存放路径,假设是/etc/prometheus/config_out/prometheus.yaml,那么/etc/prometheus/config_out这个路径使用 emptyDir 让 Prometheus 与 Sidecar 实现配置文件共享挂载,Prometheus 再通过--config.file指定生成出来的配置文件,当配置有更新时,挂载的配置文件也会同步更新,Sidecar 也会通知 Prometheus 重新加载配置。另外,Sidecar 与 Prometheus 也挂载同一份 rules 配置文件,配置更新后 Sidecar 仅通知 Prometheus 加载配置,不支持模板,因为 rules 配置不需要模板来动态生成。
Thanos Query
./thanos query \
—log.level=debug \
—query.auto-downsampling \
—grpc-address=0.0.0.0:10901 \
—http-address=0.0.0.0:9090 \
—query.partial-response \
—query.replica-label=prometheus_replica \
—query.replica-label=rule_replica \
—store=thanos-prometheus.loki.svc.htdb.n.jd.local \
—store=thanos-rule.loki.svc.htdb.n.jd.local \
—store=thanos-store.loki.svc.htdb.n.jd.local
./thanos query \
—log.level=debug \
—query.auto-downsampling \
—grpc-address=0.0.0.0:10901 \
—http-address=0.0.0.0:80 \
—query.partial-response \
—query.replica-label=prometheus_replica \
—query.replica-label=rule_replica \
—store=11.45.241.182:10901 \
—store=11.45.241.183:10901 \
—store=11.45.235.47:10901 \
—store=11.45.241.181:10901 \
—store=11.45.240.101:10901因为 Query 是无状态的,使用 Deployment 部署,也不需要 headless service,直接创建普通的 service。
- 使用软反亲和,尽量不让 Query 调度到同一节点。
- 部署多个副本,实现 Query 的高可用。
--query.partial-response启用 Partial Response,这样可以在部分后端 Store API 返回错误或超时的情况下也能看到正确的监控数据(如果后端 Store API 做了高可用,挂掉一个副本,Query 访问挂掉的副本超时,但由于还有没挂掉的副本,还是能正确返回结果;如果挂掉的某个后端本身就不存在我们需要的数据,挂掉也不影响结果的正确性;总之如果各个组件都做了高可用,想获得错误的结果都难,所以我们有信心启用 Partial Response 这个功能)。--query.auto-downsampling查询时自动降采样,提升查询效率。--query.replica-label指定我们刚刚给 Prometheus 配置的prometheus_replica这个 external label,Query 向 Sidecar 拉取 Prometheus 数据时会识别这个 label 并自动去重,这样即使挂掉一个副本,只要至少有一个副本正常也不会影响查询结果,也就是可以实现 Prometheus 的高可用。同理,再指定一个rule_replica用于给 Ruler 做高可用。--store指定实现了 Store API 的地址(Sidecar, Ruler, Store Gateway, Receiver),通常不建议写静态地址,而是使用服务发现机制自动发现 Store API 地址,如果是部署在同一个集群,可以用 DNS SRV 记录来做服务发现,比如dnssrv+_grpc._tcp.prometheus-headless.thanos.svc.cluster.local,也就是我们刚刚为包含 Sidecar 的 Prometheus 创建的 headless service (使用 headless service 才能正确实现服务发现),并且指定了名为 grpc 的 tcp 端口,同理,其它组件也可以按照这样加到--store参数里;如果是其它有些组件部署在集群外,无法通过集群 dns 解析 DNS SRV 记录,可以使用配置文件来做服务发现,也就是指定--[store.sd](http://store.sd)-files参数,将其它 Store API 地址写在配置文件里 (挂载 ConfigMap),需要增加地址时直接更新 ConfigMap (不需要重启 Query)。部署完成后我们就可以通过去访问 Querier,Stores页面下面就会显示通过服务发现获取到的 Sidecar 信息: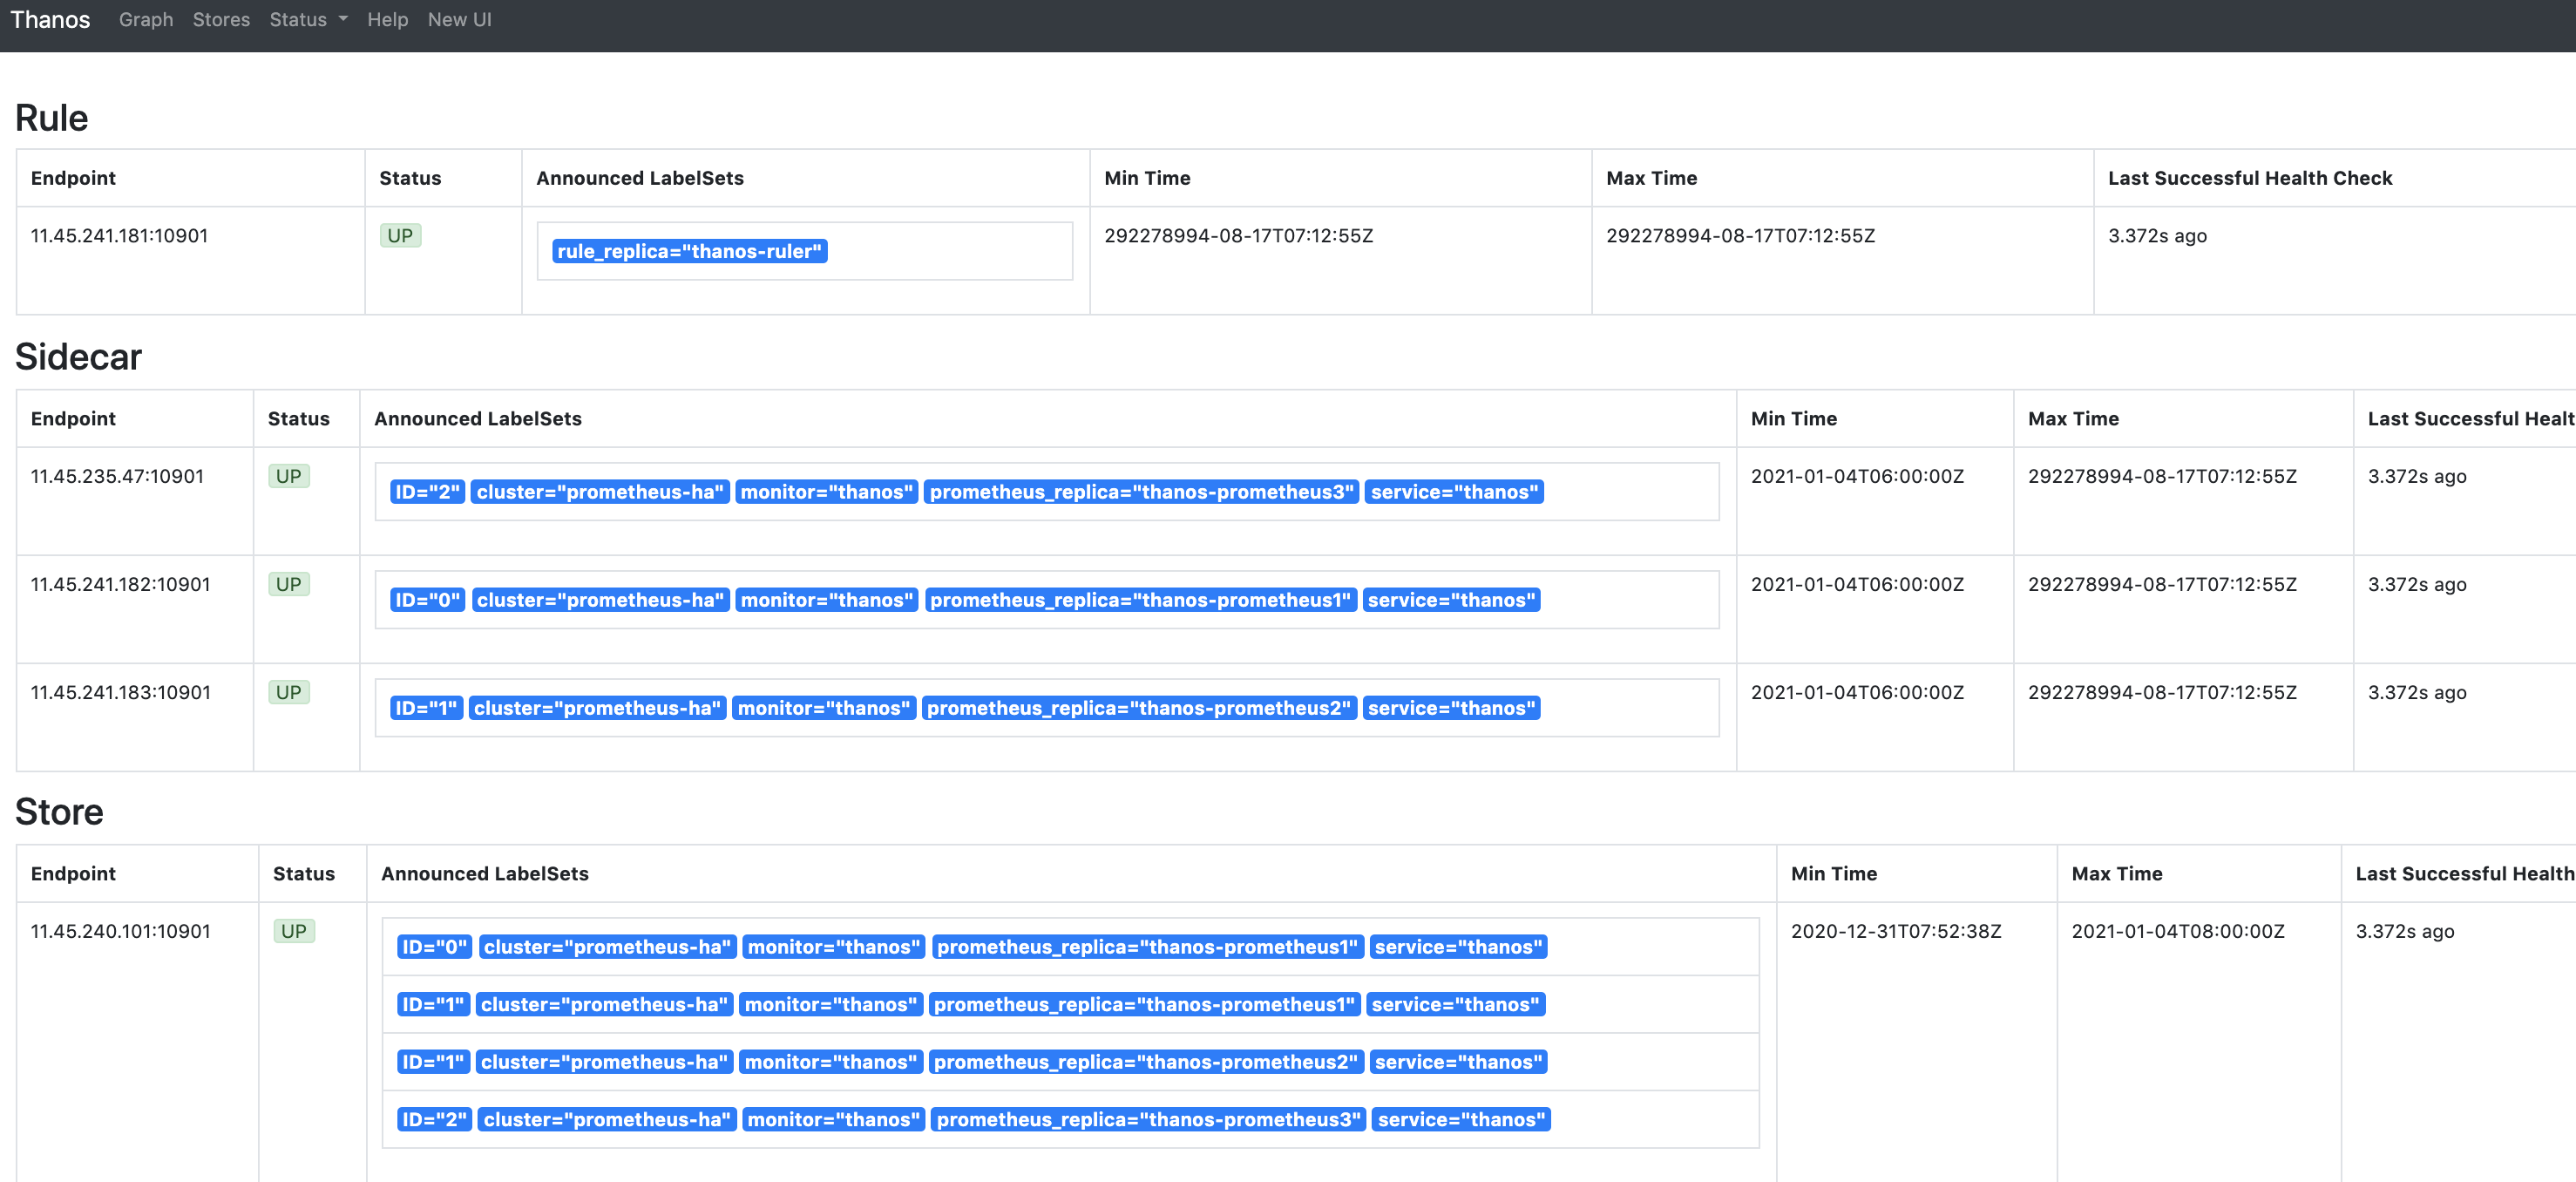
Thanos Query Frontend
./thanos query-frontend \
—log.level=info \
—log.format=logfmt \
—query-frontend.compress-responses \
—http-address=0.0.0.0:9090 \
—query-frontend.downstream-url=http://thanos-query.thanos.svc.cluster.local.:9090 \
—query-range.split-interval=12h \
—labels.split-interval=12h \
—query-range.max-retries-per-request=10 \
—labels.max-retries-per-request=10 \
—query-frontend.log-queries-longer-than=10s
./thanos query-frontend \
—log.level=info \
—log.format=logfmt \
—query-frontend.compress-responses \
—http-address=0.0.0.0:80 \
—query-frontend.downstream-url=http://11.45.241.206:80 \
—query-range.split-interval=1h \
—labels.split-interval=1h \
—query-range.max-retries-per-request=10 \
—labels.max-retries-per-request=10 \
—query-frontend.log-queries-longer-than=10s
./thanos query-frontend \
—log.level=info \
—log.format=logfmt \
—query-frontend.compress-responses \
—http-address=0.0.0.0:80 \
—query-frontend.downstream-url=http://11.45.241.206:80 \
—query-range.split-interval=12h \
—labels.split-interval=12h \
—query-range.max-retries-per-request=10 \
—labels.max-retries-per-request=10 \
—query-frontend.log-queries-longer-than=10s \
—query-range.response-cache-config-file=/export/thanos/in_memory.yaml
#in_memory.yaml
[root@thanos-query-frontend thanos]# more in_memory.yaml
type: IN-MEMORY
config:
max_size: “”
max_size_items: 0
validity: 0s
#Query Frontend supports caching query results and reuses them on subsequent queries. If the cached results are incomplete,
#Query Frontend calculates the required subqueries and executes them in parallel on downstream queriers.
#Query Frontend can optionally align queries with their step parameter to improve the cacheability of the query results.
#Currently, in-memory cache (fifo cache) and memcached are supported.
Thanos Store Gateway
./thanos store \
—log.level=debug \
—data-dir=/export/thanos/store \
—grpc-address=0.0.0.0:10901 \
—http-address=0.0.0.0:10902 \
—objstore.config-file=/export/thanos/objectstorage.yaml \
—experimental.enable-index-header
./thanos store \
—log.level=debug \
—data-dir=/export/thanos/store \
—grpc-address=0.0.0.0:10901 \
—http-address=0.0.0.0:10902 \
—objstore.config-file=/export/thanos/thanos-storage-minio.yaml \
—store.enable-index-header-lazy-readerStore Gateway 实际也可以做到一定程度的无状态,它会需要一点磁盘空间来对对象存储做索引以加速查询,但数据不那么重要,是可以删除的,删除后会自动去拉对象存储查数据重新建立索引。这里我们避免每次重启都重新建立索引,所以用 StatefulSet 部署 Store Gateway,挂载一块小容量的磁盘(索引占用不到多大空间)。
- 同样创建 headless service,用于 Query 对 Store Gateway 进行服务发现。
- 部署两个副本,实现 Store Gateway 的高可用。
Store Gateway 也需要对象存储的配置,用于读取对象存储的数据,所以要挂载对象存储的配置文件。
Thanos Ruler
./thanos rule \
—grpc-address=0.0.0.0:10901 \
—http-address=0.0.0.0:10902 \
—rule-file=/export/thanos/rules/rules.yaml \
—objstore.config-file=/export/thanos/objectstorage.yaml \
—data-dir=/export/thanos/rule \
—label=rule_replica=”$(NAME)” \
—alert.label-drop=”rule_replica” \
—query=thanos-query.thanos.svc.cluster.local
./thanos rule \
—grpc-address=0.0.0.0:10901 \
—http-address=0.0.0.0:10902 \
—rule-file=/export/thanos/rules/rules.yaml \
—objstore.config-file=/export/thanos/thanos-storage-minio.yaml \
—data-dir=/export/thanos/rule \
—label=’rule_replica=”thanos-ruler”‘ \
—alert.label-drop=”rule_replica” \
—query=11.45.241.206:80 \
—alertmanagers.url=http://11.45.235.48:80
Ruler 是有状态服务,使用 Statefulset 部署,挂载磁盘以便存储根据 rule 配置计算出的新数据。
- 同样创建 headless service,用于 Query 对 Ruler 进行服务发现。
- 部署两个副本,且使用
--label=rule_replica=给所有数据添加rule_replica的 label (与 Query 配置的replica_label相呼应),用于实现 Ruler 高可用。同时指定--alert.label-drop为rule_replica,在触发告警发送通知给 AlertManager 时,去掉这个 label,以便让 AlertManager 自动去重 (避免重复告警)。 - 使用
--query指定 Query 地址,这里还是用 DNS SRV 来做服务发现,但效果跟配dns+thanos-query.thanos.svc.cluster.local:9090是一样的,最终都是通过 Query 的 ClusterIP (VIP) 访问,因为它是无状态的,可以直接由 K8S 来给我们做负载均衡。 - Ruler 也需要对象存储的配置,用于上传计算出的数据到对象存储,所以要挂载对象存储的配置文件。
--rule-file指定挂载的 rule 配置,Ruler 根据配置来生成数据和触发告警。
Thanos Compact
./thanos compact \
—wait \
—objstore.config-file=/export/thanos/objectstorage.yaml \
—data-dir=/export/thanos/compact \
—debug.accept-malformed-index \
—log.level=debug \
—retention.resolution-raw=90d \
—retention.resolution-5m=180d \
—retention.resolution-1h=360d
./thanos compact \
—wait \
—objstore.config-file=/export/thanos/thanos-storage-minio.yaml \
—data-dir=/export/thanos/compact \
—debug.accept-malformed-index \
—log.level=debug \
—retention.resolution-raw=90d \
—retention.resolution-5m=180d \
—retention.resolution-1h=360dCompact 只能部署单个副本,因为如果多个副本都去对对象存储的数据做压缩和降采样的话,会造成冲突。
- 使用 StatefulSet 部署,方便自动创建和挂载磁盘。磁盘用于存放临时数据,因为 Compact 需要一些磁盘空间来存放数据处理过程中产生的中间数据。
--wait让 Compact 一直运行,轮询新数据来做压缩和降采样。- Compact 也需要对象存储的配置,用于读取对象存储数据以及上传压缩和降采样后的数据到对象存储。
- 创建一个普通 service,主要用于被 Prometheus 使用 kubernetes 的 endpoints 服务发现来采集指标(其它组件的 service 也一样有这个用途)。
--retention.resolution-raw指定原始数据存放时长,--retention.resolution-5m指定降采样到数据点 5 分钟间隔的数据存放时长,--retention.resolution-1h指定降采样到数据点 1 小时间隔的数据存放时长,它们的数据精细程度递减,占用的存储空间也是递减,通常建议它们的存放时间递增配置 (一般只有比较新的数据才会放大看,久远的数据通常只会使用大时间范围查询来看个大致,所以建议将精细程度低的数据存放更长时间)
alertmanager
./alertmanager —config.file=/export/alertmanager/alertmanager.yml —storage.path=/export/alertmanager/data —web.listen-address=:80 —cluster.listen-address=:8001
prometheus配置文件
global:
scrapeinterval: 30s
scrapetimeout: 30s
externallabels:
monitor: ‘thanos’
service: ‘thanos’
ID: ‘IDNUM’
cluster: prometheus-ha
prometheusreplica: $(PODNAME) #自定义label,用于Thanos 实现 Prometheus 高可用
…
relabelconfigs:
- sourcelabels: [__address]
modulus: 3
target_label: tmp_hash
action: hashmod
- source_labels: [tmp_hash]
regex: ID_NUM
action: keep
- source_labels: [tmp_hash]
regex: ‘(.*)’
replacement: ‘${1}’
target_label: hash_num
…
#Shard 0:
global:
scrape_interval: 30s
scrape_timeout: 30s
external_labels:
monitor: ‘thanos’
service: ‘thanos’
ID: ‘0’
cluster: prometheus-ha
prometheus_replica: $(POD_NAME)
…
relabel_configs:
- source_labels: [address]
modulus: 3
target_label: tmp_hash
action: hashmod
- source_labels: [tmp_hash]
regex: ^0$
action: keep
- source_labels: [tmp_hash]
regex: ‘(.*)’
replacement: ‘${1}’
target_label: hash_num
…
#Shard 1:
global:
scrape_interval: 30s
scrape_timeout: 30s
external_labels:
monitor: ‘thanos’
service: ‘thanos’
ID: ‘1’
cluster: prometheus-ha
prometheus_replica: $(POD_NAME)
…
relabel_configs:
- source_labels: [address]
modulus: 3
target_label: tmp_hash
action: hashmod
- source_labels: [tmp_hash]
regex: ^1$
action: keep
- source_labels: [tmp_hash]
regex: ‘(.*)’
replacement: ‘${1}’
target_label: hash_num
…
#Shard 2:
global:
scrape_interval: 30s
scrape_timeout: 30s
external_labels:
monitor: ‘thanos’
service: ‘thanos’
ID: ‘2’
cluster: prometheus-ha
prometheus_replica: $(POD_NAME)
…
relabel_configs:
- source_labels: [address]
modulus: 3
target_label: tmp_hash
action: hashmod
- source_labels: [tmp_hash]
regex: ^2$
action: keep
- source_labels: [__tmp_hash]
regex: ‘(.)’
replacement: ‘${1}’
target_label: hash_num
…
杂记
日志
level=warn ts=2021-01-04T05:00:34.964669733Z caller=s3.go:399 msg=”could not guess file size for multipart upload; upload might be not optimized” name=debug/metas/01EV5W8H6AW6CSF8KD006Z7V0X.json err=”unsupported type of io.Reader”
level=debug ts=2021-01-04T05:00:34.991007764Z caller=objstore.go:159 msg=”uploaded file” from=/export/prometheus/data/thanos/upload/01EV5W8H6AW6CSF8KD006Z7V0X/chunks/000001 dst=01EV5W8H6AW6CSF8KD006Z7V0X/chunks/000001 bucket=”tracing: thanos”
level=debug ts=2021-01-04T05:00:35.040270818Z caller=objstore.go:159 msg=”uploaded file” from=/export/prometheus/data/thanos/upload/01EV5W8H6AW6CSF8KD006Z7V0X/index dst=01EV5W8H6AW6CSF8KD006Z7V0X/index bucket=”tracing: thanos”
level=debug ts=2021-01-04T05:28:45.510141719Z caller=prometheus.go:266 msg=”started handling ReadRequest_STREAMED_XOR_CHUNKS streamed read response.”
level=debug ts=2021-01-04T05:28:45.510315843Z caller=prometheus.go:327 msg=”handled ReadRequest_STREAMED_XOR_CHUNKS request.” frames=3
level=debug ts=2021-01-04T05:32:48.321286072Z caller=prometheus.go:266 msg=”started handling ReadRequest_STREAMED_XOR_CHUNKS streamed read response.”
level=debug ts=2021-01-04T05:32:48.321476902Z caller=prometheus.go:327 msg=”handled ReadRequest_STREAMED_XOR_CHUNKS request.” frames=3
https://github.com/thanos-io/thanos/issues/3518
MinIO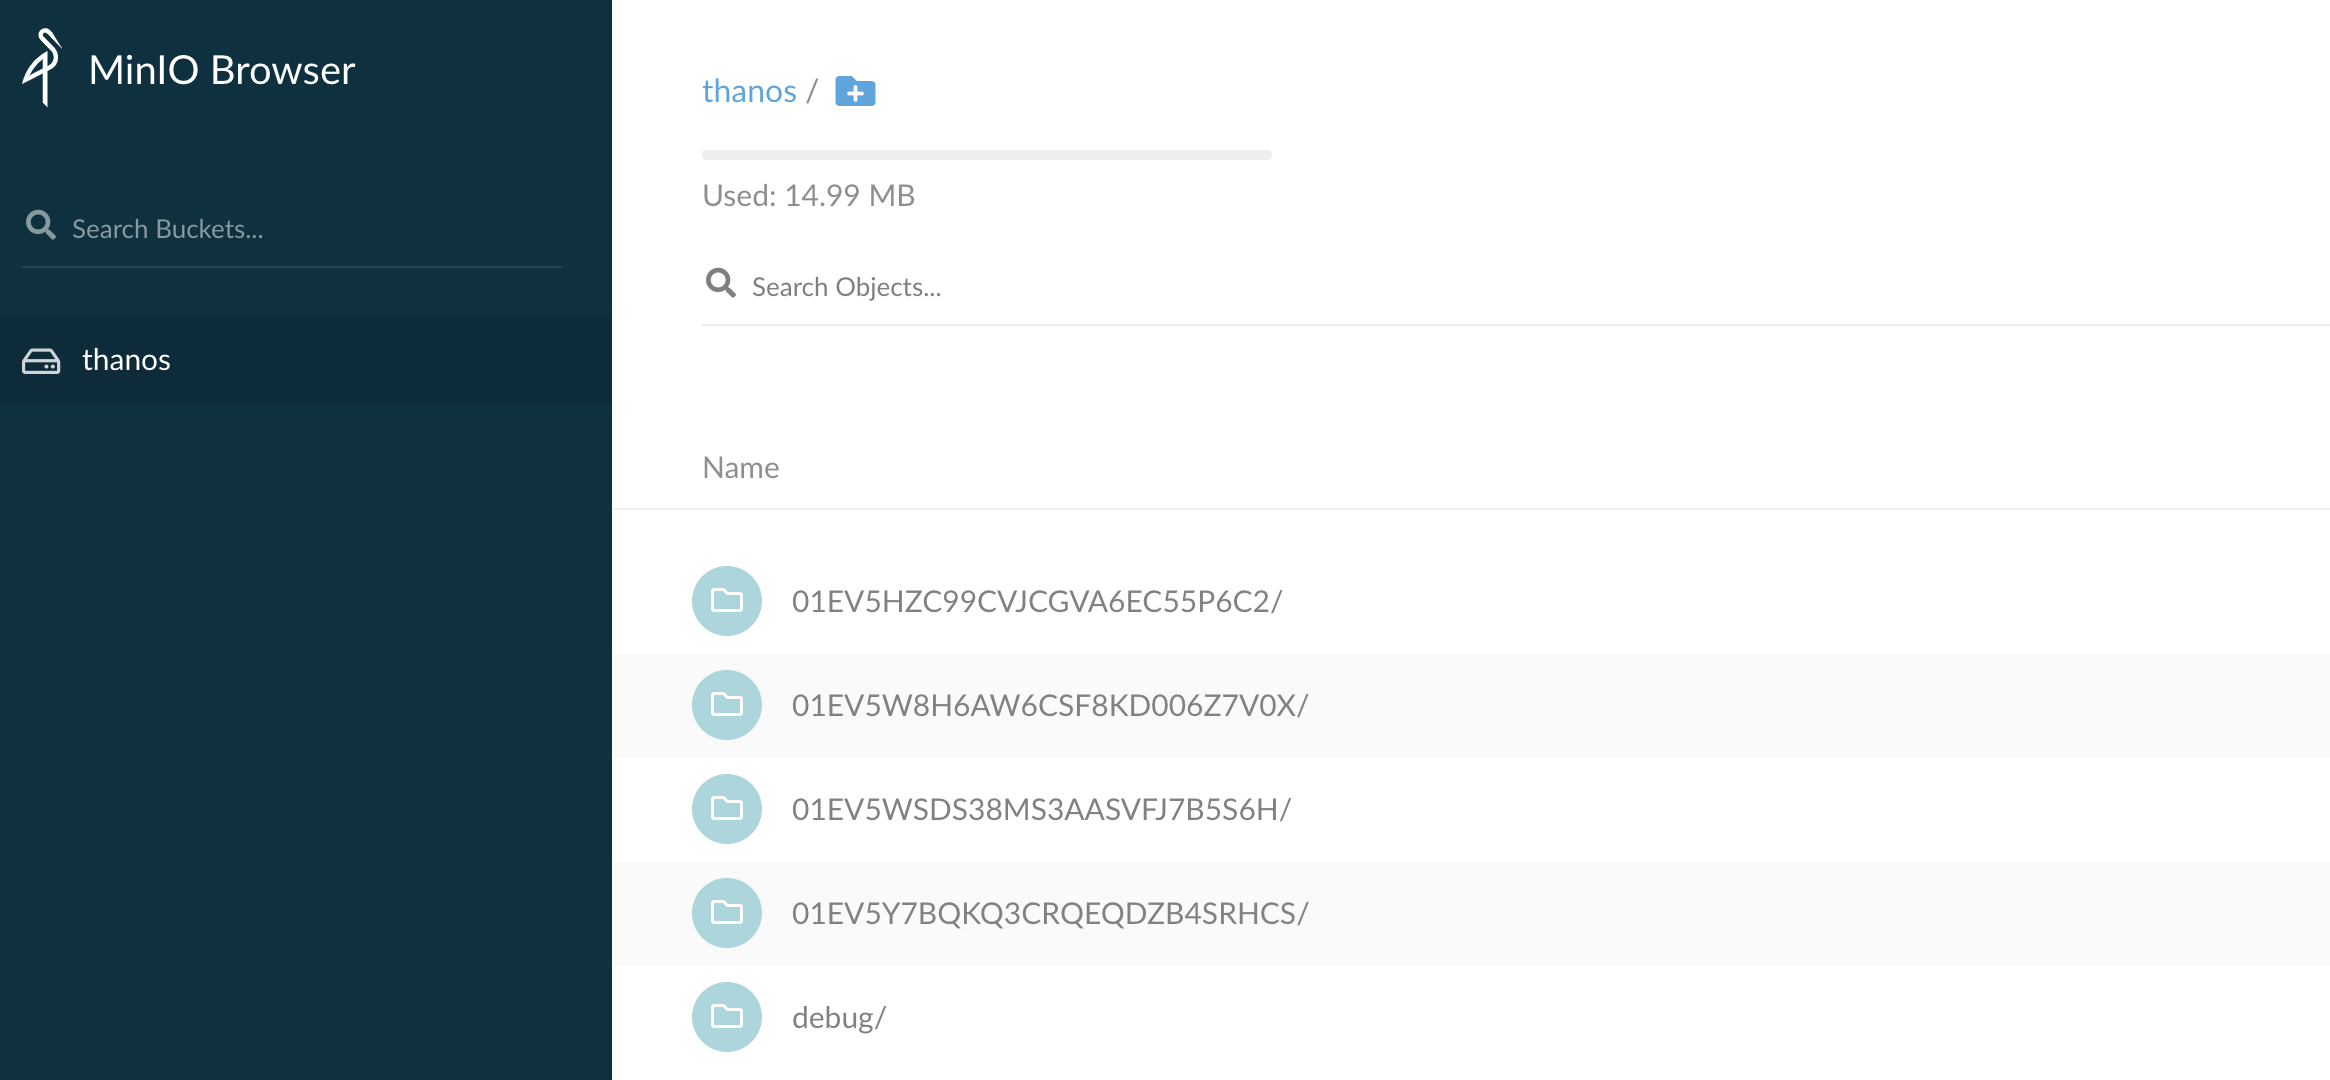
*Thanos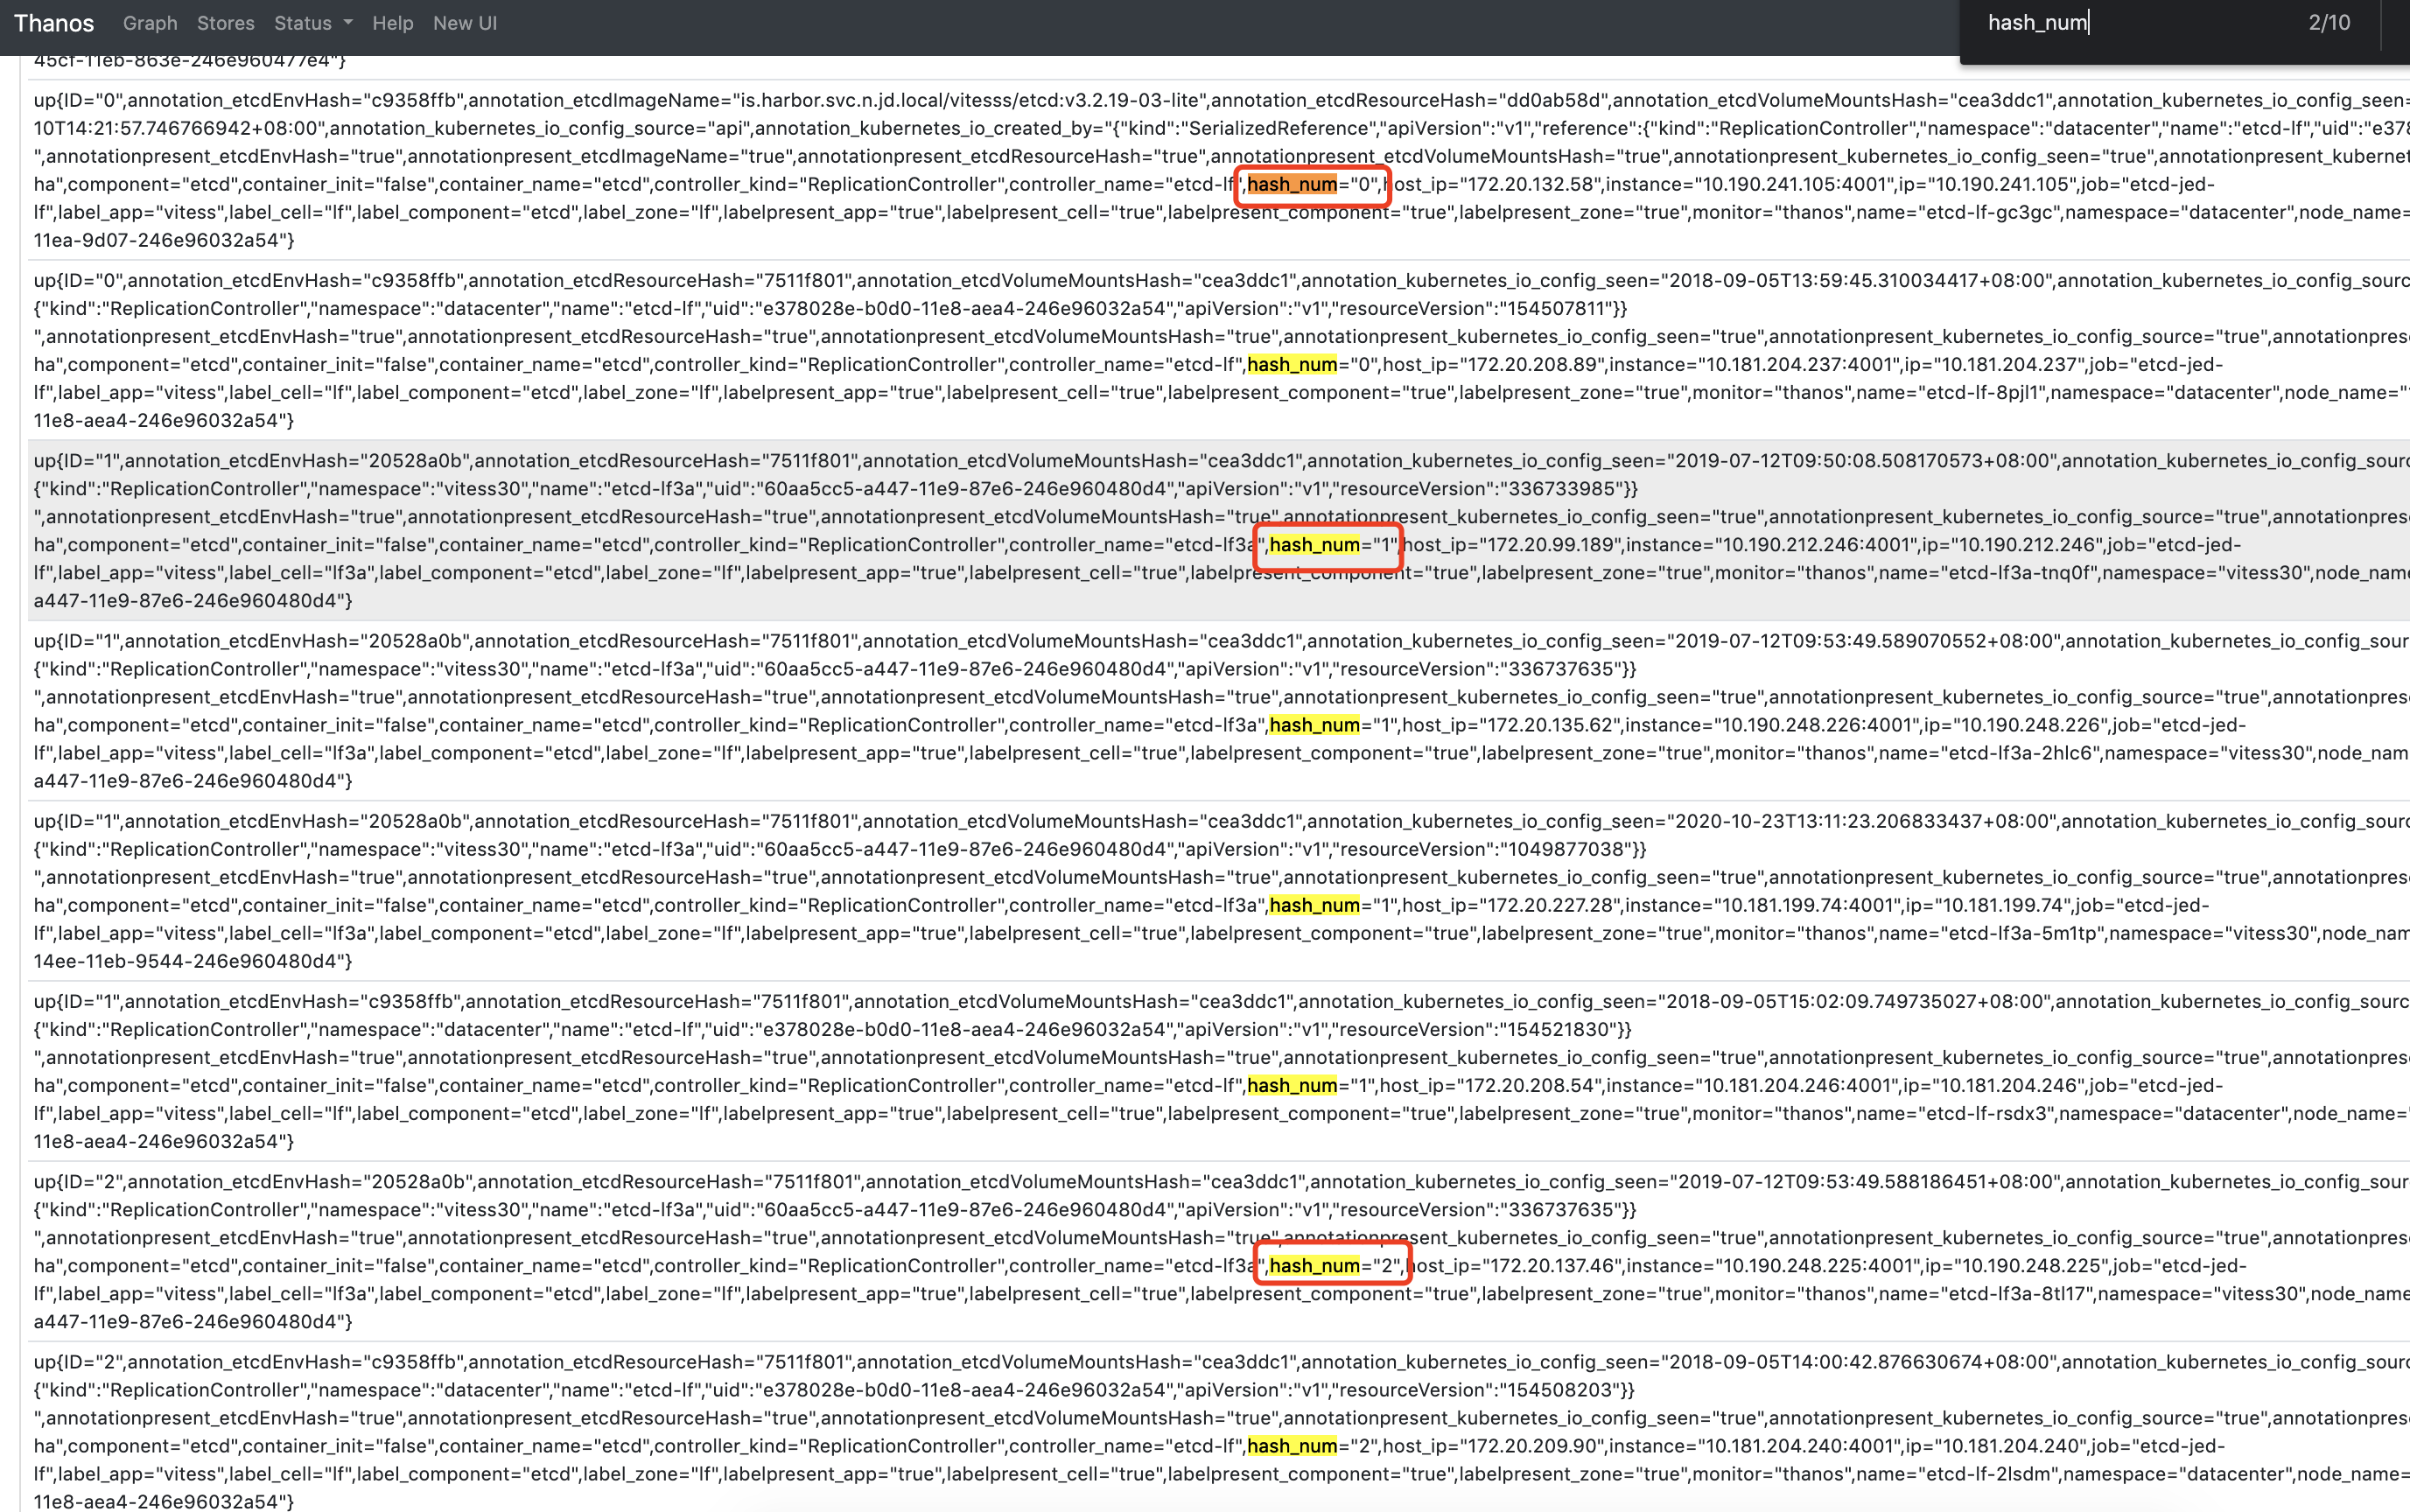
https://k8s.imroc.io/monitoring/build-cloud-native-large-scale-distributed-monitoring-system/thanos-deploy/

若有收获,就点个赞吧
0 人点赞
