参考资料:https://mp.weixin.qq.com/s/llR14JKObuNn_OiuMA1CrQ
代码地址:https://github.com/SeafyLiang/Python_study/blob/master/pandas_study/13%E7%A7%8Dpandas%E5%86%85%E7%BD%AE%E7%94%BB%E5%9B%BE.ipynb
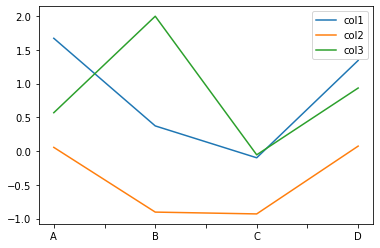
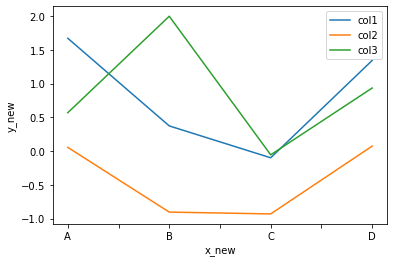
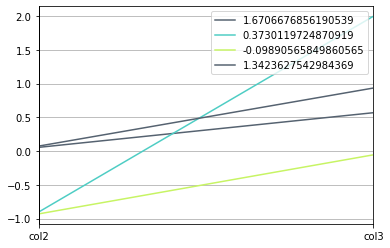
1、折线图
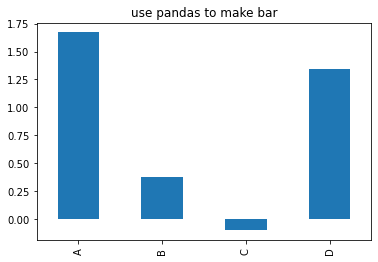
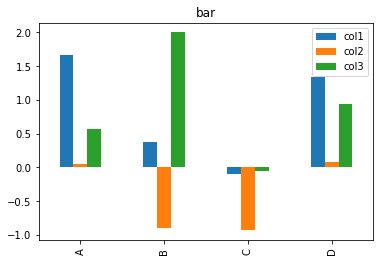
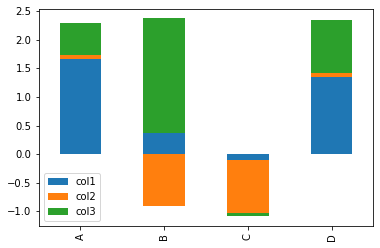
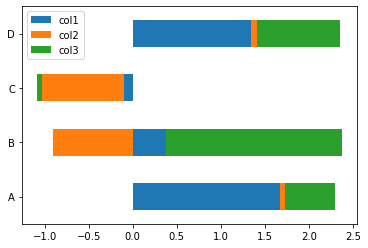
2、柱状图
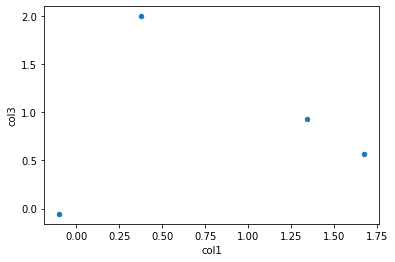
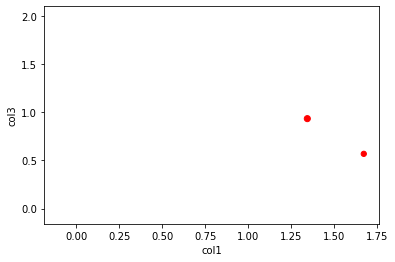
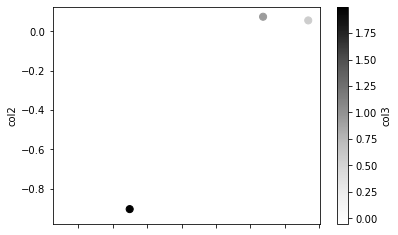
3、散点图
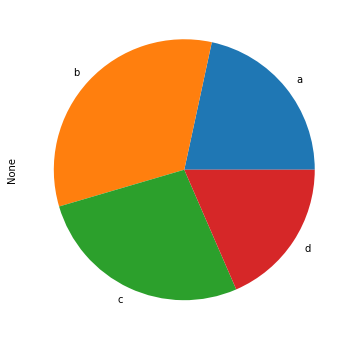
4、饼图
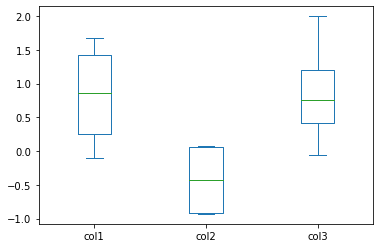
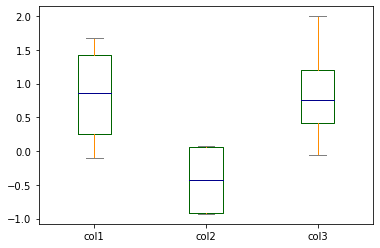
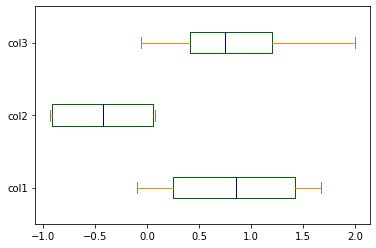
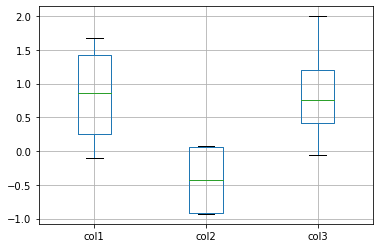
5、箱型图
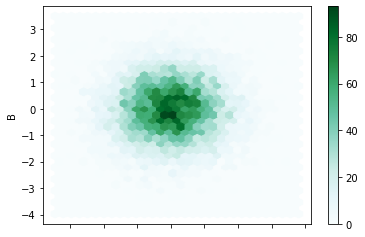
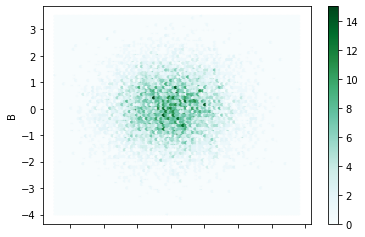
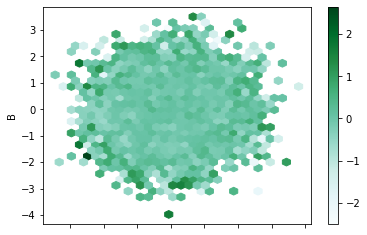
6、蜂窝图
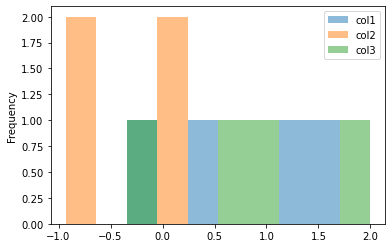
7、直方图
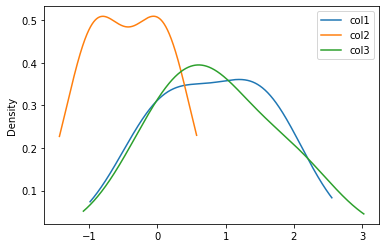
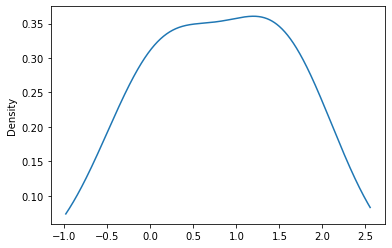
9、密度图
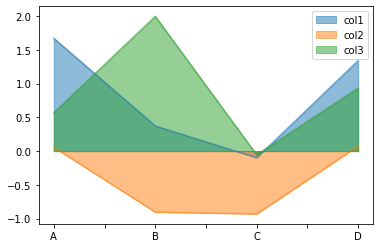
10、面积图
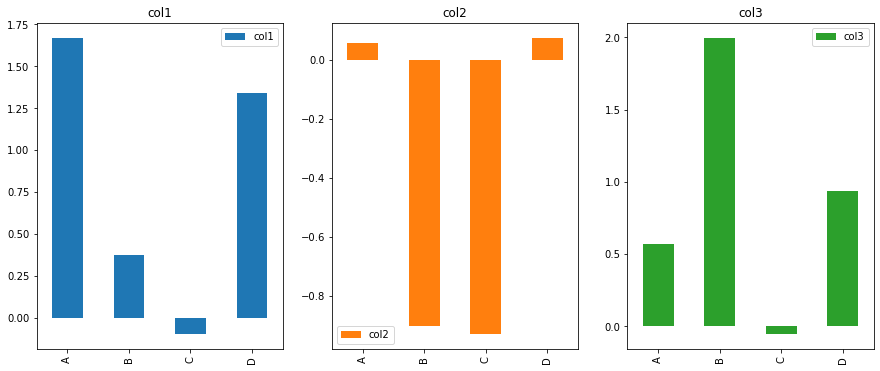
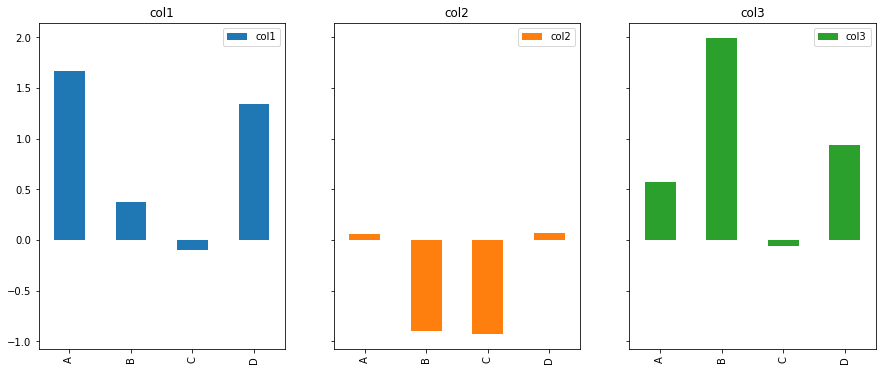
11、多子图
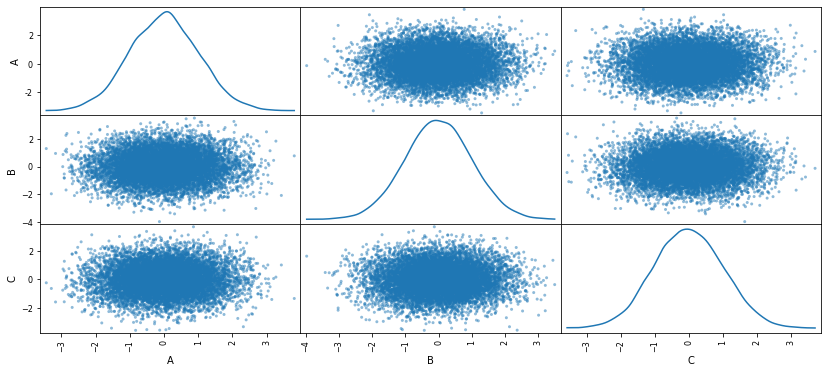
12、散点矩阵图
13、平行分类图
#!/usr/bin/env python# coding: utf-8# 下面是常见的参数及解释,详细的请参考官网:https://pandas.pydata.org/docs/reference/api/pandas.DataFrame.plot.html# In[1]:import pandas as pdimport numpy as npimport matplotlib.pyplot as pltget_ipython().run_line_magic('matplotlib', 'inline')# In[2]:# 随机生成4*3的数据data = np.random.randn(4, 3)data# In[3]:df = pd.DataFrame(data, # 数据columns = ['col1', 'col2', 'col3'], # 属性index=['A', 'B', 'C', 'D'] # 索引)df# ## 1、折线图# In[5]:df.plot(kind="line")# In[7]:# 设置两个轴的名称df.plot(kind="line",xlabel="x_new",ylabel="y_new")# ## 2、柱状图# In[8]:# 写法1df.col1.plot(kind="bar",title="use pandas to make bar")# 写法2df["col1"].plot(kind="bar",title="use pandas to make bar")# 写法3df.col1.plot.bar(title="use pandas to make bar")# In[10]:# 多元素柱状图df.plot(kind='bar', title='bar')# In[11]:# 堆叠柱状图df.plot(kind='bar',stacked=True)# In[12]:# 水平柱状图df.plot.barh()# In[13]:# 水平堆叠柱状图df.plot.barh(stacked=True)# ## 3、散点图# In[14]:df.plot(kind='scatter', x='col1', y='col3')# In[16]:# 改变大小和颜色df.plot(kind="scatter", # 指定类型x="col1", y="col3", # 指定两个轴s=df["col2"] *500, # 点的大小c="r" # 点的颜色)# In[17]:# 带颜色棒的散点图df.plot.scatter(x='col1',y='col2',c='col3',s=50)# ## 4、饼图# In[19]:# 模拟新数据series = pd.Series(np.random.rand(4), index=['a', 'b', 'c', 'd'])series# In[20]:series.plot(kind='pie', figsize=(6, 6))# In[21]:df2 = pd.DataFrame(5*np.random.rand(4, 2),index=['a', 'b', 'c', 'd'],columns=['x', 'y'])df# ## 5、箱型图# In[22]:df.plot(kind='box', y=df.columns)# In[23]:# 自定义箱型图# 自定义颜色color = {"boxes": "DarkGreen","whiskers": "DarkOrange","medians": "DarkBlue","caps": "Gray"}df.plot.box(color=color, sym="r+")# In[24]:# 水平箱型图# 自定义颜色color = {"boxes": "DarkGreen","whiskers": "DarkOrange","medians": "DarkBlue","caps": "Gray"}df.plot.box(color=color,vert=False, # 关键参数sym="r+")# In[25]:# 使用boxplot绘箱型图df.boxplot()# In[26]:# 使用boxplot绘箱型图df.boxplot(vert=False)# ## 6、蜂窝图# In[28]:# 模拟数据df1 = pd.DataFrame(np.random.randn(10000, 3),columns=['A', 'B', 'C'])df1# In[29]:# 基础蜂窝图df1.plot(kind='hexbin', x='A', y='B', gridsize=30)# In[30]:# 基础蜂窝图df1.plot(kind='hexbin', x='A', y='B', gridsize=100)# In[31]:# 改进版蜂窝图df1.plot(kind="hexbin",x="A",y="B",C="C", # 颜色深度的表示reduce_C_function=np.mean, # 指定不同聚合参数:mean/max/min/sum/stdgridsize=30)# ## 7、直方图# In[32]:# 写法1df.plot(kind="hist",alpha=0.5)# 写法2df.plot.hist(alpha=0.5)# ## 9、密度图# In[33]:# 针对dfdf.plot(kind='kde')# In[34]:# 针对Seriesdf['col1'].plot(kind='kde')# ## 10、面积图# In[35]:df.plot(kind='area', stacked=False)# ## 11、多子图## 绘制子图主要的参数:## subplots: 默认False, 如果希望每列绘制子图, 则赋值为True# layout: 子图的布局, 即画布被横竖分为几块, 如:(2,3)表示2行3列# figsize: 整个画布大小# In[36]:df.plot(subplots=True,layout=(1,3), # 1行3列figsize=(15,6),kind="bar")# In[37]:# 共享y轴df.plot(subplots=True,layout=(1,3), # 1行3列figsize=(15,6),kind="bar",sharey=True # 开启共享y轴)# ## 12、散点矩阵图## In[38]:# 单图导入from pandas.plotting import scatter_matrixscatter_matrix(df1,alpha=0.5,figsize=(14,6),diagonal="kde")# ## 13、平行分类图# In[41]:# 导图模块from pandas.plotting import parallel_coordinatesparallel_coordinates(df, # 数据class_column="col1", # 分类名称所用字段color=('#556270', '#4ECDC4', '#C7F464') # 颜色设置)# 总结下Pandas内置绘图的特点:## - 代码量少,最大的优点# - 快速简洁,基本绘图可以满足# - 静态化,非动态可视化# - 图片质量一般
1、折线图
2、柱状图
3、散点图
4、饼图
5、箱型图

6、蜂窝图
7、直方图
9、密度图
10、面积图
11、多子图
12、散点矩阵图
13、平行分类图

若有收获,就点个赞吧
0 人点赞
