运维监控 — 快速搭建一个服务器性能监控系统
运维监控是大数据应用最为基础的功能之一,Pandora 提供的工作流引擎和时序数据库组合配合开源的 Telegraf 可以满足运维监控的需求!
监控内容
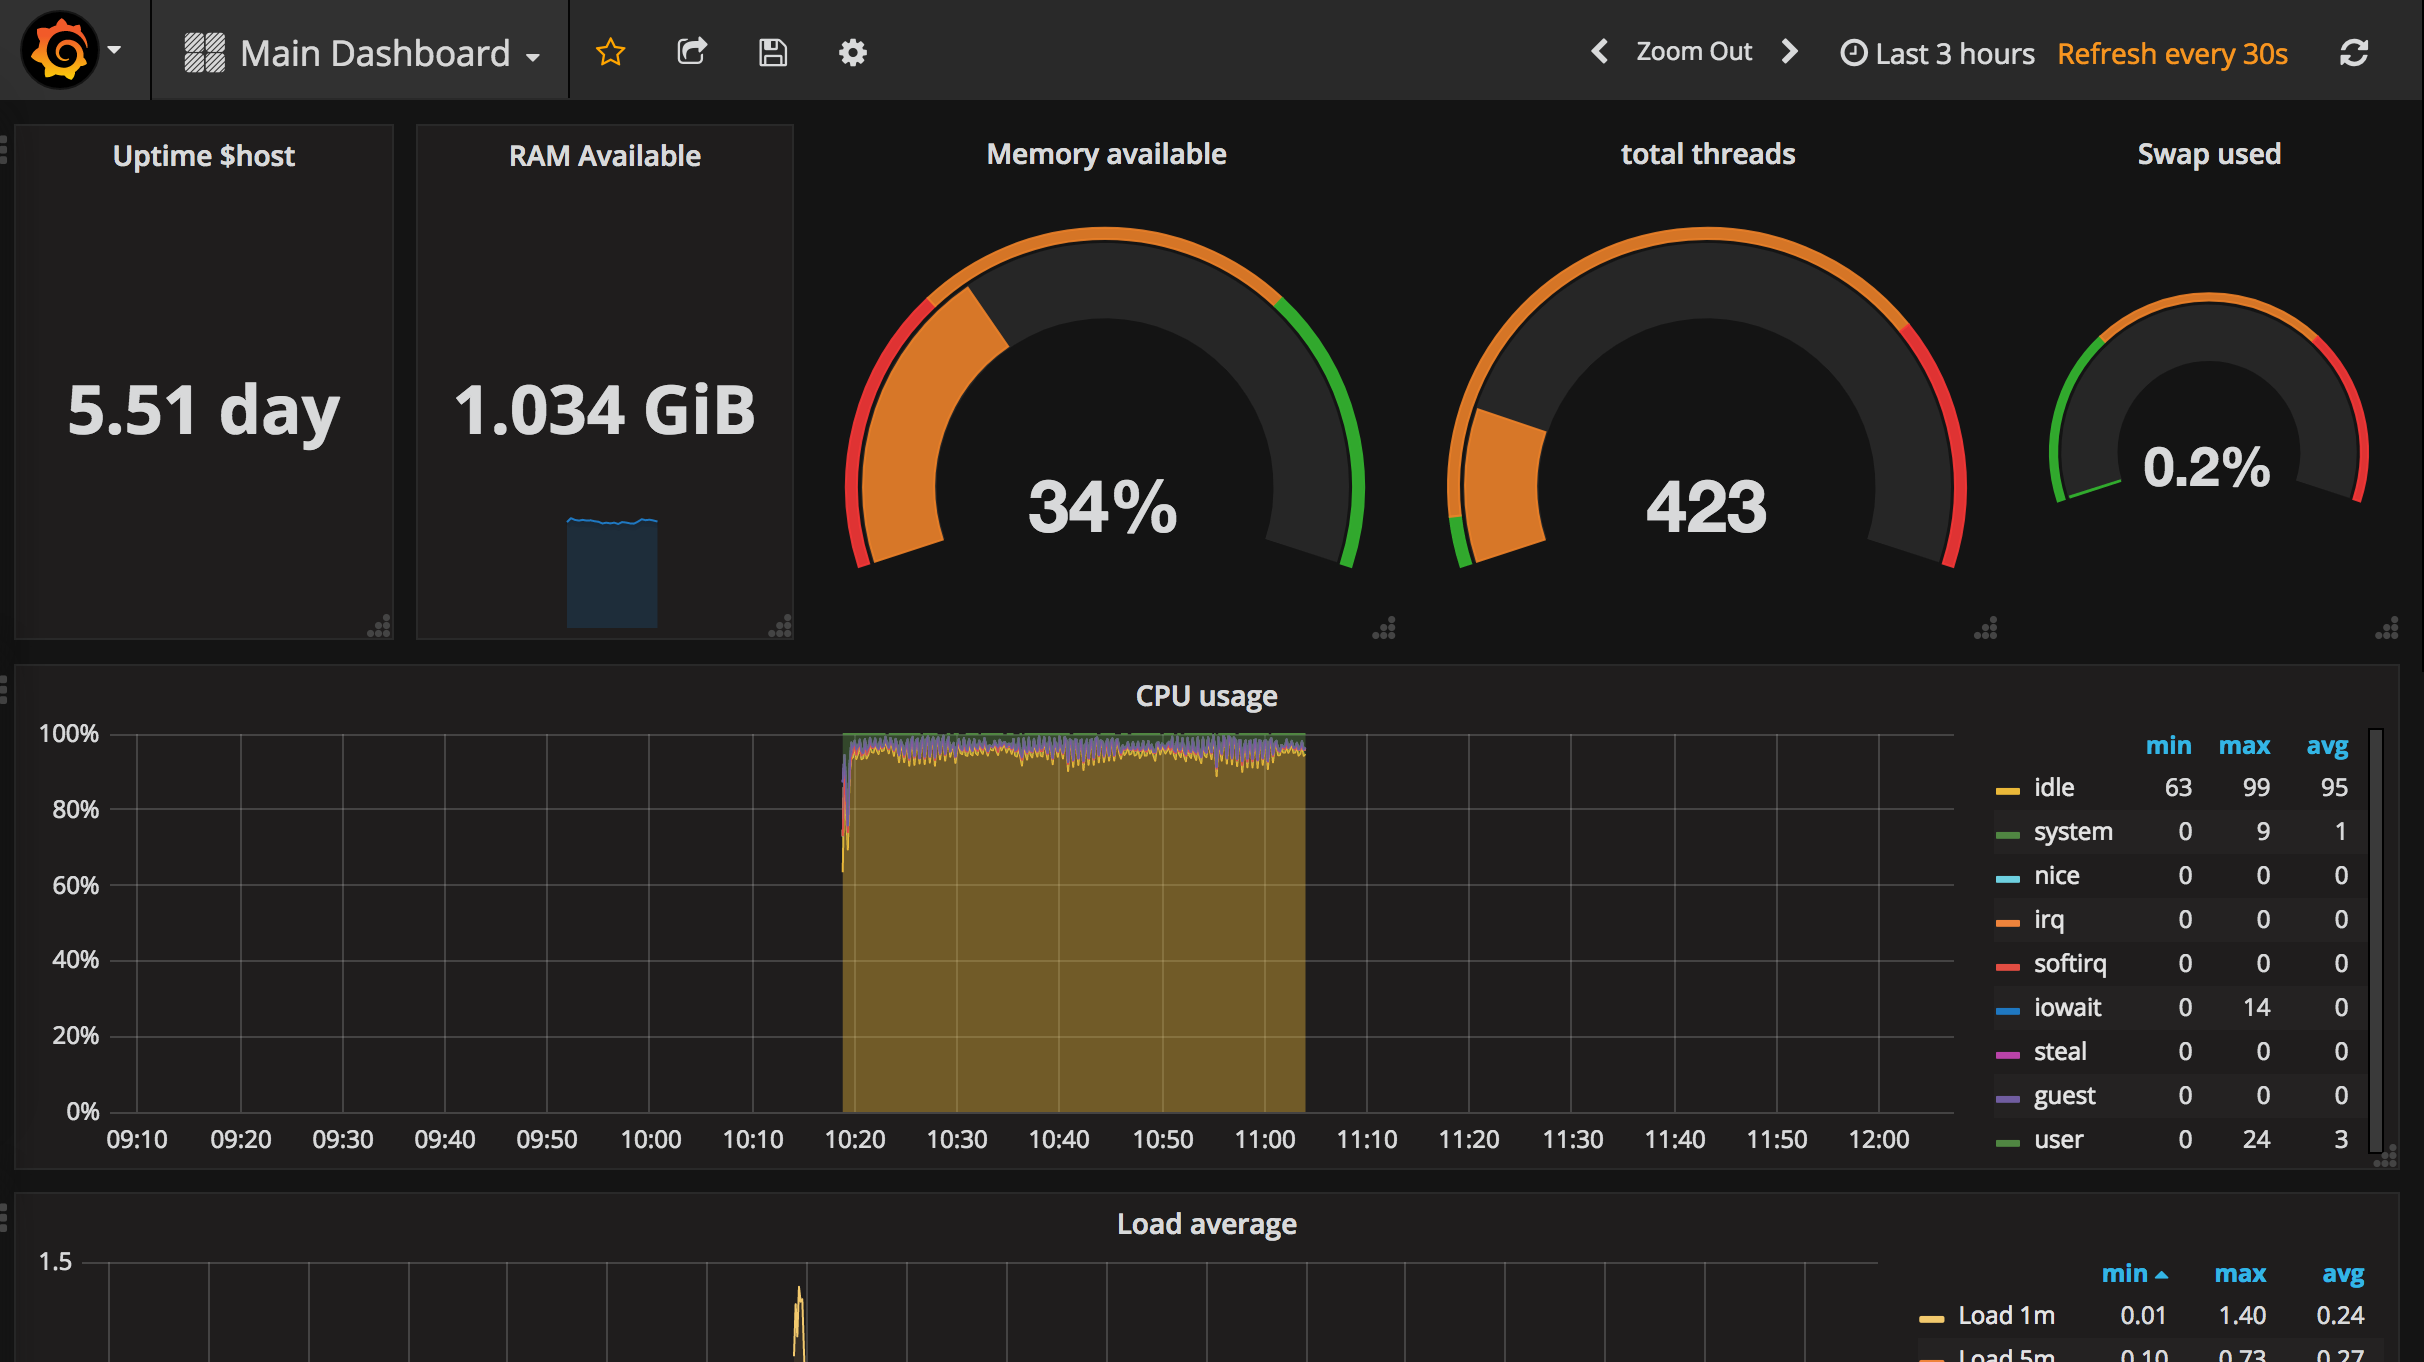
服务器基础性能信息:
- 运行时长;
- 可用内存;
- 可用内存百分比;
- 线程总数;
- SWAP 使用百分比;
- CPU 使用百分比;
- 平均负载;
- 当前内存使用情况;
- 内存使用情况分布;
- 进程分布情况;
- I/O 使用情况;
效果图
快速开始
下面就 Pandora 提供的组件来搭建一个运维监控应用,搭建这个应用只需要5步。
!> 注意,为了顺利使用 Pandora 的各种服务,第一,需要一个已经实名认证的七牛账户;第二,申请开通了 Pandora 的使用权限;
!> 注意:mac 版本的 Telegraf 存在不能收集 CPU,diskio 的问题,这是 Telegraf 本身的问题,此处的 mac 版本只做测试流程用途。
第一步:下载&配置
# linux 64位系统:wget http://orzfblcum.bkt.clouddn.com/telegraf.linux.amd64.tar.gz# linux 32位系统:wget http://orzfblcum.bkt.clouddn.com/telegraf.linux.386.tar.gz# mac系统:wget http://orzfblcum.bkt.clouddn.com/telegraf.darwin.amd64.tar.gz# 以linux系统为例,将下载的文件解压,然后将生成配置文件重定向到文件`telegraf.conf`中;tar xvf telegraf.linux.amd64.tar.gz./telegraf config > telegraf.conf
第二步:修改配置
将下列的配置信息填写完成后,复制到telegraf.conf文件的最顶端,然后保存telegraf.conf文件;
# Configuration for Pandora Pipeline server to send metrics to[[outputs.pipeline]]url = "https://pipeline.qiniu.com" # required## The target repo for metrics (telegraf will create it if not exists).repo = "monitor" # required## 是否自动创建seriesauto_create_repo = true## Write timeout (for the Pandora client), formatted as a string.## If not provided, will default to 5s. 0s means no timeout (not recommended).timeout = "5s"ak = "ACCESS_KEY"sk = "SECRET_KEY"
repo: 工作流名称,默认为 monitor;
ak: 七牛账户的公钥;
sk: 七牛账户的私钥;
第三步:启动&发送数据
用上述生成的配置文件启动 Telegraf,输入以下命令:
./telegraf -config telegraf.conf
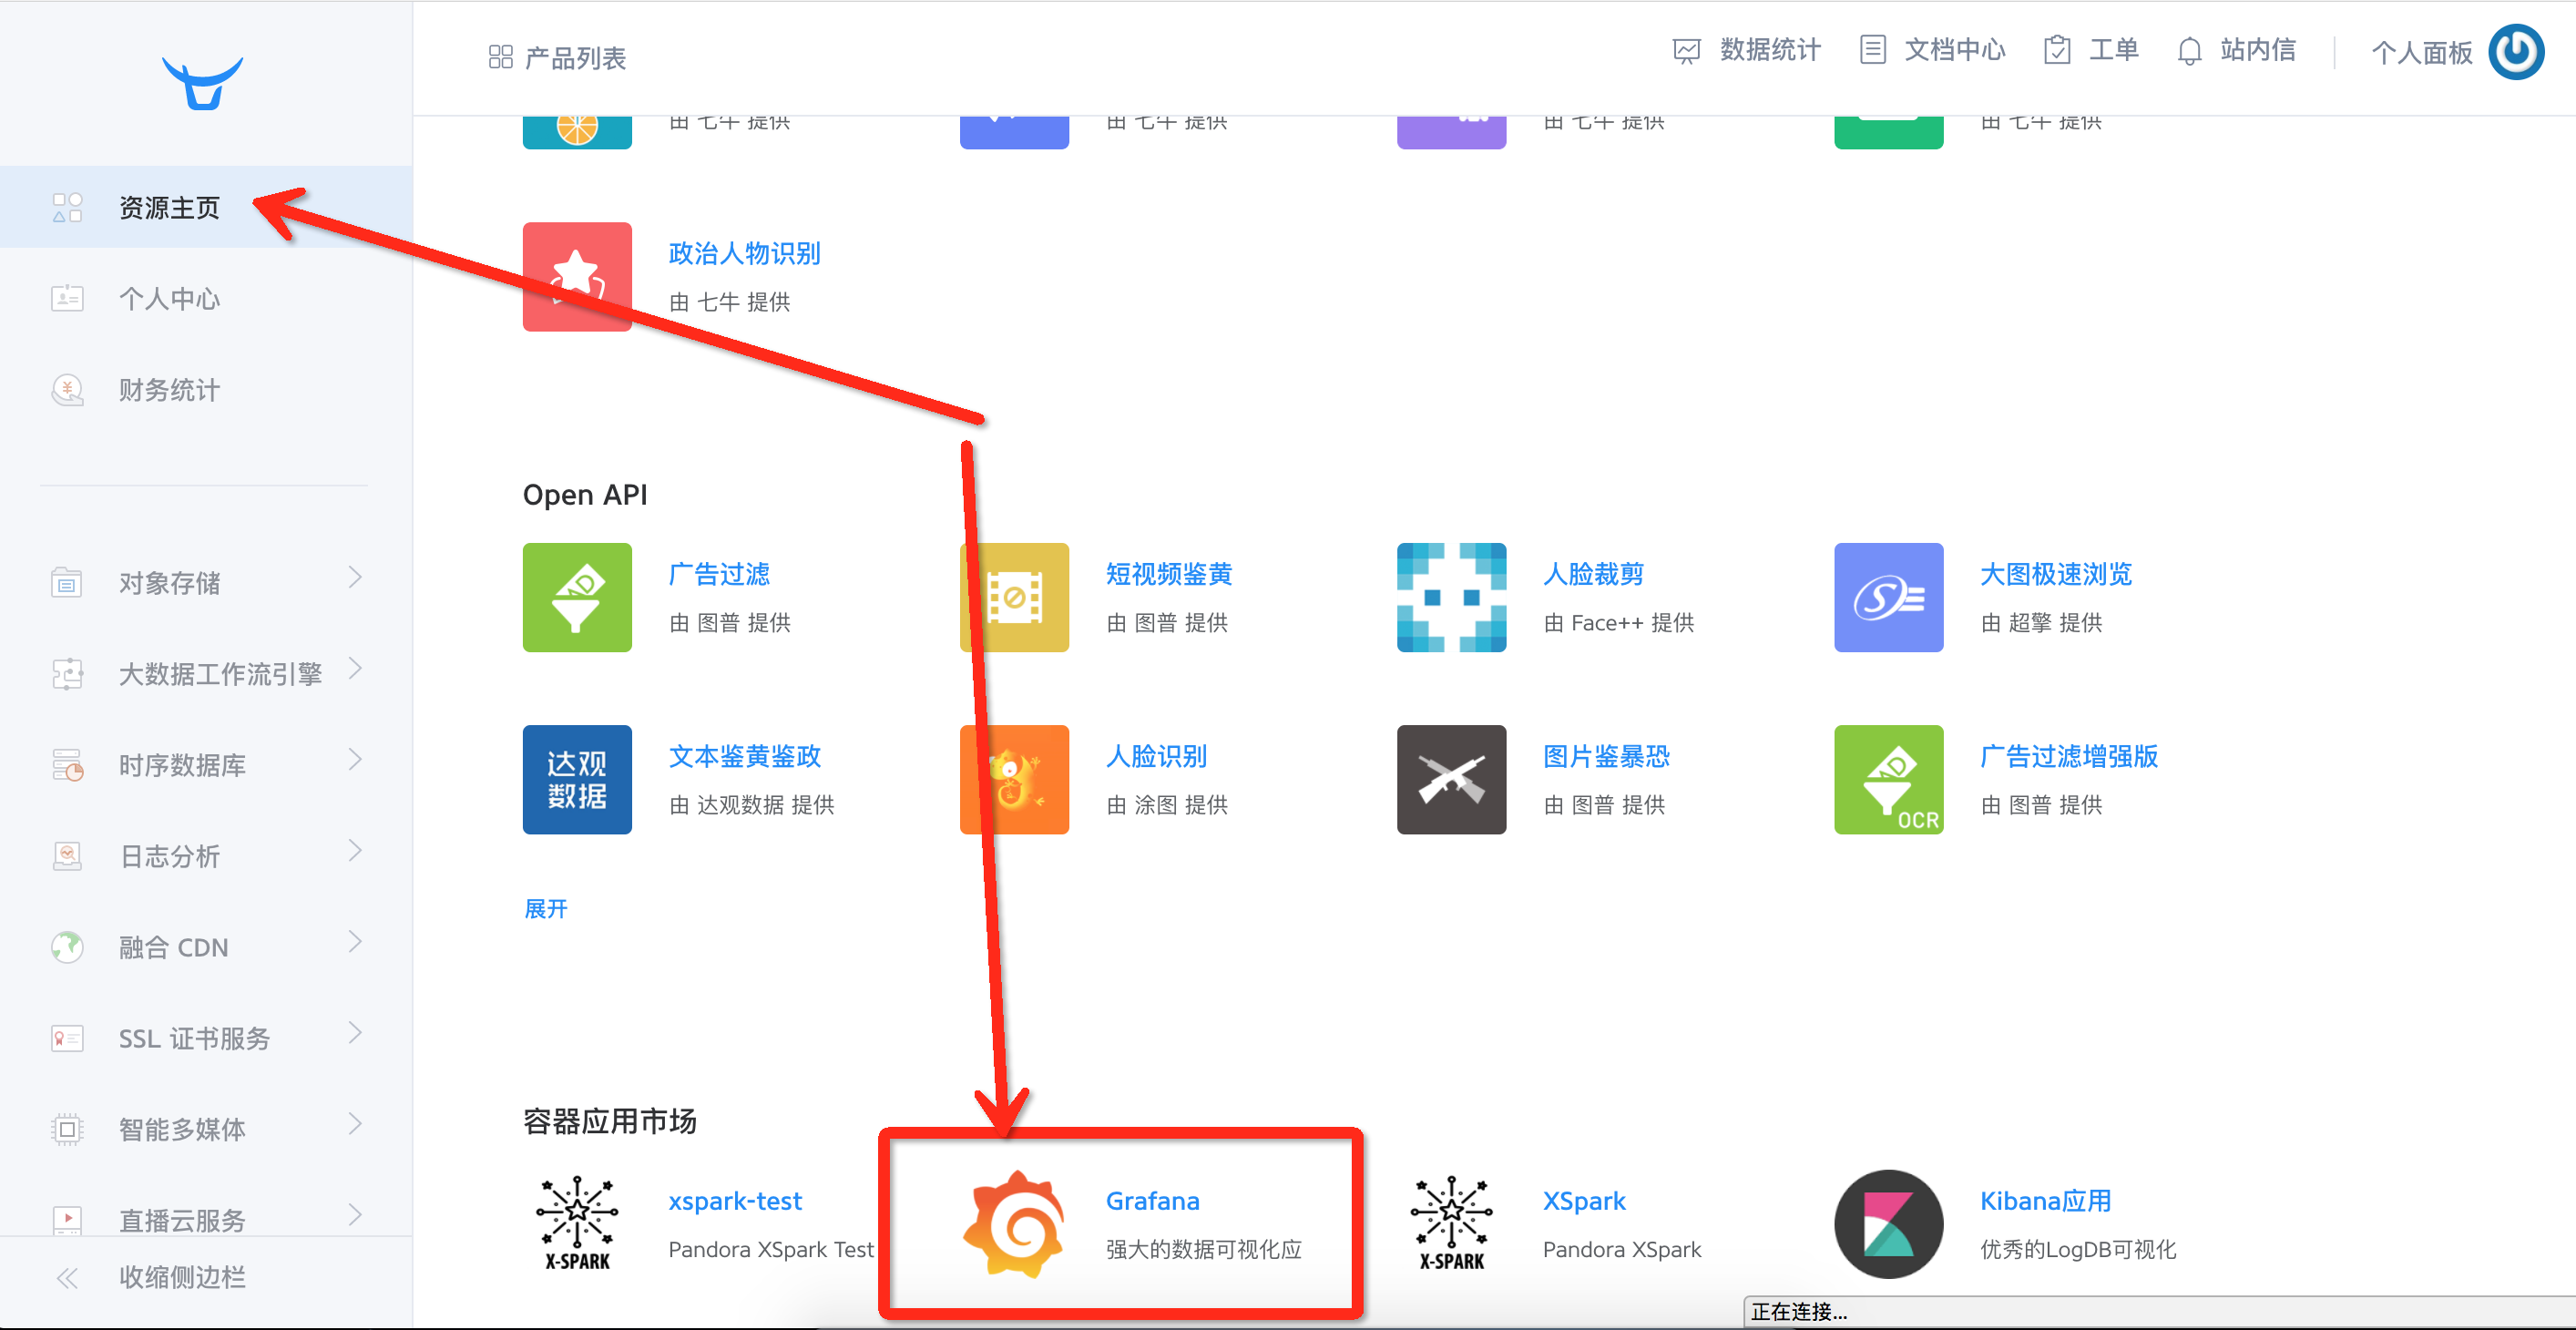
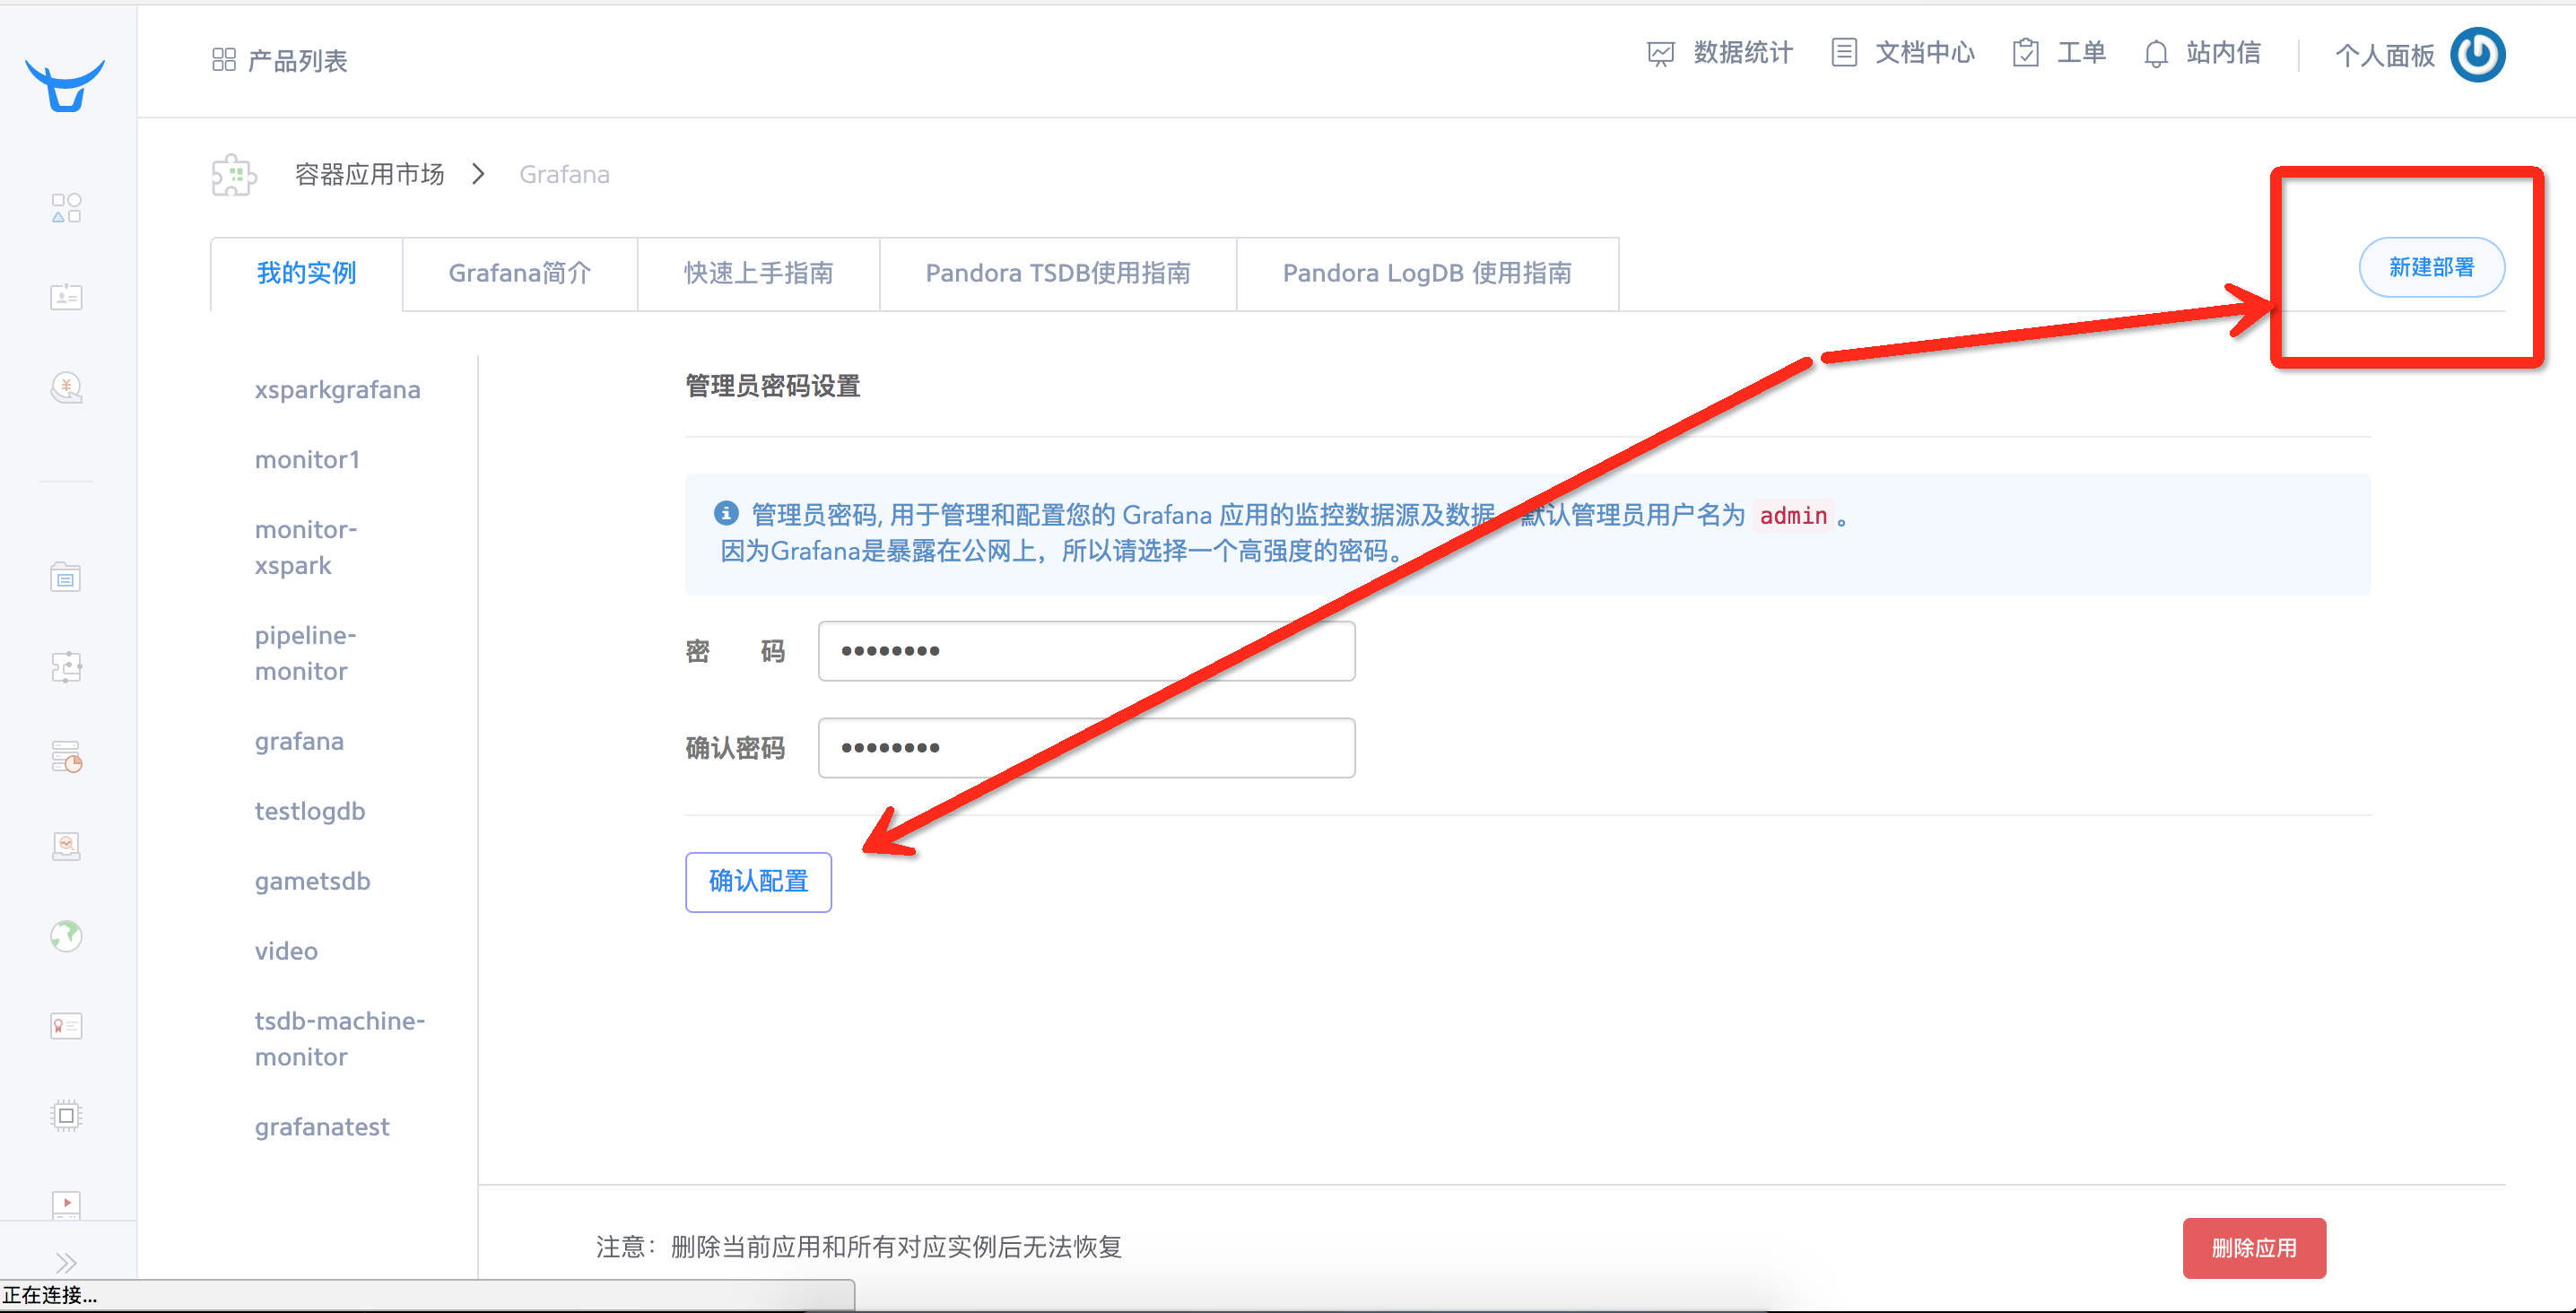
第四步: 配置 Grafana 数据源
在七牛应用市场打开 Grafana 应用,然后按照下图所示的配置:

注意事项:
第五步: 导入 Grafana dashboard 配置文件
下载 Grafana dashboard 配置文件
wget http://orzfblcum.bkt.clouddn.com/Main%20Dashboard.json
将下载的 dashboard 导入 Grafana

注意事项:
完成!

若有收获,就点个赞吧
0 人点赞
