1.merge
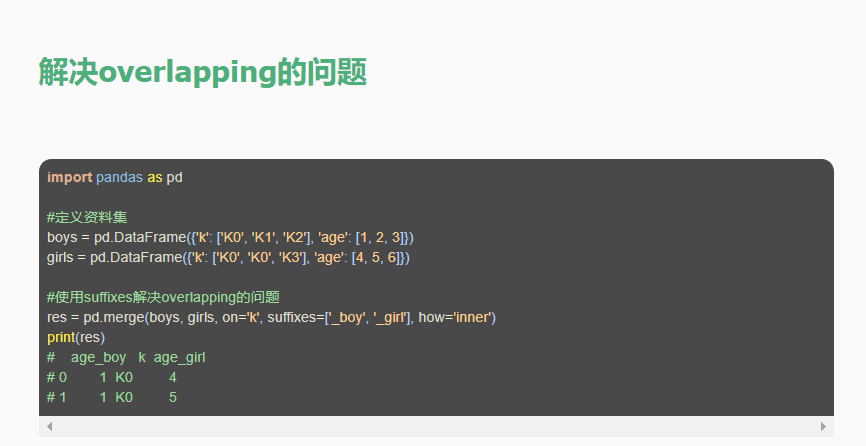
合并时有4种方法how = [‘left’, ‘right’, ‘outer’, ‘inner’],预设值how=’inner’。
indicator=True会将合并的记录放在新的一列。indicator=’indicator_column’修改indicator生成的列名

import pandas as pdstudents = pd.read_excel('tmp1\Student_Score.xlsx', sheet_name='Students')scores = pd.read_excel('tmp1\Student_Score.xlsx', sheet_name='Scores')tables = students.merge(scores, how='left', on='ID').fillna(0)# 默认inner join 内连,两个表进行数据联立时,如果联立不上就丢弃数据# 如果两个表没有相同的ID 就设置left_on= right_on=# left 意思就是无论条件成不成立 都保留左边表的数据 则保留students表的数据# fillna()指的是用什么来替代NaNtables.Score = tables.Score.astype(int) # 将Score那一列的数据变为int整型print(tables)"""ID Name Score0 1 Student_001 811 3 Student_003 832 5 Student_005 853 7 Student_007 874 9 Student_009 895 11 Student_011 916 13 Student_013 937 15 Student_015 958 17 Student_017 979 19 Student_019 9910 21 Student_021 011 23 Student_023 012 25 Student_025 013 27 Student_027 014 29 Student_029 015 31 Student_031 016 33 Student_033 017 35 Student_035 018 37 Student_037 019 39 Student_039 0"""
2.join
- join在进行左右联立表时,会默认用index进行联立,join有on参数 ,但是去掉了left_on和right_on参数
import pandas as pdstudents = pd.read_excel('tmp1\Student_Score.xlsx', sheet_name='Students', index_col='ID')scores = pd.read_excel('tmp1\Student_Score.xlsx', sheet_name='Scores', index_col='ID')tables = students.join(scores, how='left').fillna(0)# 默认inner join 内连,两个表进行数据联立时,如果联立不上就丢弃数据tables.Score = tables.Score.astype(int) # 将Score那一列的数据变为int整型print(tables)
3.concat
concat将两张表串联起来默认从上到下0,
可以将数据根据不同的轴作简单的融合
参数说明
objs: series,dataframe或者是panel构成的序列list
axis: 需要合并链接的轴,0是行,1是列
join:连接的方式 inner,或者outer,join=’outer’为预设值,因此未设定任何参数时,函数默认join=’outer’。此方式是依照column来做纵向合并,有相同的column上下合并在一起,其他独自的column个自成列,原本没有值的位置皆以NaN填充。
join = ‘innner’表示只有相同的column合并在一起,其他的会被抛弃。
import pandas as pdimport numpy as nppage_001 = pd.read_excel('tmp1\Students16.xlsx', sheet_name='Page_001')page_002 = pd.read_excel('tmp1\Students16.xlsx', sheet_name='Page_002')# concat将两张表串联起来默认从上到下0students = pd.concat([page_001, page_002]).reset_index(drop=True)print(students)# reset_index()重置index,drop=Ture删去原index"""ID Name Score0 1 Student_001 901 2 Student_002 902 3 Student_003 903 4 Student_004 904 5 Student_005 905 6 Student_006 906 7 Student_007 907 8 Student_008 908 9 Student_009 909 10 Student_010 9010 11 Student_011 9011 12 Student_012 9012 13 Student_013 9013 14 Student_014 9014 15 Student_015 9015 16 Student_016 9016 17 Student_017 9017 18 Student_018 9018 19 Student_019 9019 20 Student_020 9020 21 Student_021 8021 22 Student_022 8022 23 Student_023 8023 24 Student_024 8024 25 Student_025 8025 26 Student_026 8026 27 Student_027 8027 28 Student_028 8028 29 Student_029 8029 30 Student_030 8030 31 Student_031 8031 32 Student_032 8032 33 Student_033 8033 34 Student_034 8034 35 Student_035 8035 36 Student_036 8036 37 Student_037 8037 38 Student_038 8038 39 Student_039 8039 40 Student_040 80"""
4.append()
append是series和dataframe的方法,使用它就是默认沿着列进行凭借(axis = 0,列对齐)
# pd.append(data2) # 在数据框data2的末尾添加数据框data1,其中data1和data2的列数应该相等
成绩最值比较(最好的成绩与最差的成绩)
print(data.sort_values('Score').head(1).append(data.sort_values('Score').tail(1)))"""ID Name Age Score10 11 Student_011 22 502 3 Student_003 33 100"""

