简介
ClickHouse运行时会将一些个自身的运行状态记录到众多系统表中(system.*)。所以我们对CH自身的一些运行指标的监控数据,也主要来自这些系统表。
但是直接查询这些系统表会有一些不足之处:
这种方式太过底层,不够直观,我们还需要在此之上实现可视化展示;
系统表只记录了CH自己的运行指标,有些时候我们需要外部系统的指标进行关联分析,例如Zookeeper、服务器CPU、IO等等。
现在Prometheus + Grafana的组合比较流行,安装简单易上手,可以集成很多框架,包括服务器的负载,其中Prometheus负责收集各类系统的运行指标;Grafana负责可视化的部分。
ClickHouse从v20.1.2.4开始,内置了对接Prometheus的功能,配置的方式也很简单,可以将其作为Prometheus的Endpoint服务,从而自动的将metrics、events和asynchronous_metrics三张系统的表的数据发送给Prometheus。
Prometheus&Grafana的安装
Prometheus下载地址:https://prometheus.io/download/ Grafana下载地址:https://grafana.com/grafana/download/安装Prometheus
1、解压,修改配置文件prometheus.yml,添加如下
- job_name: 'clickhouse-1'static_configs:- targets: ['box1:9363']

配置说明:
- global配置块:控制Prometheus服务器的全局配置
- scrape_interval:配置拉取数据的时间间隔,默认为1分钟。
- evaluation_interval:规则验证(生成alert)的时间间隔,默认为1分钟
- rule_file配置块:规则配置文件
- scrape_configs配置块:配置采集目标相关,prometheus监视的目标。Prometheus自身的运行信息可以通过HTTP访问,所以Prometheus可以监控自己的运行数据。
- job_name:监控作业的名称。
- static_configs:表示静态目标配置,就是固定从某个target拉取数据
targets:指定监控的目标,其实就是从哪里获取数据。Prometheu会从http://hadoop3:9363/metrics上拉取数据。
Prometheus是可以在运行时自动加载配置的。启动时需要添加:-web.enable-lifecycle
启动Prometheus Server
浏览器输入:http://box1:9090
nohup ./prometheus --config.file=prometheus.yml > ./prometheus.log 2>&1 &
Grafana安装
启动Grafana:打开web:http://box1:3000,默认用户名和密码是:admin
nohup ./bin/grafana-server web > ./grafana.log 2>&1 &
ClickHouse配置
修改每个节点下的配置文件,并重启服务: 编辑/etc/clickhouse-server/config.xml,打开如下配置:网页打开http://box1:9363/metrics
<prometheus><endpoint>/metrics</endpoint><port>9363</port><metrics>true</metrics><events>true</events><asynchronous_metrics>true</asynchronous_metrics><status_info>true</status_info></prometheus>
Grafana集成Prometheus
添加数据源Prometheus
1、点击配置,点击Data Sources: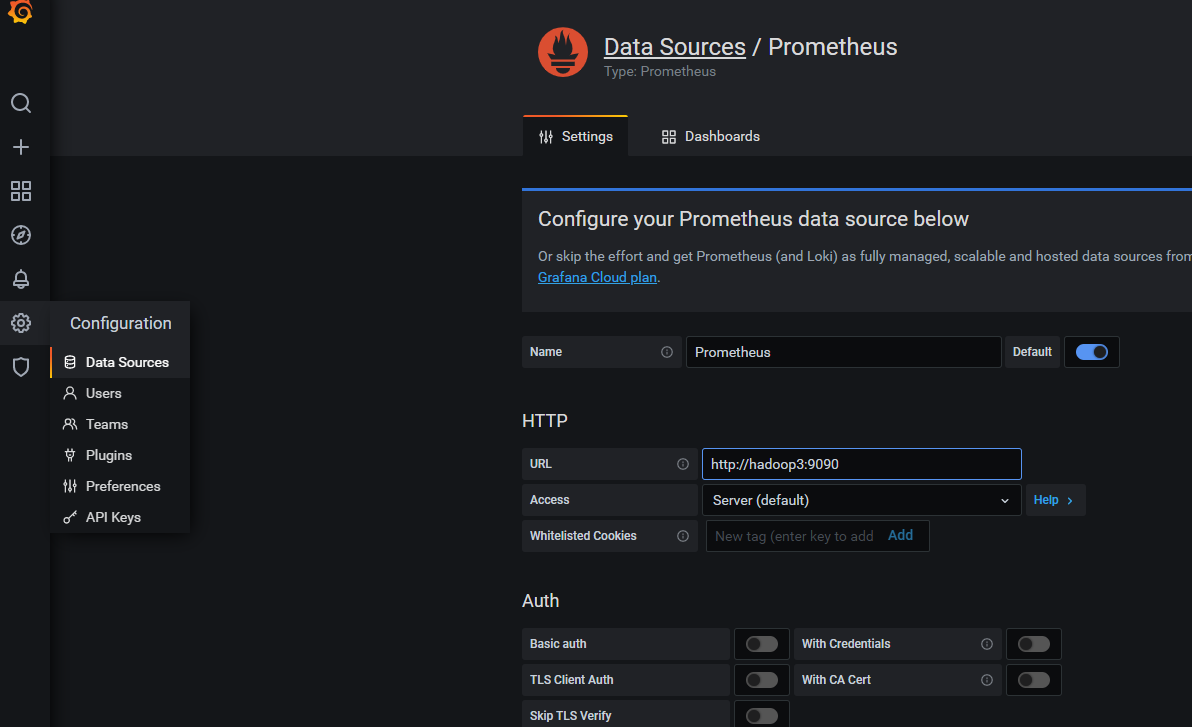
添加监控
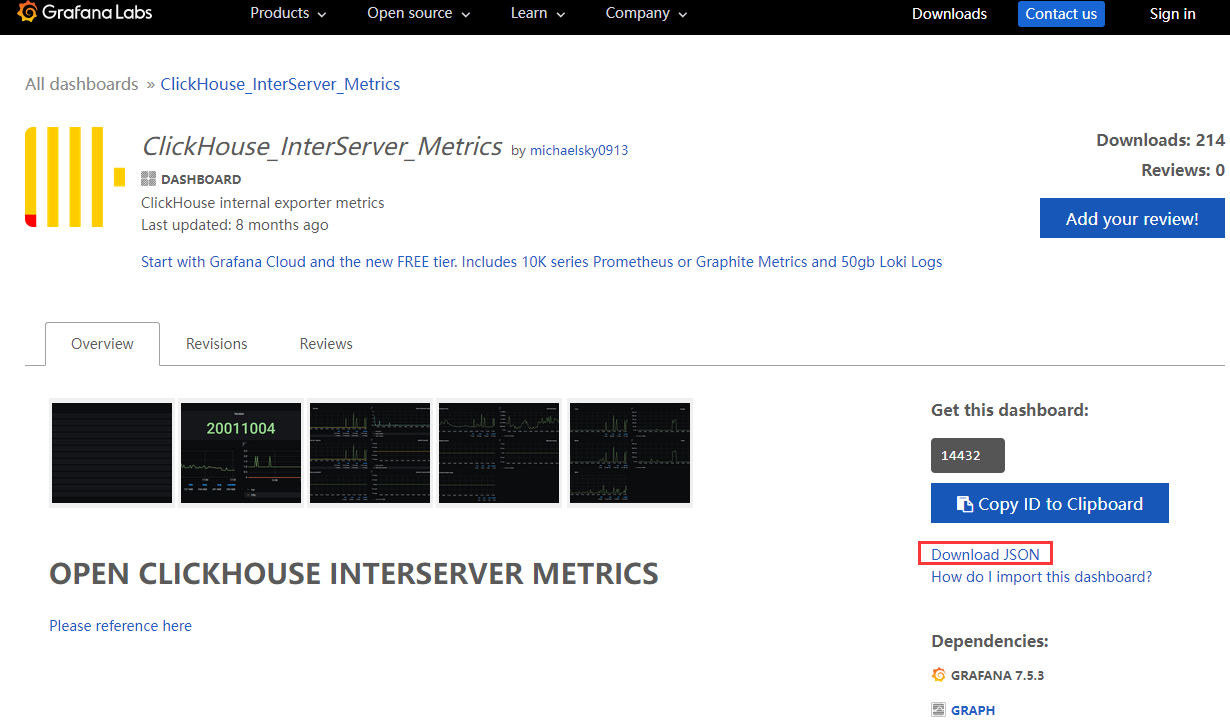
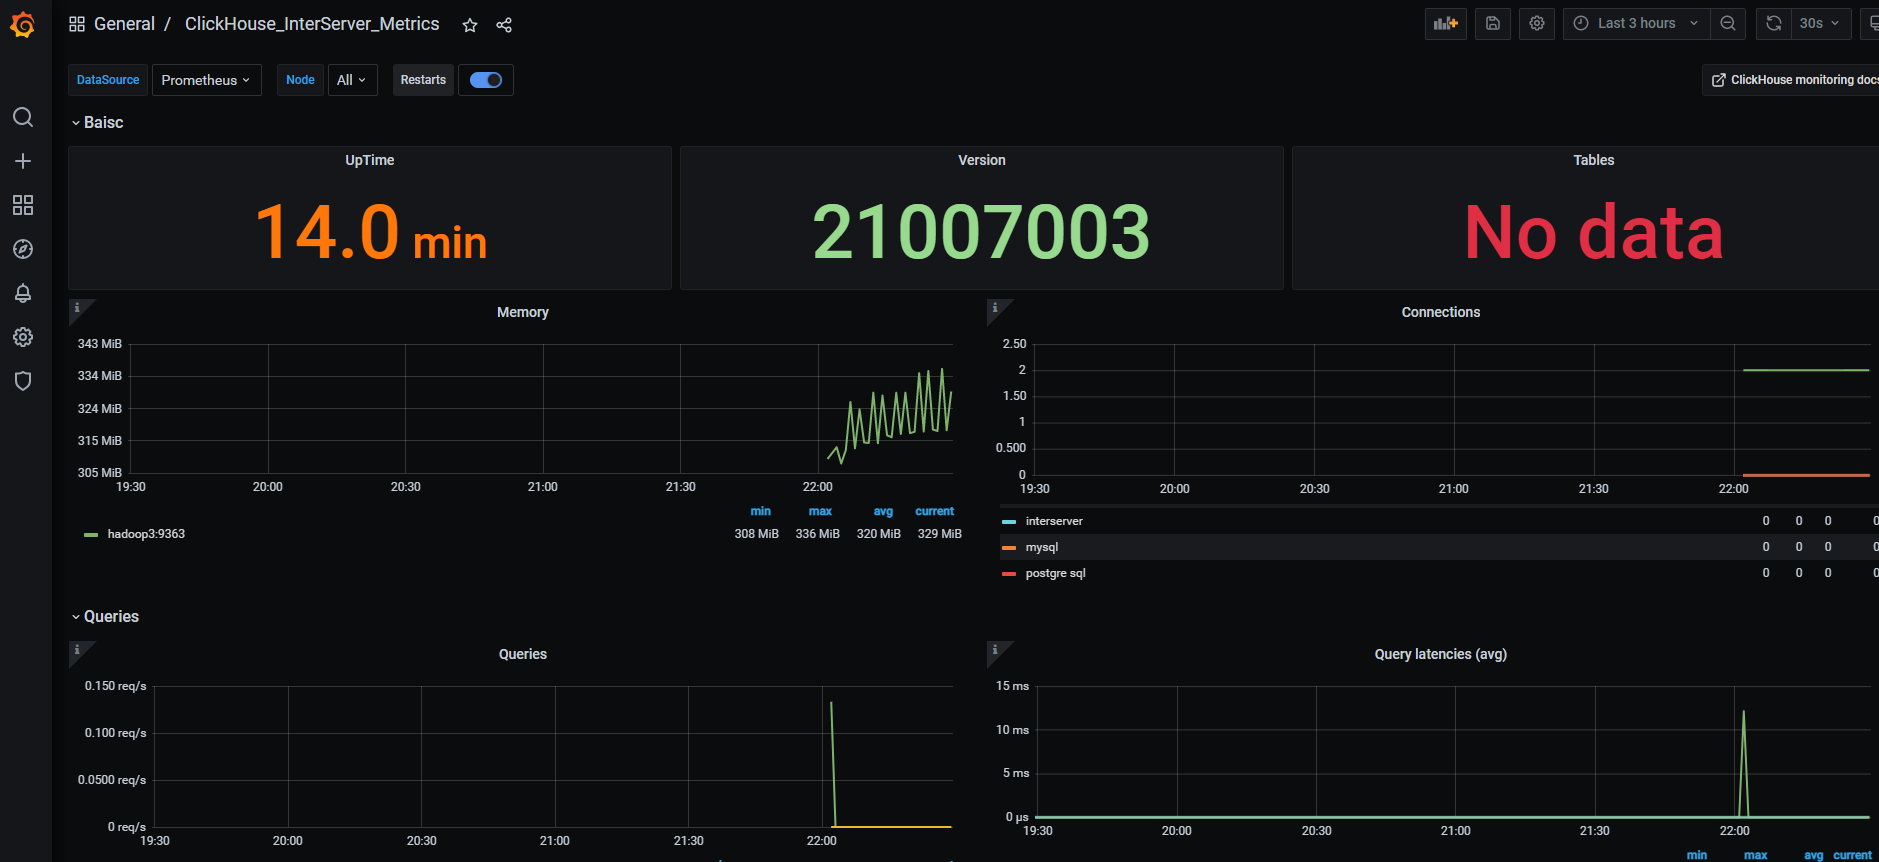
手动一个个添加Dashboard比较繁琐,Grafana社区鼓励用户分享Dashboard,通过https://grafana.com/dashboards网站,可以找到大量可直接使用的Dashboard模版。
Grafana中所有的Dashboard通过JSON进行共享,下载并且导入这些JSON文件,就可以直接使用这些已经定义好的Dashboard。1、例如,点击Download JSON即可下载


若有收获,就点个赞吧
0 人点赞
