我们已经知道 Hystrix 提供了监控的功能,可以通过 hystrix.stream 端点来获取监控数据,但是这些数据是以字符串的形式展现的,实际使用中不方便查看。我们可以借助 Hystrix Dashboard 对监控进行图形化展示。
Hystrix Dashboard 是一款针对 Hystrix 进行实时监控的工具,通过 Hystrix Dashboard 可以直观地看到各 Hystrix Command 的请求响应时间,请求成功率等数据。
下面我们单独创建一个项目来集成 dashboard。
创建一个 Maven 项目 hystrix-dashboard-demo,在 pom.xml 中添加 dashboard 的依赖,代码如下所示。
<dependency><groupId>org.springframework.cloud</groupId><artifactId>spring-cloud-starter-netflix-hystrix-dashboard</artifactId></dependency>
创建启动类,在启动类上添加 @EnableHystrixDashboard 注解,代码如下所示。
@SpringBootApplication@EnableHystrixDashboardpublic class DashboardApplication {public static void main(String[] args) {SpringApplication.run(DashboardApplication.class, args);}}
在属性配置文件中只需要配置服务名称和服务端口:
spring.application.name=hystrix-dashboard-demoserver.port=9011
然后启动服务,访问 http://localhost:9011/hystrix 就可以看到 dashboard 的主页,如图 1 所示。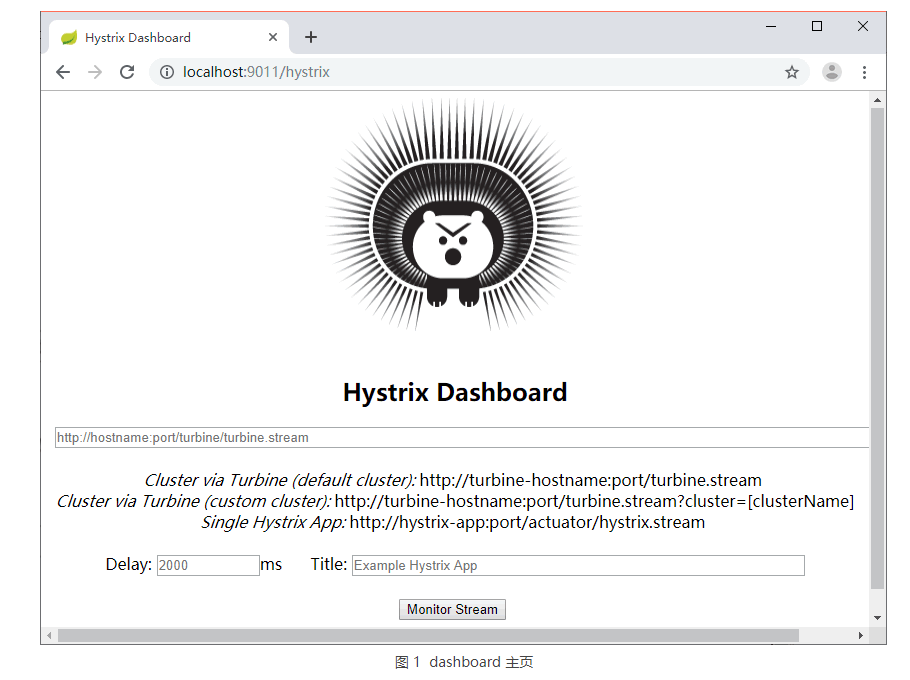
在主页中有 3 个地方需要我们填写,第一行是监控的 stream 地址,也就是将之前文字监控信息的地址输入到第一个文本框中。第二行的 Delay 是时间,表示用多少毫秒同步一次监控信息,Title 是标题,这个可以随便填写,如图 2 所示。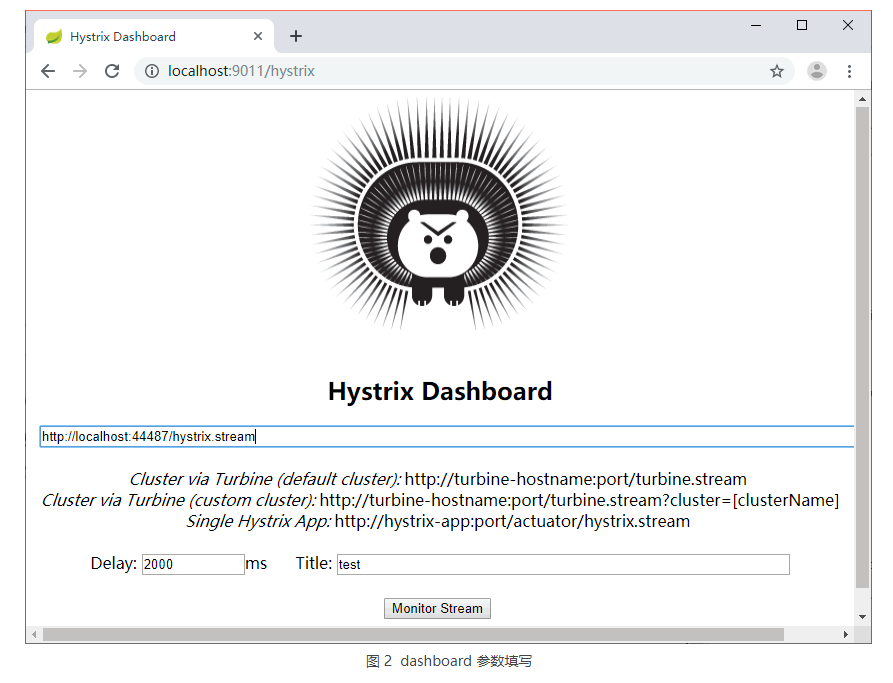
输入完成后就可以点击 Monitor Stream 按钮以图形化的方式查看监控的数据了,如图 3 所示。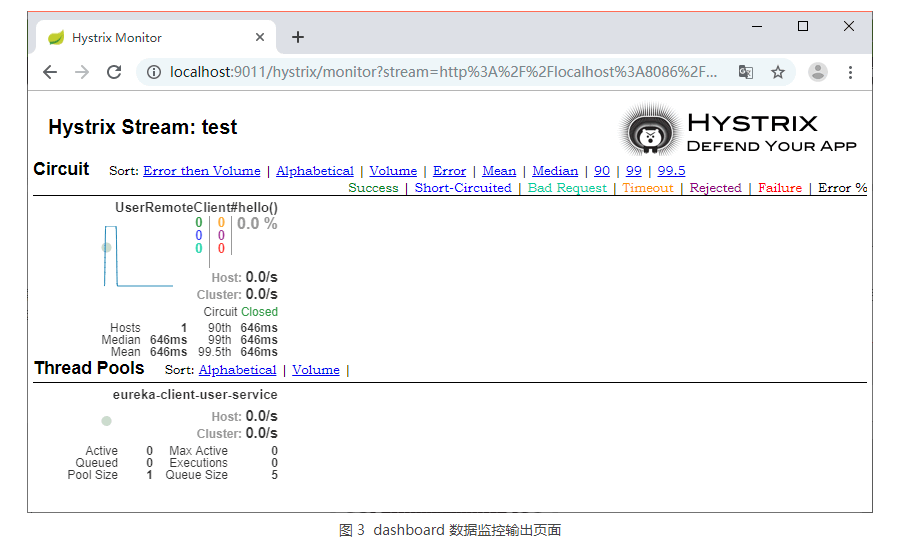

若有收获,就点个赞吧
0 人点赞
