1. 告警方式
1.1. Prometheus 告警介绍
与Zabbix告警不同,Prometheus将告警分为两个部分:Prometheus 和 Alertmanager。其中Prometheus配置告警触发规则,对指标进行监控和计算,将再将告警信息发送到Alertmanager中。Alertmanager对告警进行管理,比如合并抑制等操作。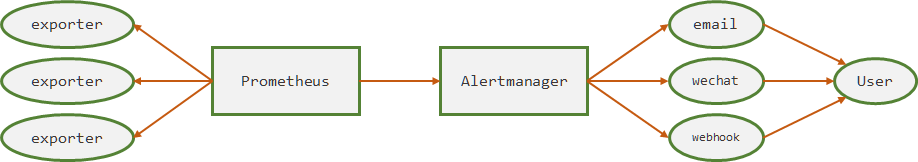
1.2. AlertManager介绍
Alertmanager处理由客户端应用程序(例如Prometheus服务器)发送的警报。它负责将重复数据删除,分组和路由到正确的接收者,通知方式有电子邮件、短信、微信等。它还负责沉默和禁止警报。Altermanager有以下几个功能点
- 分组
当机房网络故障时,或者机房断电时,会突然有大量相同的告警出现,此时就需要对告警进行分组聚合,整合成少量告警发出。每个告警信息中会列出受影响的服务或者机器。
- 抑制(Inhibition)
当集群故障时,会引发一系列告警,此时只需要通知集群故障,其它因为集群故障引起的告警应该被抑制,避免干扰判断。
- 静默(Silences)
当集群升级、服务更新的过程中,大概率导致告警。因此在升级期间,对这些告警进行静默,不再发送相关告警。
2. 告警相关配置
2.1. altermanager配置文件
2.1.1. 全局配置
# global 指定了默认的接收者配置项global:# 默认smtp 配置项,如果recivers中没有配置则采用全局配置项[ smtp_from: <tmpl_string> ][ smtp_smarthost: <string> ][ smtp_hello: <string> | default = "localhost" ][ smtp_auth_username: <string> ][ smtp_auth_password: <secret> ][ smtp_auth_identity: <string> ][ smtp_auth_secret: <secret> ][ smtp_require_tls: <bool> | default = true ]# 企业微信告警配置[ wechat_api_url: <string> | default = "https://qyapi.weixin.qq.com/cgi-bin/" ][ wechat_api_secret: <secret> ][ wechat_api_corp_id: <string> ]# 默认http客户端配置,不推荐配置。参考官方文档: https://prometheus.io/docs/alerting/latest/clients/[ http_config: <http_config> ]# 如果警报不包含EndsAt,则ResolveTimeout是Alertmanager使用的默认值,经过此时间后,如果尚未更新,则可以将警报声明为已解决。# 这对Prometheus的警报没有影响,因为它们始终包含EndsAt。[ resolve_timeout: <duration> | default = 5m ]# 定义通知模板,最好一个列表元素可以使用Linux通配符,如 *.tmpltemplates:[ - <filepath> ... ]# 定义路由route: <route># 定义通知的接收者receivers:- <receiver> ...# 告警抑制规则inhibit_rules:[ - <inhibit_rule> ... ]
2.1.2. 路由配置
每个警报都会在已配置的顶级路由处进入路由树,该路由树必须与所有警报匹配(即没有任何已配置的匹配器)。然后遍历子节点。如果将continue设置为false,它将在第一个匹配的子项之后停止。如果在匹配的节点上true为true,则警报将继续与后续的同级进行匹配。如果警报与节点的任何子节点都不匹配(不匹配的子节点或不存在子节点),则根据当前节点的配置参数来处理警报。
# 告警接收者
[ receiver: <string> ]
# 告警根据标签进行分组,相同标签的作为一组进行聚合,发送单条告警信息。特殊值 '...' 表示告警不聚合
[ group_by: '[' <labelname>, ... ']' ]

# 告警是否匹后续的同级节点,如果为true还会继续进行规则匹配,否则匹配成功就截止
[ continue: <boolean> | default = false ]

# 报警必须匹配到labelname,否则无法匹配到该组路由,一般用于发送给不同联系人时使用
match:
  [ <labelname>: <labelvalue>, ... ]
match_re:
  [ <labelname>: <regex>, ... ]

# 第一次发送当前group报警等待的时间,目的是实现同组告警的聚合
[ group_wait: <duration> | default = 30s ]

# 当上一次group告警发送成功后,改组又出现新的告警,那么等待多久再发送,一般设置为5分钟或者更久
[ group_interval: <duration> | default = 5m ]

# 已经发送成功的告警,但是一直没消除,那么等待多久再发送。一般推荐三个小时以上
[ repeat_interval: <duration> | default = 4h ]

# 子路由
routes:
  [ - <route> ... ]
2.1.3. 接收者配置
# 接收者名称,唯一标识
name: <string>

# 接收方式
email_configs:
  [ - <email_config>, ... ]
pagerduty_configs:
  [ - <pagerduty_config>, ... ]
pushover_configs:
  [ - <pushover_config>, ... ]
slack_configs:
  [ - <slack_config>, ... ]
opsgenie_configs:
  [ - <opsgenie_config>, ... ]
webhook_configs:
  [ - <webhook_config>, ... ]
victorops_configs:
  [ - <victorops_config>, ... ]
wechat_configs:
  [ - <wechat_config>, ... ]
- email_configs
```yaml
通过该机器发送邮件
[ smarthost:| default = global.smtp_smarthost ] SMTP server 信息
[ hello:| default = global.smtp_hello ] SMTP 认证信息
[ auth_username:| default = global.smtp_auth_username ] [ auth_password: | default = global.smtp_auth_password ] [ auth_secret: | default = global.smtp_auth_secret ] [ auth_identity: | default = global.smtp_auth_identity ]
TLS configuration.
[ require_tls:
发件人
[ from:
收件人
to:
邮件标题
[ headers: {
邮件html正文信息
[ html:
邮件text正文信息
[ text:
是否通知已恢复的告警
[ send_resolved:
- wechat_configs

邮件告警有个两个很大的问题:容易被屏蔽或者当成垃圾邮件;延迟比较高。推荐使用微信或者钉钉告警,网上有相当丰富的博客案例。
```yaml
# 是否通知已恢复的告警
[ send_resolved: <boolean> | default = false ]

# The API key to use when talking to the WeChat API.
[ api_secret: <secret> | default = global.wechat_api_secret ]

# Wechat API 地址
[ api_url: <string> | default = global.wechat_api_url ]

# The corp id for authentication.
[ corp_id: <string> | default = global.wechat_api_corp_id ]

# API request data as defined by the WeChat API.
[ message: <tmpl_string> | default = '{{ template "wechat.default.message" . }}' ]
[ agent_id: <string> | default = '{{ template "wechat.default.agent_id" . }}' ]
[ to_user: <string> | default = '{{ template "wechat.default.to_user" . }}' ]
[ to_party: <string> | default = '{{ template "wechat.default.to_party" . }}' ]
[ to_tag: <string> | default = '{{ template "wechat.default.to_tag" . }}' ]
2.1.4. 告警抑制(inhibit_rules)配置
告警抑制是针对,系统已经发出A告警,对后续出现的由A告警引发的B告警进行抑制。流程就是:满足 source_match[_re] 的A 告警已触发,B告警满足 target_match[_re] ,且A和B在 equal 列表中的标签值全部相等,此时抑制告警B。需要注意的是,空值标签和缺少这个标签的值在语义上是相等的!
target_match:
  [ <labelname>: <labelvalue>, ... ]
target_match_re:
  [ <labelname>: <regex>, ... ]
source_match:
  [ <labelname>: <labelvalue>, ... ]
source_match_re:
  [ <labelname>: <regex>, ... ]
[ equal: '[' <labelname>, ... ']' ]
2.2. Prometheus Alerting Config
Prometheus 中alerting config 是用来定义 prometheus 和 alertmanager 通信方式的,在 prometheus.yml 文件中一级字段
# 告警配置
alerting:
  # 告警标签重写,参考 https://www.yuque.com/duduniao/linux/pkgsgv#ZoFlS
  alert_relabel_configs:
    [ - <relabel_config> ... ]
  # alertmanager 配置,用于配置和发现alermanager实例
  alertmanagers:
    # 向alertmanager发送告警的超时时间
    - [ timeout: <duration> | default = 10s ]
      # 使用alertmanager的API版本
      [ api_version: <string> | default = v1 ]
      # HTTP报警路径前缀
      [ path_prefix: <path> | default = / ]
      # 请求协议
      [ scheme: <scheme> | default = http ]
      # 向请求添加Authorization header
      basic_auth:
        [ username: <string> ]
        [ password: <secret> ]
        [ password_file: <string> ]
      [ bearer_token: <string> ]
      [ bearer_token_file: <filename> ]
      # Configures the scrape request's TLS settings.
      tls_config:
        [ <tls_config> ]
      # Optional proxy URL.
      [ proxy_url: <string> ]

      # 自动发现alertmanager的方式,与target的自动发现一致
      file_sd_configs:
        [ - <file_sd_config> ... ]
      kubernetes_sd_configs:
        [ - <kubernetes_sd_config> ... ]
      static_configs:
        [ - <static_config> ... ]
      # 对发现的alertmanager进行筛选和标签重写,比如API中PATH
      relabel_configs:
        [ - <relabel_config> ... ]
2.3. Prometheus Alerting Rules
groups:
  # 组名,一个文件中唯一标识
  - name: <string>
    [ interval: <duration> | default = global.evaluation_interval ]
    rules:
      - alert: <string> # 报警名称
        expr: <string>  # 报警规则表达式
        [ for: <duration> | default = 0s ] # 当触发条件持续指定时间再发送告警,发送前告警为pending
        labels:         # 告警标签
            [ <labelname>: <tmpl_string> ] # 会覆盖已有的标签,用于后面alertmanager中筛选
        annotations:         # 告警注释
          [ <labelname>: <tmpl_string> ]   # 一般添加发送邮件的内容、标题等等。常用字段有:summary,description
2.4. 告警屏蔽
当前机器数量太少,演示不方便,后续再补充。
3. 案例
| prometheus-72 | 10.4.7.72 | CentOS Linux release 7.5 | Prometheus,Alertmanager,Node_exporter |
|---|---|---|---|
| grafana-79 | 10.4.7.79 | CentOS Linux release 7.5 | Node_exporter,Grafana |
3.1. 安装和配置Alertmanager
3.1.1. 安装alertmanager
[root@prometheus-72 ~]# cd /opt/src/
[root@prometheus-72 src]# wget https://github.com/prometheus/alertmanager/releases/download/v0.21.0/alertmanager-0.21.0.linux-amd64.tar.gz
[root@prometheus-72 src]# tar -xf alertmanager-0.21.0.linux-amd64.tar.gz -C /opt/release/
[root@prometheus-72 src]# ln -s /opt/release/alertmanager-0.21.0.linux-amd64 /opt/apps/alertmanager
[root@prometheus-72 src]# mkdir /data/alertmanager # 数据目录
[root@prometheus-72 src]# chown -R monitor.monitor /data/alertmanager /opt/release/alertmanager-0.21.0.linux-amd64
[root@prometheus-72 src]# vim /usr/lib/systemd/system/alertmanager.service
[Unit]
Description=alertmanager service
After=network.target prometheus.service

[Service]
User=monitor
Group=monitor
KillMode=control-group
Restart=on-failure
RestartSec=60
# 参数指定的 data 目录不能加双引号
ExecStart=/opt/apps/alertmanager/alertmanager --config.file=/opt/apps/alertmanager/alertmanager.yml --storage.path=/data/alertmanager/ --log.level=info

ExecReload=/bin/kill -HUP $MAINPID

[Install]
WantedBy=multi-user.target
[root@prometheus-72 src]# systemctl daemon-reload
2.1.2. 配置邮件告警
在配置告警通知时,告警应该分级别、分类型选择接收者,比如:
- 所有告警都邮件通知到运维组,邮件会有延迟
- 严重告警短信/微信/钉钉/电话通知到运维人员,即需要第一时间收到告警
- 告警分类推送,开发环境通知开发者,数据库异常通知DBA等
alertmanager 自带有通知模板,可以通过github 中项目查看。也可以根据个人习惯,进行调整,模板语言是go template
# /opt/apps/alertmanager/alertmanager.yml
global:
  smtp_from: linux_hy_1992@163.com
  smtp_smarthost: smtp.163.com:25
  smtp_auth_username: linux_hy_1992@163.com
  smtp_auth_password: linux1992
  smtp_require_tls: false

route:
  group_by: ["alertname"]
  group_wait: 60s
  group_interval: 10m
  repeat_interval: 6h
  receiver: ops_email
  routes:
    - match_re:
        level: (info|warn|error)
      receiver: ops_email
      continue: true
    - match:
        level: error
      receiver: admin_email
templates:
  - /opt/apps/alertmanager/templates/*.tmpl

receivers:
  - name: ops_email
    email_configs:
      - to: xxx@qq.com
        send_resolved: true
        headers: { Subject: "[{{ .Status | toUpper }}{{ if eq .Status \"firing\" }}:{{ .Alerts.Firing | len }}{{ end }}] {{ .GroupLabels.SortedPairs.Values }}" }
        html: '{{ template "email.html" . }}'

  - name: admin_email
    email_configs:
      - to: xxx@163.com
        send_resolved: true
        headers: { Subject: "[{{ .Status | toUpper }}{{ if eq .Status \"firing\" }}:{{ .Alerts.Firing | len }}{{ end }}] {{ .GroupLabels.SortedPairs.Values }}" }
        html: '{{ template "email.html" . }}'
[root@prometheus-72 ~]# vim /opt/apps/alertmanager/templates/email.tmpl
{{ define "email.html" }}

<style type="text/css">
table.gridtable {
  font-family: verdana,arial,sans-serif;
  font-size:11px;
  color:#333333;
  border-width: 1px;
  border-color: #666666;
  border-collapse: collapse;
}
table.gridtable th {
  border-width: 1px;
  padding: 8px;
  border-style: solid;
  border-color: #666666;
  background-color: #dedede;
}
table.gridtable td {
  border-width: 1px;
  padding: 8px;
  border-style: solid;
  border-color: #666666;
  background-color: #ffffff;
}
</style>

<table class="gridtable">
  <tr>
    <th>报警项</th>
    <th>实例</th>
    <th>当前值</th>
    <th>告警级别</th>
    <th>开始时间</th>
    <th>告警摘要</th>
  </tr>
  {{ range $i, $alert := .Alerts }}
    <tr>
      <td>{{ index $alert.Labels "alertname" }}</td>
      <td>{{ index $alert.Labels "instance" }}</td>
      <td>{{ index $alert.Annotations "value" }}</td>
      <td>{{ index $alert.Labels "level" }}</td>
      <td>{{ $alert.StartsAt.Format "2006-01-02 15:04:05 MST" }}</td>
      <td>{{ index $alert.Annotations "summary" }}</td>
    </tr>
  {{ end }}
</table>
{{ end }}
[root@prometheus-72 ~]# /opt/apps/alertmanager/amtool check-config /opt/apps/alertmanager/alertmanager.yml  # 检查配置文件
Checking '/opt/apps/alertmanager/alertmanager.yml'  SUCCESS
Found:
 - global config
 - route
 - 0 inhibit rules
 - 2 receivers
 - 1 templates
  SUCCESS
[root@prometheus-72 ~]# systemctl start alertmanager ; systemctl enable alertmanager
3.2. 配置Prometheus
# /opt/apps/prometheus/prometheus.yml
global:
  scrape_interval:     60s
  external_labels:
    monitor: 'codelab-monitor'

scrape_configs:
  - job_name: 'prometheus'
    static_configs:
      - targets: ['localhost:9090']
  - job_name: 'node'
    static_configs:
      - targets:
          - "10.4.7.72:9100"
          - "10.4.7.79:9100"
    relabel_configs:
      - source_labels: [__address__]
        regex: (.+):[0-9]+
        target_label: host

alerting:
  alertmanagers:
    - timeout: 10s
      static_configs:
        - targets: ["10.4.7.72:9093"]

rule_files:
  - /opt/apps/prometheus/rules.d/node_exporter_recording.yaml
  - /opt/apps/prometheus/rules.d/node_exporter_alerting.yaml
# cat /opt/apps/prometheus/rules.d/node_exporter_alerting.yaml  # 下面的规则仅仅作为试验,生产环境需要详细配置
groups:
  - name: node_resource
    rules:
      - alert: node_cpu_used_percent_alert_info
        expr: 1 - avg(irate(node_cpu_seconds_total{mode="idle"}[2m])) by (host,instance,job) >= 0.8
        labels:
          level: info
          type: cpu
        annotations:
          summary: "cpu used more than 80%"
          value: "{{ $value }}"
        for: 3m
      - alert: node_cpu_used_percent_alert_warn
        expr: 1 - avg(irate(node_cpu_seconds_total{mode="idle"}[2m])) by (host,instance,job) >= 0.8
        labels:
          level: warn
          type: cpu
        annotations:
          summary: "cpu used more than 80%"
          value: "{{ $value }}"
        for: 20m
  - name: node_base_info
    rules:
      - alert: node_unreachable # 主机不可达
        expr: up{job="node"} == 0
        labels:
          level: error
          type: node
        annotations:
          summary: "host unreachable"
          value: "{{ $value }}"
        for: 10s
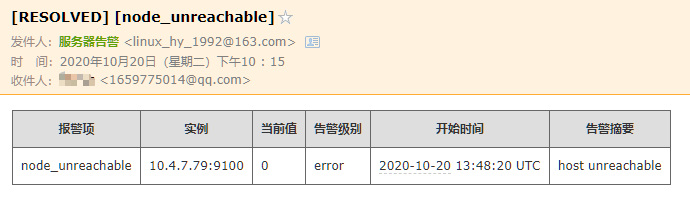
3.3. 测试
对 prometheus-72 进行CPU压测 stress -c 2 
停止 grafana-79 上的node_exporter,演示宕机情况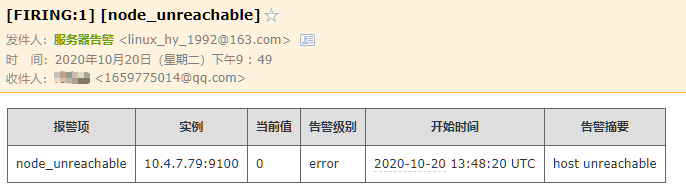


若有收获,就点个赞吧
0 人点赞
