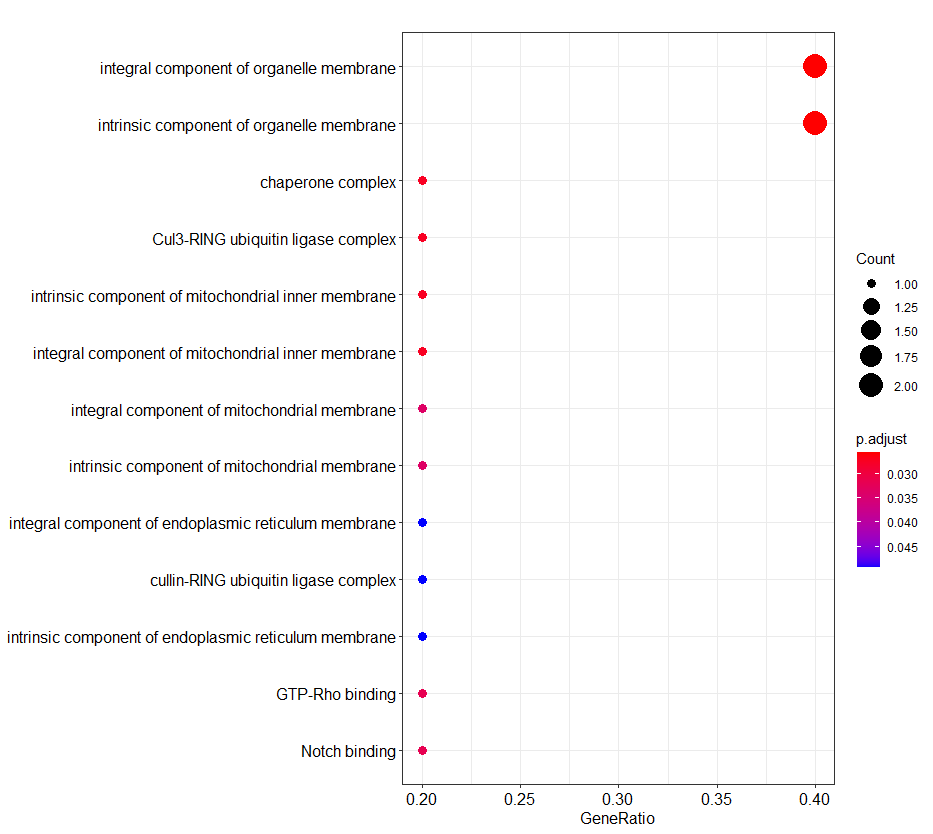
library(tidyverse)library(clusterProfiler)library(org.Hs.eg.db)setwd("")gene <- data.frame(gene = c( "COA3", "CCDC107", "HSPB8", "KIAA1671", "SCD", "KCTD10"))#Kegg#基因名转换eg <- bitr(geneID = gene$gene,fromType = "SYMBOL",toType=c("ENTREZID","ENSEMBL"), OrgDb="org.Hs.eg.db")#kegg分析kegg <- enrichKEGG(gene = eg$ENTREZID, organism = "hsa", keyType = "kegg", pvalueCutoff = 0.05, pAdjustMethod = "BH", minGSSize = 10, maxGSSize = 500, qvalueCutoff = 0.2, use_internal_data = FALSE)dotplot(kegg)go <- enrichGO(eg$ENTREZID, OrgDb = org.Hs.eg.db, ont='ALL',pAdjustMethod = 'BH',pvalueCutoff = 0.05, qvalueCutoff = 0.2,keyType = 'ENTREZID')dotplot(go,showCategory = 30)


