优劣势
ZedGraph 相较同类工具的优势:
- 功能完备,bug 少
- 用户基数大,Bing 搜问题方便
劣势:
- 从 2012 后基本停止维护
- 官网没了,对新上手的小伙伴不友好
- 该问题可以通过浏览 ZedDemo.7z 中的示例项目得到解决
PS:虽然已停止维护快 10 年了,但还能被评为 14 个最好的 .NET 免费控件,希望能有更好的绘图库来替代 ZedGraph 的使命吧。
简介
ZedGraph 是一个强大的 .NET 图形绘制库。
The charting library for .NET
相关资源:
支持平台:
- .NET Framework
基本使用
从 作者写的介绍 中摘抄得来。
第一步:从控件库中拖一个 ZedGraphControl 到 Form 上。
第二步:通过代码初始化并绘制图形。
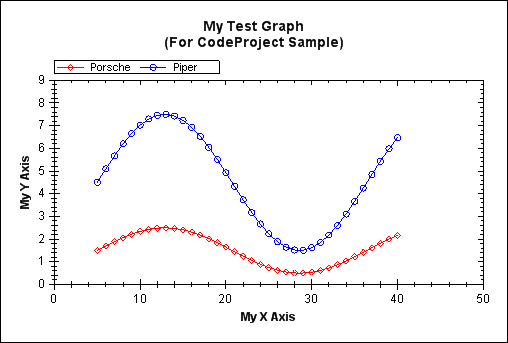
private void Form1_Load( object sender, EventArgs e ){// Setup the graphCreateGraph( zedGraphControl1 );}// Build the Chartprivate void CreateGraph( ZedGraphControl zgc ){// get a reference to the GraphPaneGraphPane myPane = zgc.GraphPane;// Set the TitlesmyPane.Title.Text = "My Test Graph\n(For CodeProject Sample)";myPane.XAxis.Title.Text = "My X Axis";myPane.YAxis.Title.Text = "My Y Axis";// Make up some data arrays based on the Sine functiondouble x, y1, y2;PointPairList list1 = new PointPairList();PointPairList list2 = new PointPairList();for ( int i = 0; i < 36; i++ ){x = (double)i + 5;y1 = 1.5 + Math.Sin( (double)i * 0.2 );y2 = 3.0 * ( 1.5 + Math.Sin( (double)i * 0.2 ) );list1.Add( x, y1 );list2.Add( x, y2 );}// Generate a red curve with diamond// symbols, and "Porsche" in the legendLineItem myCurve = myPane.AddCurve( "Porsche",list1, Color.Red, SymbolType.Diamond );// Generate a blue curve with circle// symbols, and "Piper" in the legendLineItem myCurve2 = myPane.AddCurve( "Piper",list2, Color.Blue, SymbolType.Circle );// Tell ZedGraph to refigure the// axes since the data have changedzgc.AxisChange();}
使用技巧
给柱状图加数值标识
方法一,使用自带的 CreateBarLabels:
BarItem.CreateBarLabels(myPane, false, "f0", "Arial", 28, Color.CadetBlue, false, false, false);
注:如果要清理这些 label,需要使用 zgc.GraphPane.GraphObjList.Clear();。
方法二,手动绘制:
var myPane = zgc.GraphPane;var fontSpec = myPane.Legend.FontSpec.Clone();fontSpec.Family = "Microsoft YaHei";fontSpec.Size = 22;fontSpec.Border.IsVisible = false;fontSpec.Fill.IsVisible = false;var text = new TextObj("2.33", 0.55, 2.33){Location = { CoordinateFrame = CoordType.AxisXYScale, AlignH = AlignH.Left, AlignV = AlignV.Center },FontSpec = fontSpec};myPane.GraphObjList.Add(text);
修改右键菜单
移除或禁用现有菜单项:
private void MyContextMenuBuilder(ZedGraphControl control, ContextMenuStrip menuStrip,Point mousePt,ZedGraphControl.ContextMenuObjectState objState){foreach( ToolStripMenuItem item in menuStrip.Items ){if ( (string) item.Tag == "set_default" ){// remove the menu itemmenuStrip.Items.Remove( item );// or, just disable the item with this//item.Enabled = false;break;}}}
| StringID | Menu Item |
|---|---|
| copy | Copy |
| page_setup | Page Setup… |
| Print… | |
| save_as | Save Image As… |
| set_default | Set Scale to Default |
| show_val | Show Point Values |
| undo_all | Undo All Zoom/Pan |
| unzoom | Un-Zoom, Un-Pan, Undo Scroll |
添加新的右键菜单项:
private void MyContextMenuBuilder(ZedGraphControl control, ContextMenuStrip menuStrip,Point mousePt,ZedGraphControl.ContextMenuObjectState objState ){// create a new menu itemToolStripMenuItem item = new ToolStripMenuItem();// This is the user-defined Tag so you can find this menu item later if necessaryitem.Name = "my_special_tag";item.Tag = "my_special_tag";// This is the text that will show up in the menuitem.Text = "Do Something Special";// Add a handler that will respond when that menu item is selecteditem.Click += new System.EventHandler( DoSomethingSpecial );// Add the menu item to the menumenuStrip.Items.Add( item );}protected void DoSomethingSpecial( object sender, System.EventArgs e ){// do something here. For example, remove all curves from the graphzedGraphControl1.GraphPane.CurveList.Clear();zedGraphControl1.Refresh();}
示例 - 右键菜单中增加导出为 CSV 功能
参考:ZedGraph C# Graph Data Export to CSV Using a Custom Context Menu
private void InitializeZedGraph(ZedGraphControl zgc){...zgc.ContextMenuBuilder += Zgc_ContextMenuBuilder;}private void Zgc_ContextMenuBuilder(ZedGraphControl sender, ContextMenuStrip menuStrip, Point mousePt, ZedGraphControl.ContextMenuObjectState objState){var item = new ToolStripMenuItem{Name = "Export Data as CSV",Tag = "export_data_csv",Text = "导出波形数据为 CSV"};item.Click += ShowSaveAsForExportCSV;menuStrip.Items.Insert(2, item);}private StreamWriter _csvWriter;private void ShowSaveAsForExportCSV(object sender, EventArgs e){try{var dialogExportCSV = new SaveFileDialog{Filter = @"CSV Files|*.csv",Title = @"Export Profile",FileName = ZgcMain.GraphPane.Title.Text};if (dialogExportCSV.ShowDialog() != DialogResult.OK) return;_csvWriter = new StreamWriter(dialogExportCSV.FileName);WriteCSVToStream();_csvWriter.Close();MessageBox.Show("CSV 波形文件已保存", "波形导出", MessageBoxButtons.OK);}catch (Exception ex){_csvWriter.Close();MessageBox.Show(ex.ToString());}}private void WriteCSVToStream(){var xAxisHeader = ZgcMain.GraphPane.XAxis.Title.Text;var yAxisHeader = ZgcMain.GraphPane.YAxis.Title.Text;_csvWriter.Write(xAxisHeader + "," + yAxisHeader + "\n");for (var i = 0; i < _currentPointList.Count; i++){_csvWriter.Write(_currentPointList[i].X + "," + _currentPointList[i].Y + "\n");}}
获取当前点击的 Pane
当一个 Zed 上面有多个 Pane 时,可以用FinNearestPaneObject方法获取点击的 Pane。
当然该方法也可以用作获取其它 Object。
using (var g = zed.CreateGraphics()){int iPt;GraphPane pane; object nearestObj;zed.MasterPane.FindNearestPaneObject(e.Location, g, out pane,out nearestObj,out iPt);pane.Border=new Border(Color.FromArgb(0,122,204),2);}
在一行并排显式两个 Pane
首先你要有两个 Pane,再通过SetLayout设置显式模式为SingleRow即可。
切换显式模式还可以得到 211、112、Square 等效果。
var zed = ZedGraphMain;var master = zed.MasterPane;var leftPane = master.PaneList[0];var rightPane = leftPane.Clone();rightPane.CurveList.Clear();master.Add(rightPane);// Tell ZedGraph to auto layout all the panesusing (var g = zed.CreateGraphics()){master.SetLayout(g, PaneLayout.SingleRow);master.AxisChange(g);}zed.AxisChange();zed.Refresh();

若有收获,就点个赞吧
0 人点赞
