tags: [笔记, Matplotlib, set_xlim()]
categories: [笔记, Matplotlib, set_xlim()]
开始之前
- xlim() 和 ylim() 在 Matplotlib 中设置轴的限制
- set_xlim() 和 set_ylim() 方法来设置轴限制
- 使用 axis() 方法在 Matplotlib 中设置轴的限制
为了设置 X 轴的范围限制,我们可以使用 xlim() 和 set_xlim() 方法。类似地,为 Y 轴设置范围限制,我们可以使用 ylim() 和 set_ylim() 方法。我们也可以使用 axis() 方法来控制两个轴的范围。
未限制坐标范围的原始图形
import numpy as npimport matplotlib.pyplot as pltx=np.linspace(1,10,500)y=np.sin(2 * np.pi * x)+1fig = plt.figure(figsize=(8, 6))plt.plot(x,y)plt.title("Plot without limiting axes",fontsize=25)plt.xlabel("x",fontsize=18)plt.ylabel("1+sinx",fontsize=18)plt.show()
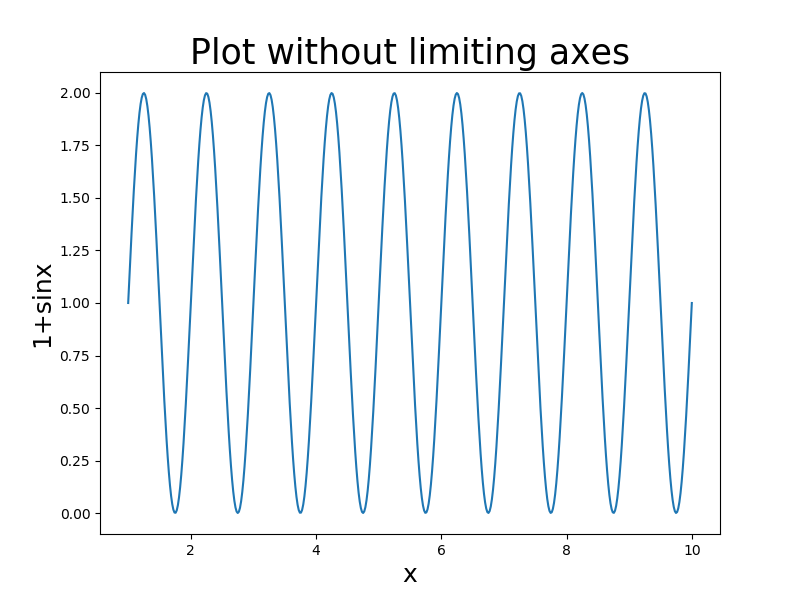
如果不使用 xlim()和 ylim()函数来限制轴的范围,则该图的整个轴范围为 :X 轴范围从 0 到 10,而 Y 轴范围从 0 到 2。
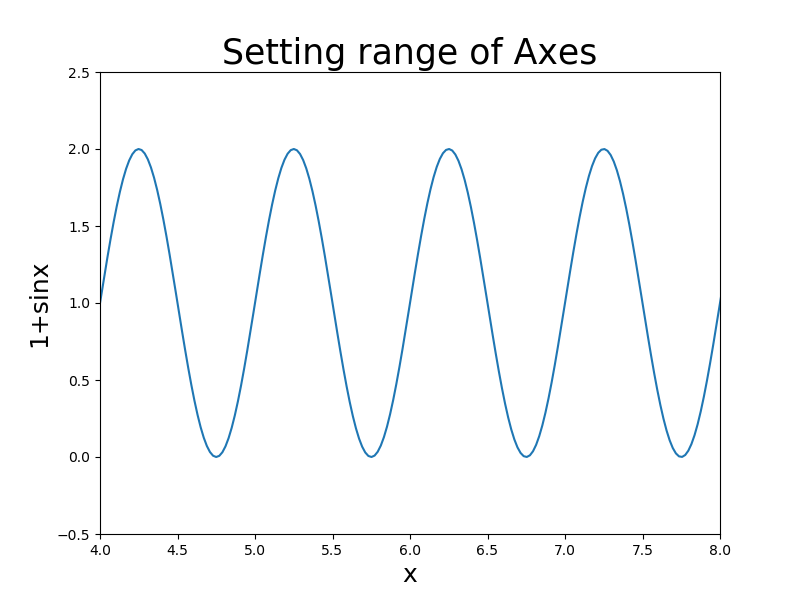
xlim() 和 ylim() 在 Matplotlib 中设置轴的限制
matplotlib.pyplot.xlim() 和 matplotlib.pyplot.ylim() 可用于分别设置或获取 X 轴和 Y 轴的范围限制。如果在这些方法中传递参数,则它们将设置各个轴的极限,如果不传递任何参数,则将获得各个轴的范围。
import numpy as npimport matplotlib.pyplot as pltx=np.linspace(0,10,500)y=np.sin(2 * np.pi * x)+1fig = plt.figure(figsize=(8, 6))plt.plot(x,y)plt.title("Setting range of Axes",fontsize=25)plt.xlabel("x",fontsize=18)plt.ylabel("1+sinx",fontsize=18)plt.xlim(4,8)plt.ylim(-0.5,2.5)plt.show()

这会将 X 轴的范围限制为4-8,而将 Y 轴的范围限制为-0.5-2.5。
set_xlim() 和 set_ylim() 方法来设置轴限制
import numpy as npimport matplotlib.pyplot as pltx=np.linspace(0,10,500)y=np.sin(2 * np.pi * x)+1fig = plt.figure(figsize=(8, 6))axes = plt.axes()axes.set_xlim([4, 8])axes.set_ylim([-0.5, 2.5])plt.plot(x,y)plt.title("Setting range of Axes",fontsize=25)plt.xlabel("x",fontsize=18)plt.ylabel("1+sinx",fontsize=18)plt.show()
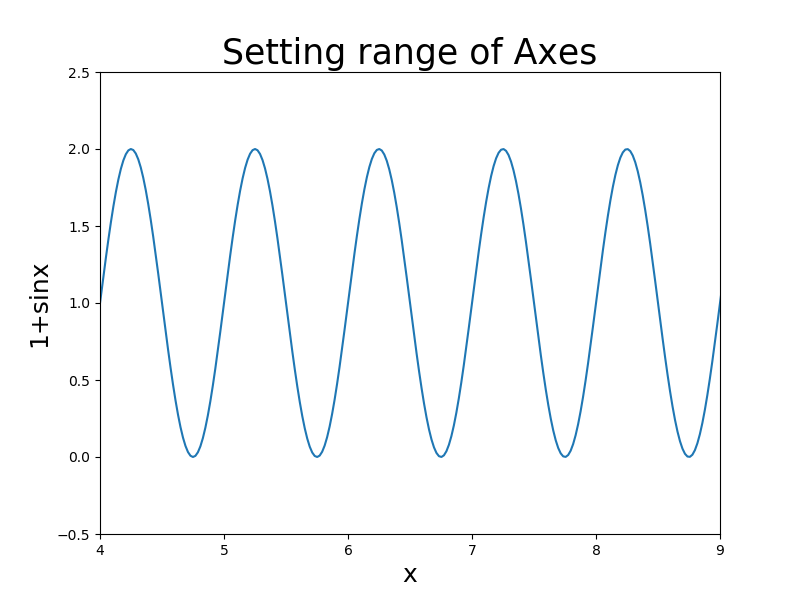
使用 axis() 方法在 Matplotlib 中设置轴的限制
我们还可以使用 matplotlib.pyplot.axis() 来设置轴的范围限制。语法如下:
plt.axis([xmin, xmax, ymin, ymax])
该方法避免了需要单独控制 X 轴和 Y 轴范围的麻烦。
import numpy as npimport matplotlib.pyplot as pltx=np.linspace(0,10,50)y=np.sin(2 * np.pi * x)+1fig = plt.figure(figsize=(8, 6))plt.axis([4, 9, -0.5, 2.5])plt.plot(x,y)plt.title("Setting range of Axes",fontsize=25)plt.xlabel("x",fontsize=18)plt.ylabel("1+sinx",fontsize=18)plt.show()

若有收获,就点个赞吧
0 人点赞
