可以通过配置 -XX:+PrintGCDetails 输出 GC 的详细信息。
一、展示各个收集器的GC日志
以下演示日志均通过如下代码触发
-Xms20m -Xmx30m -XX:+PrintGCDetails
public class HelloGC {public static void main(String[] args) throws InterruptedException {final long totalMemory = Runtime.getRuntime().totalMemory();final long maxMemory = Runtime.getRuntime().maxMemory();System.out.println("TOTAL_MEMORY(-Xms) = "+totalMemory + "(字节)、"+(totalMemory/(double)1024/1024)+"MB");System.out.println("MAX_MEMORY(-Xmx) = "+maxMemory + "(字节)、"+(maxMemory/(double)1024/1024)+"MB");System.out.println("-f**************hello gc");// 人为制造GCbyte[] bytes = new byte[50 * 1024 * 1024];}}
1、串行垃圾回收器(Serial)
-XX:+UseSerialGC
[GC (Allocation Failure) [DefNew: 1508K->419K(6144K), 0.0012163 secs][Tenured: 0K->418K(13696K), 0.0015642 secs] 1508K->418K(19840K), [Metaspace: 3064K->3064K(1056768K)], 0.0028172 secs] [Times: user=0.01 sys=0.00, real=0.00 secs][Full GC (Allocation Failure) [Tenured: 418K->400K(20480K), 0.0011883 secs] 418K->400K(26752K), [Metaspace: 3064K->3064K(1056768K)], 0.0012150 secs] [Times: user=0.00 sys=0.00, real=0.00 secs]Heapdef new generation total 9216K, used 410K [0x00000007be200000, 0x00000007bec00000, 0x00000007bec00000)eden space 8192K, 5% used [0x00000007be200000, 0x00000007be266800, 0x00000007bea00000)from space 1024K, 0% used [0x00000007bea00000, 0x00000007bea00000, 0x00000007beb00000)to space 1024K, 0% used [0x00000007beb00000, 0x00000007beb00000, 0x00000007bec00000)tenured generation total 20480K, used 400K [0x00000007bec00000, 0x00000007c0000000, 0x00000007c0000000)the space 20480K, 1% used [0x00000007bec00000, 0x00000007bec641c8, 0x00000007bec64200, 0x00000007c0000000)Metaspace used 3116K, capacity 4496K, committed 4864K, reserved 1056768Kclass space used 338K, capacity 388K, committed 512K, reserved 1048576KException in thread "main" java.lang.OutOfMemoryError: Java heap spaceat com.supkingx.base.l_jvm.gc.HelloGC.main(HelloGC.java:16)
2、并行垃圾回收(Parallel)
-XX:+UseParNewGC
[GC (Allocation Failure) [ParNew: 1508K->464K(6144K), 0.0006167 secs][Tenured: 0K->418K(13696K), 0.0018815 secs] 1508K->418K(19840K), [Metaspace: 3064K->3064K(1056768K)], 0.0025383 secs] [Times: user=0.01 sys=0.00, real=0.00 secs][Full GC (Allocation Failure) [Tenured: 418K->400K(20480K), 0.0013416 secs] 418K->400K(26752K), [Metaspace: 3064K->3064K(1056768K)], 0.0013702 secs] [Times: user=0.00 sys=0.00, real=0.00 secs]Heappar new generation total 9216K, used 573K [0x00000007be200000, 0x00000007bec00000, 0x00000007bec00000)eden space 8192K, 7% used [0x00000007be200000, 0x00000007be28f770, 0x00000007bea00000)from space 1024K, 0% used [0x00000007bea00000, 0x00000007bea00000, 0x00000007beb00000)to space 1024K, 0% used [0x00000007beb00000, 0x00000007beb00000, 0x00000007bec00000)tenured generation total 20480K, used 400K [0x00000007bec00000, 0x00000007c0000000, 0x00000007c0000000)the space 20480K, 1% used [0x00000007bec00000, 0x00000007bec641c8, 0x00000007bec64200, 0x00000007c0000000)Metaspace used 3129K, capacity 4496K, committed 4864K, reserved 1056768Kclass space used 340K, capacity 388K, committed 512K, reserved 1048576KException in thread "main" java.lang.OutOfMemoryError: Java heap spaceat com.supkingx.base.l_jvm.gc.HelloGC.main(HelloGC.java:16)
这两个配置一个,另外一个会自动配置
-XX:+UseParallelGC 或-XX:+UseParallelOldGC
[GC (Allocation Failure) [PSYoungGen: 1541K->496K(6144K)] 1541K->552K(26624K), 0.0009332 secs] [Times: user=0.01 sys=0.00, real=0.00 secs][GC (Allocation Failure) [PSYoungGen: 496K->480K(6144K)] 552K->576K(26624K), 0.0005868 secs] [Times: user=0.00 sys=0.00, real=0.00 secs][Full GC (Allocation Failure) [PSYoungGen: 480K->0K(6144K)] [ParOldGen: 96K->418K(13824K)] 576K->418K(19968K), [Metaspace: 3064K->3064K(1056768K)], 0.0044927 secs] [Times: user=0.03 sys=0.00, real=0.00 secs][GC (Allocation Failure) [PSYoungGen: 0K->0K(6144K)] 418K->418K(26624K), 0.0003431 secs] [Times: user=0.00 sys=0.00, real=0.00 secs][Full GC (Allocation Failure) [PSYoungGen: 0K->0K(6144K)] [ParOldGen: 418K->400K(13824K)] 418K->400K(19968K), [Metaspace: 3064K->3064K(1056768K)], 0.0036087 secs] [Times: user=0.02 sys=0.01, real=0.01 secs]HeapPSYoungGen total 6144K, used 281K [0x00000007bf600000, 0x00000007c0000000, 0x00000007c0000000)eden space 5632K, 5% used [0x00000007bf600000,0x00000007bf6467f8,0x00000007bfb80000)from space 512K, 0% used [0x00000007bfb80000,0x00000007bfb80000,0x00000007bfc00000)to space 512K, 0% used [0x00000007bff80000,0x00000007bff80000,0x00000007c0000000)ParOldGen total 20480K, used 400K [0x00000007be200000, 0x00000007bf600000, 0x00000007bf600000)object space 20480K, 1% used [0x00000007be200000,0x00000007be2641c8,0x00000007bf600000)Metaspace used 3127K, capacity 4496K, committed 4864K, reserved 1056768Kclass space used 340K, capacity 388K, committed 512K, reserved 1048576KException in thread "main" java.lang.OutOfMemoryError: Java heap spaceat com.supkingx.base.l_jvm.gc.HelloGC.main(HelloGC.java:16)
3、并发垃圾回收器 CMS(ConcMarkSweepGC)
-XX:+UseConcMarkSweepGC
[GC (Allocation Failure) [ParNew: 1738K->473K(9216K), 0.0006431 secs][CMS: 0K->423K(10240K), 0.0018575 secs] 1738K->423K(19456K), [Metaspace: 3064K->3064K(1056768K)], 0.0025473 secs] [Times: user=0.01 sys=0.00, real=0.01 secs][Full GC (Allocation Failure) [CMS: 423K->405K(20480K), 0.0017922 secs] 423K->405K(29696K), [Metaspace: 3064K->3064K(1056768K)], 0.0018173 secs] [Times: user=0.00 sys=0.00, real=0.00 secs]Heappar new generation total 9216K, used 410K [0x00000007be200000, 0x00000007bec00000, 0x00000007bec00000)eden space 8192K, 5% used [0x00000007be200000, 0x00000007be266800, 0x00000007bea00000)from space 1024K, 0% used [0x00000007beb00000, 0x00000007beb00000, 0x00000007bec00000)to space 1024K, 0% used [0x00000007bea00000, 0x00000007bea00000, 0x00000007beb00000)concurrent mark-sweep generation total 20480K, used 405K [0x00000007bec00000, 0x00000007c0000000, 0x00000007c0000000)Metaspace used 3123K, capacity 4496K, committed 4864K, reserved 1056768Kclass space used 338K, capacity 388K, committed 512K, reserved 1048576K
4、G1
-XX:+UseG1GC
[GC pause (G1 Humongous Allocation) (young) (initial-mark), 0.0013367 secs][Parallel Time: 0.8 ms, GC Workers: 10][GC Worker Start (ms): Min: 110.0, Avg: 110.0, Max: 110.1, Diff: 0.1][Ext Root Scanning (ms): Min: 0.3, Avg: 0.4, Max: 0.6, Diff: 0.2, Sum: 4.2][Update RS (ms): Min: 0.0, Avg: 0.0, Max: 0.0, Diff: 0.0, Sum: 0.0][Processed Buffers: Min: 0, Avg: 0.0, Max: 0, Diff: 0, Sum: 0][Scan RS (ms): Min: 0.0, Avg: 0.0, Max: 0.0, Diff: 0.0, Sum: 0.0][Code Root Scanning (ms): Min: 0.0, Avg: 0.0, Max: 0.0, Diff: 0.0, Sum: 0.0][Object Copy (ms): Min: 0.1, Avg: 0.2, Max: 0.3, Diff: 0.2, Sum: 2.1][Termination (ms): Min: 0.0, Avg: 0.0, Max: 0.0, Diff: 0.0, Sum: 0.0][Termination Attempts: Min: 1, Avg: 2.5, Max: 4, Diff: 3, Sum: 25][GC Worker Other (ms): Min: 0.0, Avg: 0.0, Max: 0.0, Diff: 0.0, Sum: 0.2][GC Worker Total (ms): Min: 0.6, Avg: 0.7, Max: 0.7, Diff: 0.1, Sum: 6.5][GC Worker End (ms): Min: 110.7, Avg: 110.7, Max: 110.7, Diff: 0.0][Code Root Fixup: 0.0 ms][Code Root Purge: 0.0 ms][Clear CT: 0.1 ms][Other: 0.5 ms][Choose CSet: 0.0 ms][Ref Proc: 0.2 ms][Ref Enq: 0.0 ms][Redirty Cards: 0.1 ms][Humongous Register: 0.0 ms][Humongous Reclaim: 0.0 ms][Free CSet: 0.0 ms][Eden: 2048.0K(12.0M)->0.0B(10.0M) Survivors: 0.0B->1024.0K Heap: 1569.5K(20.0M)->552.0K(20.0M)][Times: user=0.00 sys=0.00, real=0.01 secs][GC concurrent-root-region-scan-start][GC pause (G1 Humongous Allocation) (young)[GC concurrent-root-region-scan-end, 0.0003590 secs][GC concurrent-mark-start], 0.0012644 secs][Root Region Scan Waiting: 0.3 ms][Parallel Time: 0.5 ms, GC Workers: 10][GC Worker Start (ms): Min: 111.7, Avg: 111.8, Max: 111.8, Diff: 0.1][Ext Root Scanning (ms): Min: 0.1, Avg: 0.1, Max: 0.1, Diff: 0.1, Sum: 1.0][Update RS (ms): Min: 0.0, Avg: 0.0, Max: 0.0, Diff: 0.0, Sum: 0.0][Processed Buffers: Min: 0, Avg: 0.0, Max: 0, Diff: 0, Sum: 0][Scan RS (ms): Min: 0.0, Avg: 0.0, Max: 0.0, Diff: 0.0, Sum: 0.0][Code Root Scanning (ms): Min: 0.0, Avg: 0.0, Max: 0.0, Diff: 0.0, Sum: 0.0][Object Copy (ms): Min: 0.2, Avg: 0.2, Max: 0.2, Diff: 0.0, Sum: 2.3][Termination (ms): Min: 0.0, Avg: 0.0, Max: 0.0, Diff: 0.0, Sum: 0.0][Termination Attempts: Min: 1, Avg: 7.3, Max: 11, Diff: 10, Sum: 73][GC Worker Other (ms): Min: 0.0, Avg: 0.0, Max: 0.0, Diff: 0.0, Sum: 0.1][GC Worker Total (ms): Min: 0.3, Avg: 0.3, Max: 0.4, Diff: 0.1, Sum: 3.4][GC Worker End (ms): Min: 112.1, Avg: 112.1, Max: 112.1, Diff: 0.0][Code Root Fixup: 0.0 ms][Code Root Purge: 0.0 ms][Clear CT: 0.1 ms][Other: 0.4 ms][Choose CSet: 0.0 ms][Ref Proc: 0.3 ms][Ref Enq: 0.0 ms][Redirty Cards: 0.1 ms][Humongous Register: 0.0 ms][Humongous Reclaim: 0.0 ms][Free CSet: 0.0 ms][Eden: 0.0B(10.0M)->0.0B(10.0M) Survivors: 1024.0K->1024.0K Heap: 552.0K(20.0M)->534.0K(20.0M)][Times: user=0.01 sys=0.00, real=0.00 secs][Full GC (Allocation Failure) 534K->418K(20M), 0.0023080 secs][Eden: 0.0B(10.0M)->0.0B(10.0M) Survivors: 1024.0K->0.0B Heap: 534.0K(30.0M)->418.9K(20.0M)], [Metaspace: 3064K->3064K(1056768K)][Times: user=0.00 sys=0.00, real=0.00 secs][Full GC (Allocation Failure) 418K->400K(20M), 0.0018293 secs][Eden: 0.0B(10.0M)->0.0B(10.0M) Survivors: 0.0B->0.0B Heap: 418.9K(20.0M)->401.0K(20.0M)], [Metaspace: 3064K->3064K(1056768K)][Times: user=0.00 sys=0.00, real=0.00 secs][GC concurrent-mark-abort]Exception in thread "main" java.lang.OutOfMemoryError: Java heap spaceat com.supkingx.base.l_jvm.gc.HelloGC.main(HelloGC.java:16)Heapgarbage-first heap total 20480K, used 400K [0x00000007be200000, 0x00000007be3000a0, 0x00000007c0000000)region size 1024K, 1 young (1024K), 0 survivors (0K)Metaspace used 3175K, capacity 4496K, committed 4864K, reserved 1056768Kclass space used 347K, capacity 388K, committed 512K, reserved 1048576K
二、基于日志的解析
GC在新生区,FullGC 在养老区
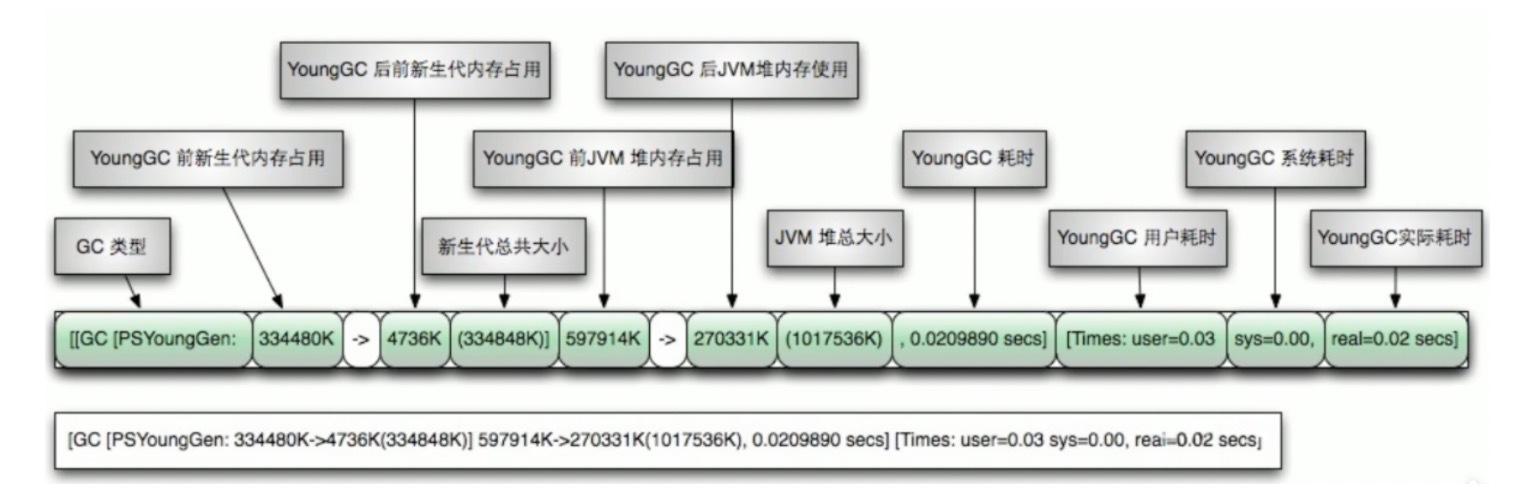
GC日志解释
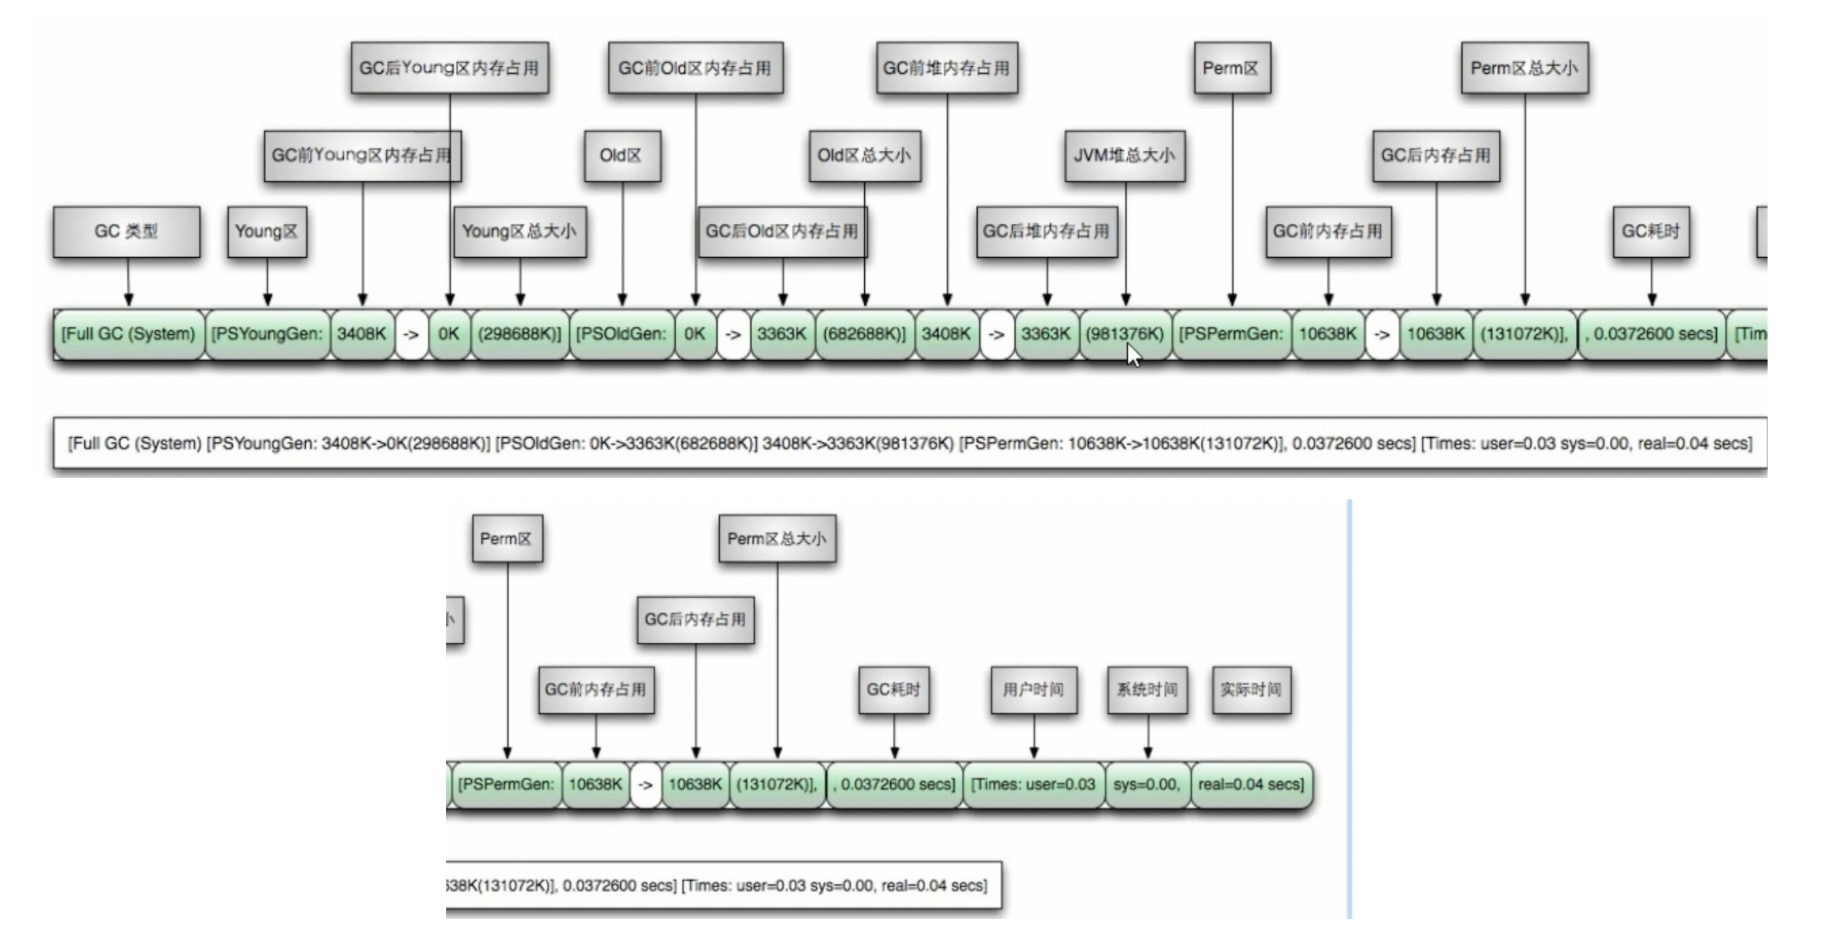
FULL GC日志解释
选取一条Full GC思考
[Full GC (Allocation Failure) [PSYoungGen: 0K->0K(6144K)] [ParOldGen: 405K->388K(13824K)] 405K->388K(19968K), [Metaspace: 2995K->2995K(1056768K)], 0.0036971 secs] [Times: user=0.02 sys=0.00, real=0.00 secs]
可以看到[ParOldGen: 405K->388K(13824K)] 405K->388K(19968K), [Metaspace: 2995K->2995K(1056768K)]。老年代回收内存前后差距不大,Metaspace内存回收前后不变,说明GC扛不住了,老年代也不行了,所以报错了,java.lang.OutOfMemoryError: Java heap space

若有收获,就点个赞吧
0 人点赞
