使用Prometheus对持续集成Jenkins进行监控,并通过Grafana展示监控数据。
在Jenkins 中, 安装Promethues插件。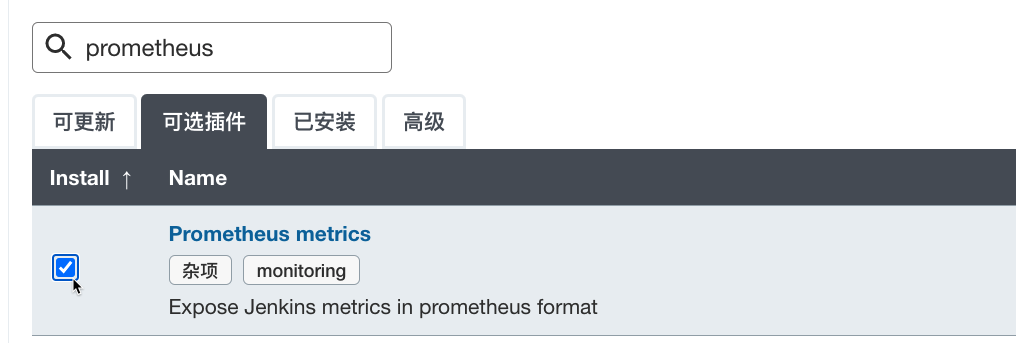
进入Jenkins系统设置, 搜索关键字”Prometheus”, 此处可以自定义填写Path地址,即暴露指标的url二级路径。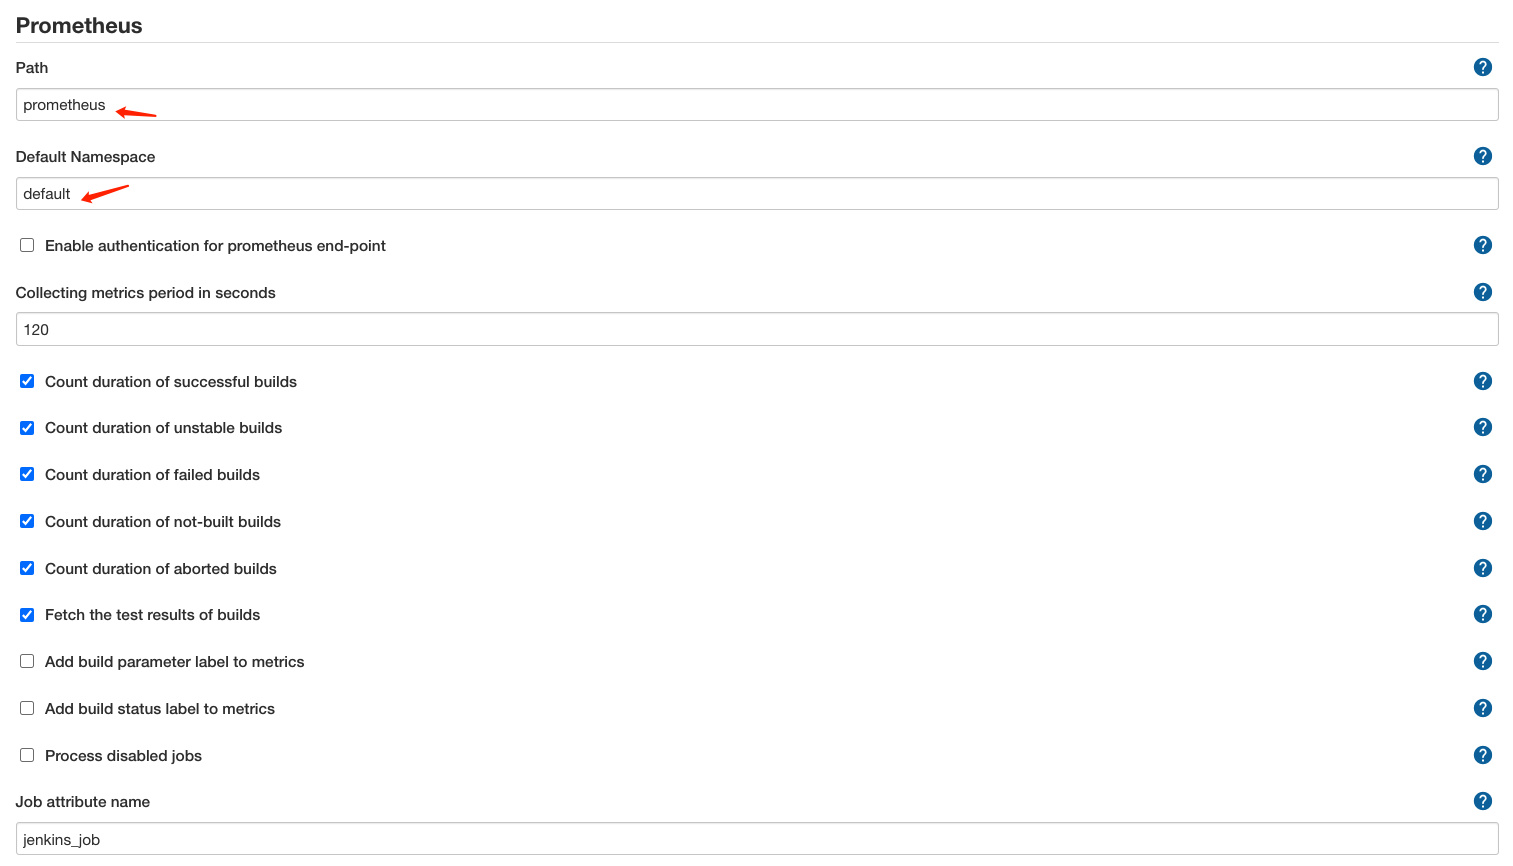
访问 http://yourjenkinserver:port/prometheus, 可以看到度量指标就可以了。
prometheus配置
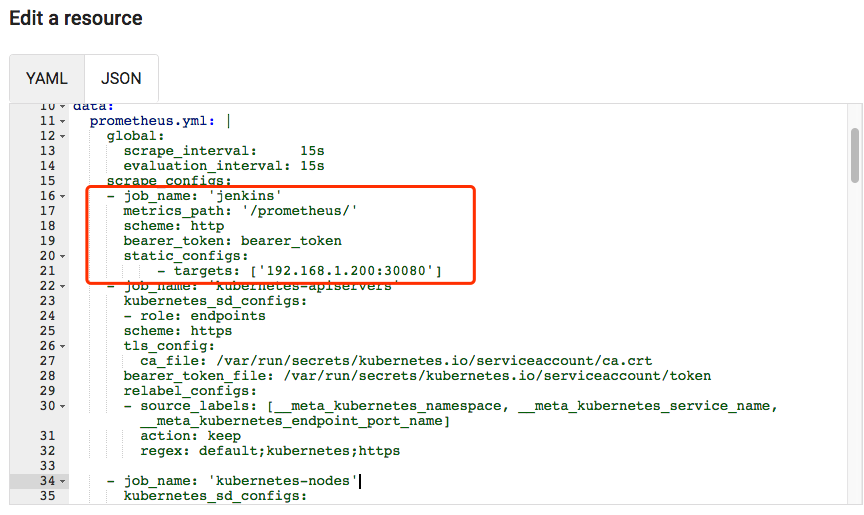
需要修改prometheus的配置,configmap。
- job_name: 'jenkins'metrics_path: '/prometheus/'scheme: httpbearer_token: bearer_tokenstatic_configs:- targets: ['192.168.1.200:8080']
然后,尝试查看prometheus中是否有相关的指标: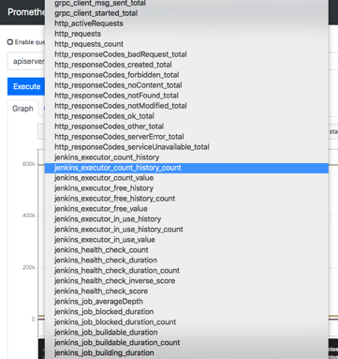
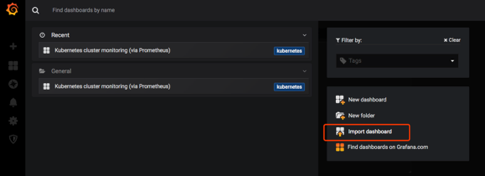
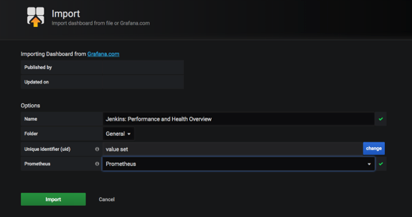
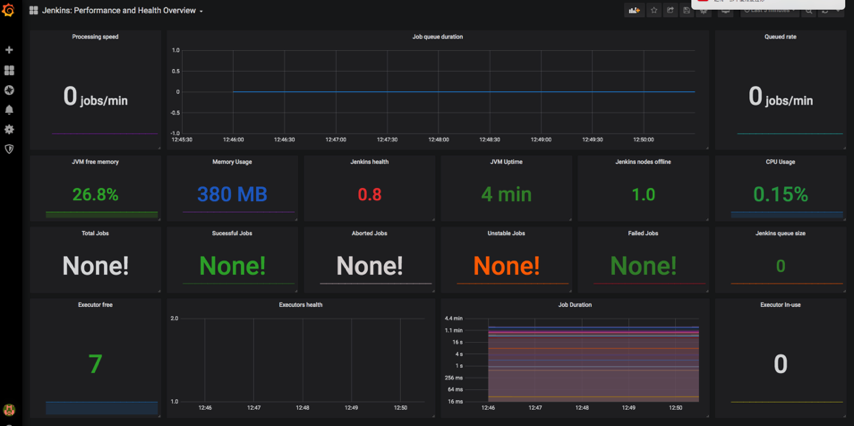
Grafana配置
dashboard: https://grafana.com/grafana/dashboards/9964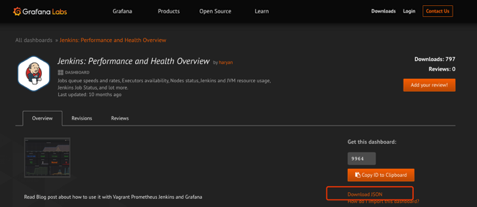

若有收获,就点个赞吧
0 人点赞
