一、简介
- 所有的graph图形都可以设置连接上多个报警平台并设置阈值并报警
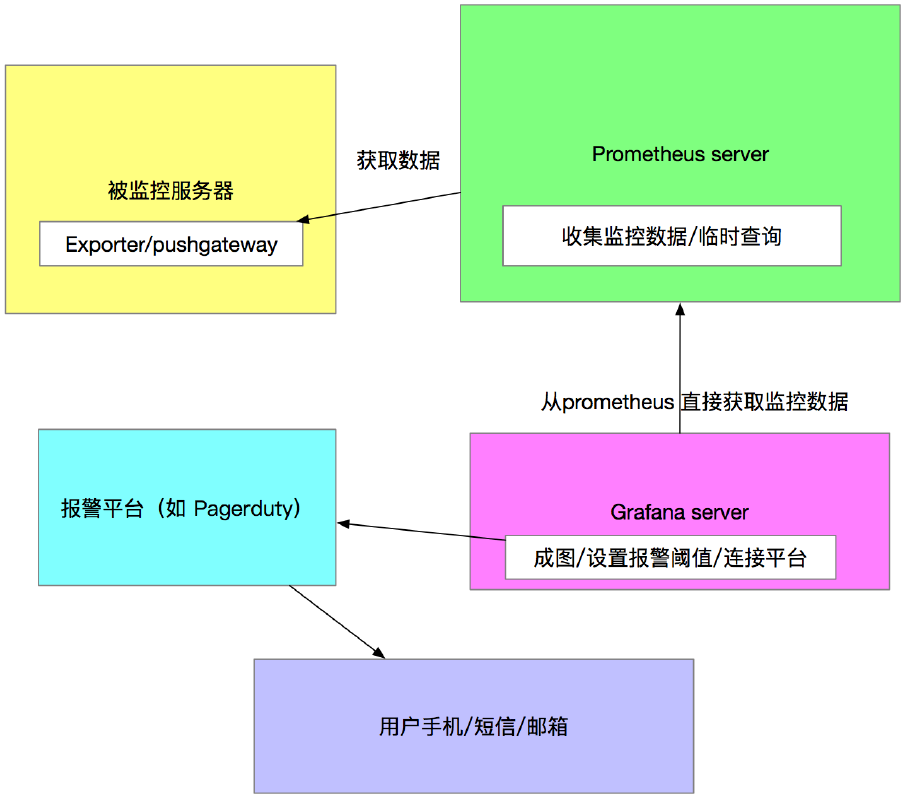
- prometheus_server(alertmanager插件)-Pagerduty仅仅作为数据源即可(没有必要再使⽤prometheus做报警设置了)
- 整个的流程如下
二、grafana告警平台设置
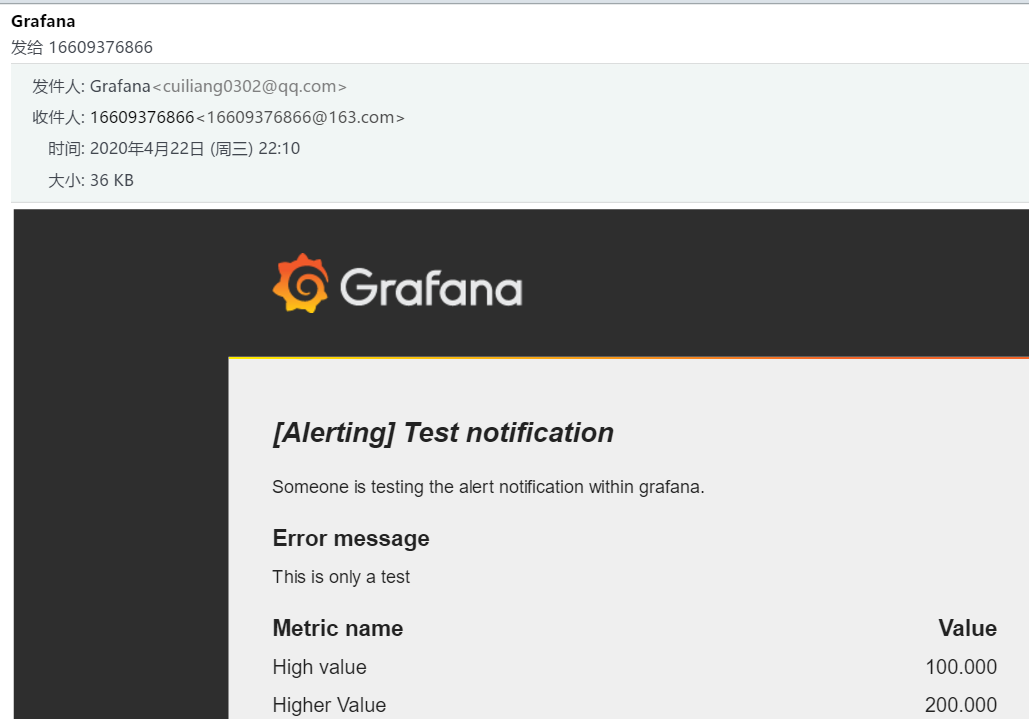
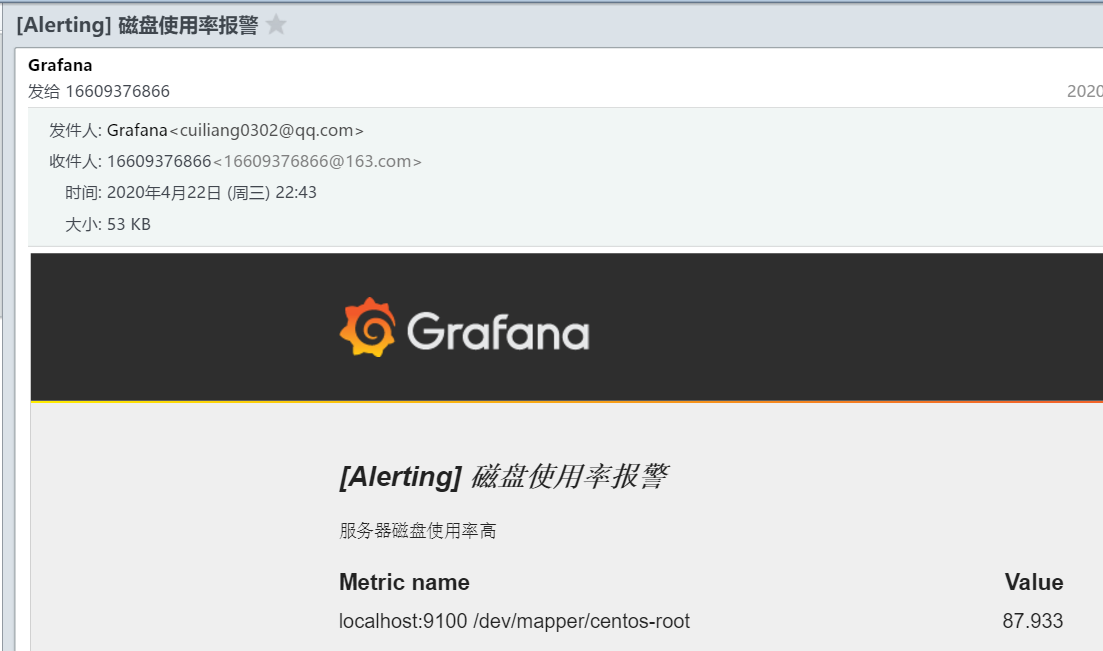
使用qq邮箱发送报警信息
- 修改grafana配置文件
# vim /etc/grafana/grafana.ini 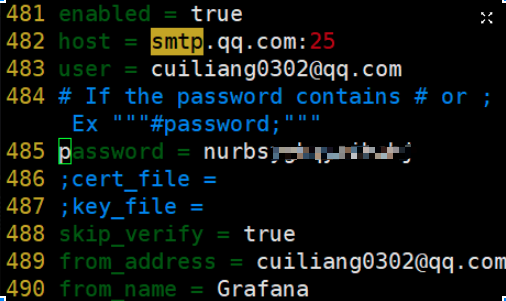
- 重启grafana服务
# systemctl restart grafana-server
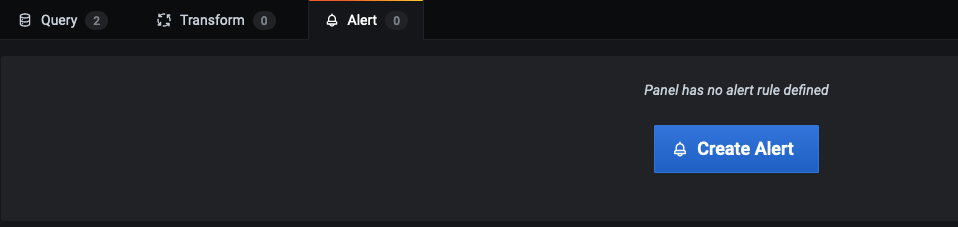
- 设置告警规则

- name:告警名称
- evaluate every:告警检测时间间隔(可填写
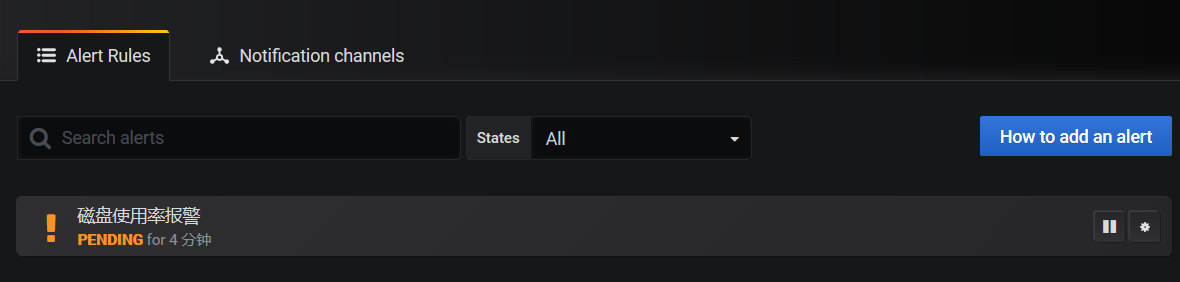
30s,3m,5mor1h) - for:在触发告警前,需要查询多长时间的间隔(当告警满足触发条件,不会立即告警,而是先转为peding,一旦超过for设置的时长,再转为alerting状态)
开始设置对于这⼀个graph监控的阈值
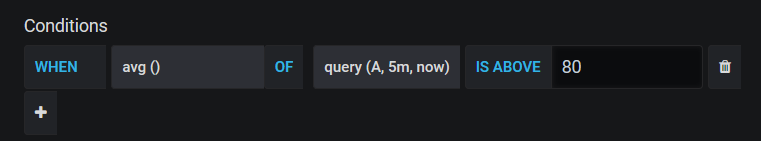
- when:聚合操作类型(可以是 avg、max、min、last等)
- of:查询公式Query(A,5m,now)。其中的A是Graph曲线编号,5m表示取开始时间区间,now表示结束时间区间。也可以是(1h,now-50m)
- IS ABOVE:报警的触发阈值了,当⼤于80的时候 就会发出报警到 Pagerduty
- 无数据和错误处理
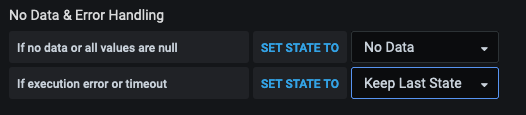
- If no data or all values are null:如果没有数据或所有值都为空
- If execution error or timeout:如果执行错误或超时 | 选项 | 介绍 | | —- | —- | | No Data | 将警报规则状态设置为无数据 | | Alerting | 将警报规则状态设置为警报 | | Keep Last State | 保持当前的警报规则状态。 | | Ok | 将警报规则状态设置为正常 |
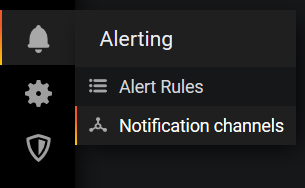
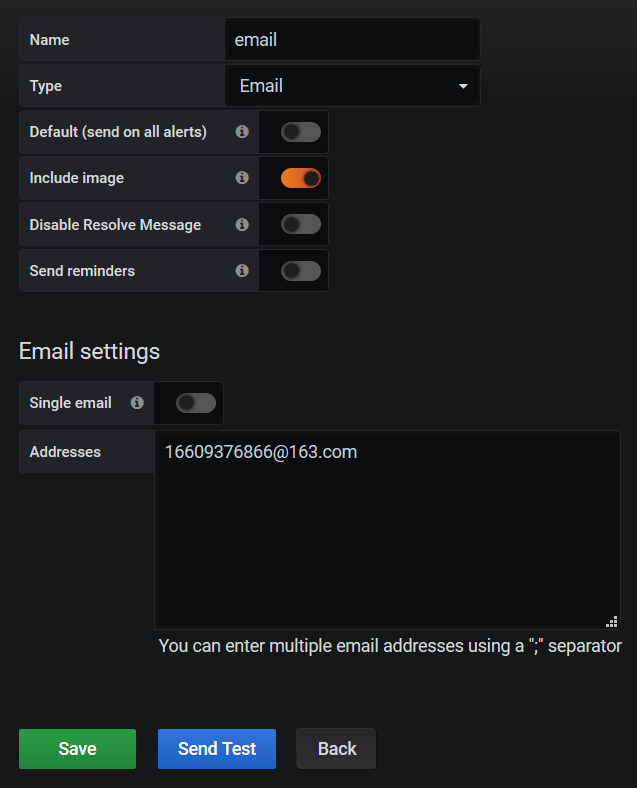
设置报警工具与内容
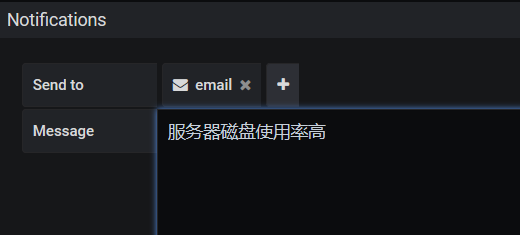
tag设置
- 目前支持自定义tag类型为:Prometheus Alertmanager、Webhook
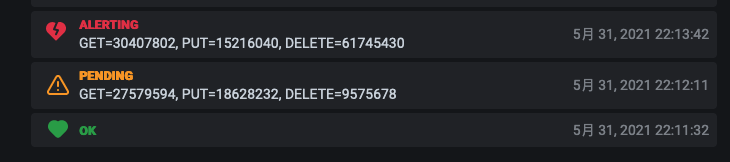
- 查看报警信息
四、webhook
{"dashboardId":1,"evalMatches":[{"value":1,"metric":"Count","tags":{}}],"imageUrl":"https://grafana.com/assets/img/blog/mixed_styles.png","message":"Notification Message","orgId":1,"panelId":2,"ruleId":1,"ruleName":"Panel Title alert","ruleUrl":"http://localhost:3000/d/hZ7BuVbWz/test-dashboard?fullscreen\u0026edit\u0026tab=alert\u0026panelId=2\u0026orgId=1","state":"alerting","tags":{"tag name":"tag value"},"title":"[Alerting] Panel Title alert"}

若有收获,就点个赞吧
0 人点赞
