- 一个服务于Elastic的可视化平台
- Analytics
- Developer examples">Developer examples
- Overview">Overview
- Discover,query:(language:kuery,query:’’),refreshInterval:(pause:!f,value:10000),time:(from:now-15m,to:now)))">Discover,query:(language:kuery,query:’’),refreshInterval:(pause:!f,value:10000),time:(from:now-15m,to:now)))
- Dashboard,refreshInterval:(pause:!f,value:10000),time:(from:now-15m,to:now))&_a=(description:’’,filters:!(),fullScreenMode:!f,options:(hidePanelTitles:!f,useMargins:!t),query:(language:kuery,query:’’),tags:!(),timeRestore:!f,title:myTest,viewMode:view))">Dashboard,refreshInterval:(pause:!f,value:10000),time:(from:now-15m,to:now))&_a=(description:’’,filters:!(),fullScreenMode:!f,options:(hidePanelTitles:!f,useMargins:!t),query:(language:kuery,query:’’),tags:!(),timeRestore:!f,title:myTest,viewMode:view))
- Canvas">Canvas
- Maps">Maps
- Machine Learning">Machine Learning
- Graph">Graph
- Visualize Library,query:(language:kuery,query:’’),refreshInterval:(pause:!f,value:10000),time:(from:now-15m,to:now)))">Visualize Library,query:(language:kuery,query:’’),refreshInterval:(pause:!f,value:10000),time:(from:now-15m,to:now)))
- Enterprise Search
- Observability
- Security
- Management
一个服务于Elastic的可视化平台
- 搜索、观察和保护
- AppSearch 使您能够为您的应用程序、工作场所和网站创建搜索体验。
- Elastic Observability使您能够实时监控所有环境中发生的事件并将其应用分析。您可以分析日志事件、监控其运行所在的主机或容器的性能指标、跟踪事务并检查整体服务可用性。
- Elastic Security专为安全分析师而设计,可提供您环境中事件和警报的概览。Elastic Security 可帮助您在损坏和损失发生之前保护您的组织免受威胁。。
- 可视化和分析您的数据。 搜索隐藏的见解,将您在图表、仪表、地图等中发现的内容可视化,并将它们组合到仪表板中。
- 管理、监控和保护 Elastic Stack。 管理您的索引和摄取管道,监控您的 Elastic Stack 集群的运行状况,并控制哪些用户可以访问哪些功能。
Analytics
Developer examples
Overview
Discover,query:(language:kuery,query:’’),refreshInterval:(pause:!f,value:10000),time:(from:now-15m,to:now)))
发现面板,可以可以查看index-pattern指定的索引的数据
- 左边侧边栏可以指定要展示的列,中间显示数据。也可以指定使用的index-pattern
- 在创建index-pattern的时候,如果只有一个timestamp时间戳类型的字段,会默认指定,kibana里面很多的查询都是基于时间,右上角是时间过滤器就是根据你创建索引用的字段进行过滤。如果没有timestamp类型的字段,不会出现时间过滤器
- 查询创建好了之后,右上角选择save,下次可以在右上角的open里面打开以前编辑好的面板,每次默认进discovery都是new新的一个面板

Dashboard,refreshInterval:(pause:!f,value:10000),time:(from:now-15m,to:now))&_a=(description:’’,filters:!(),fullScreenMode:!f,options:(hidePanelTitles:!f,useMargins:!t),query:(language:kuery,query:’’),tags:!(),timeRestore:!f,title:myTest,viewMode:view))
dashboard是一个综合看板,这里可以展示很多的查询结果和统计图等,需要自行设计
Canvas
Maps
Machine Learning
Graph
Visualize Library,query:(language:kuery,query:’’),refreshInterval:(pause:!f,value:10000),time:(from:now-15m,to:now)))
在dashboard种中创建的所有panel都可以选择保存到这里,可以被重复使用
Enterprise Search
Observability
Overview
Logs
Metrics
APM
它允许您实时监控软件服务和应用程序;可视化服务的详细性能信息,识别和分析错误,并监控主机级别和特定于代理的指标,如JVM和Go运行时指标。
Uptime
User Experience
Security
Management
Dev Tools
Fleet
Stack Monitoring
Stack Management
Ingest
Ingest Node Pipelines
Logstash Pipelines
Beats Central Management
Data
Index Management 查看es中创建的所有索引
Index Lifecycle Policies
Snapshot and Restore
Rollup Jobs
Transforms
Cross-Cluster Replication
Remote Clusters
Alerts and Insights
Alerts and Actions
Reporting
Machine Learning Jobs
Watcher
Security
Users 权限管理->创建/修改用户
Roles 权限管理->创建/修改角色
API Keys
Role Mappings
Kibana
Index Patterns 需要对es里面的索引创建Index-pattern才可以对数据进行分析
索引模式可以使用通配符匹配多个es的index项
Saved Objects
在Kibana里所有保存的数据对象,都会存在Stack-Management->Kibana->Saved Objects里面,截图如下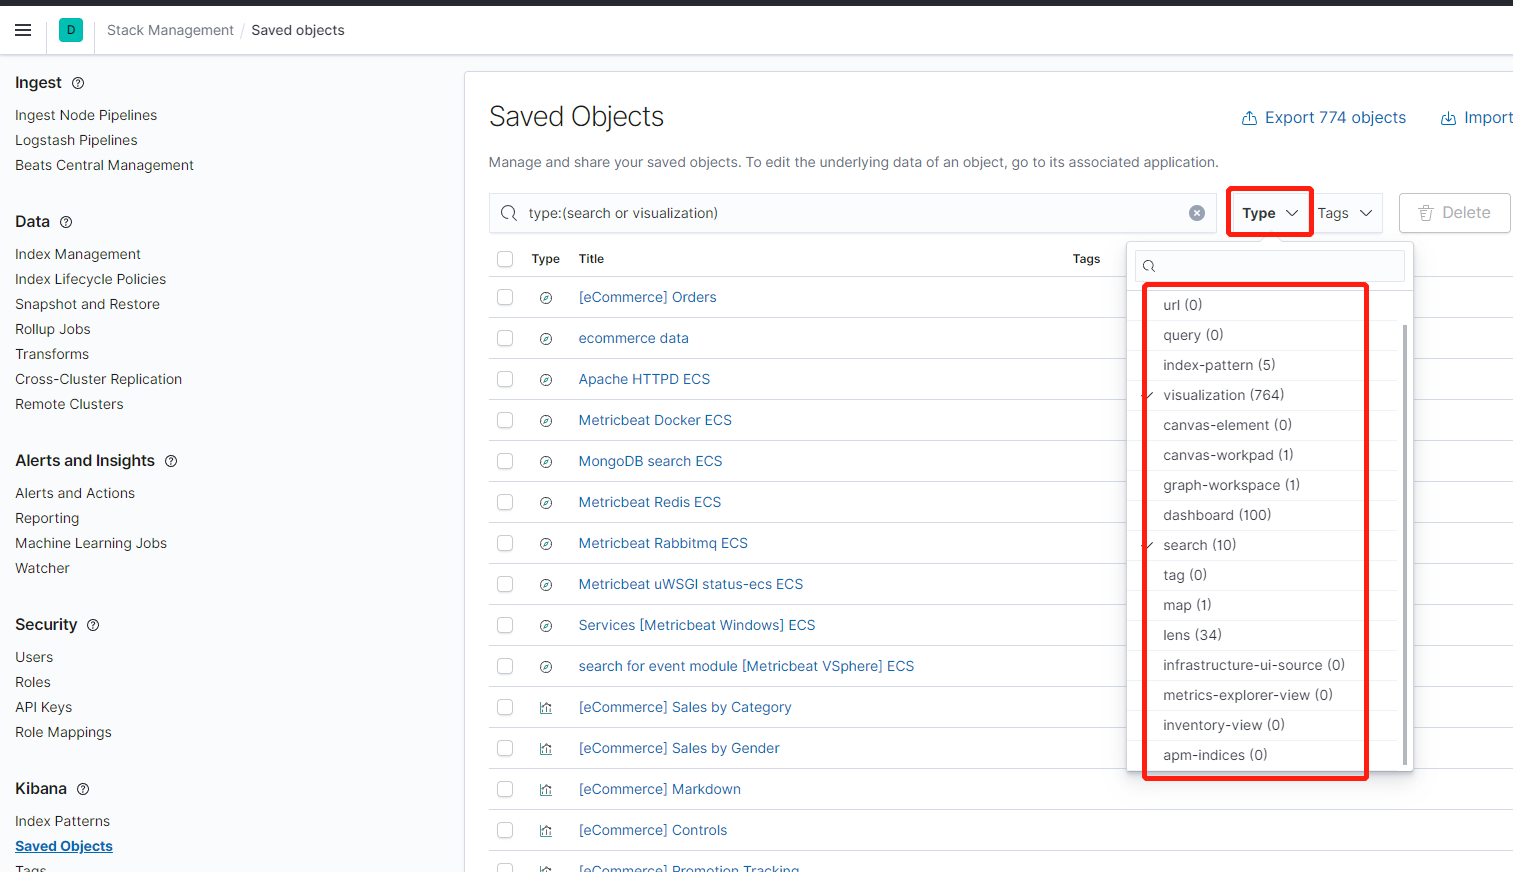
Tags
Search Sessions
Spaces 权限管理的分层Spaces(可用于整个团队)->roles(用于部门)->users(用于个人)
Advanced Settings kibana的系统设置
Stack
License Management 许可证
发行版默认使用的是basic license许可证,有一些功能不可用,可以在Stack-Management->-Stack->License Management进行升级
也可以在配置文件里面启用试用版许可证
xpack.security.enabled: true-xpack.license.self_generated.type: trial
使用许可证有效期30天,到期后自动恢复到basic许可证
这是日志打印,试用到期系统将会收回的功能提要
# If you have a new license, please update it. Otherwise, please reach out to# your support contact.## Commercial plugins operate with reduced functionality on license expiration:# - security# - Cluster health, cluster stats and indices stats operations are blocked# - All data operations (read and write) continue to work# - watcher# - PUT / GET watch APIs are disabled, DELETE watch API continues to work# - Watches execute and write to the history# - The actions of the watches don't execute# - monitoring# - The agent will stop collecting cluster and indices metrics# - The agent will stop automatically cleaning indices older than [xpack.monitoring.history.duration]# - graph# - Graph explore APIs are disabled# - ml# - Machine learning APIs are disabled# - logstash# - Logstash will continue to poll centrally-managed pipelines# - beats# - Beats will continue to poll centrally-managed configuration# - deprecation# - Deprecation APIs are disabled# - upgrade# - Upgrade API is disabled# - sql# - SQL support is disabled# - rollup# - Creating and Starting rollup jobs will no longer be allowed.# - Stopping/Deleting existing jobs, RollupCaps API and RollupSearch continue to function.# - transform# - Creating, starting, updating transforms will no longer be allowed.# - Stopping/Deleting existing transforms continue to function.# - analytics# - Aggregations provided by Analytics plugin are no longer usable.# - ccr# - Creating new follower indices will be blocked# - Configuring auto-follow patterns will be blocked# - Auto-follow patterns will no longer discover new leader indices# - The CCR monitoring endpoint will be blocked# - Existing follower indices will continue to replicate data

若有收获,就点个赞吧
0 人点赞
