3. 加载输入数据、设置其格式并直观呈现
我们首先加载要用于训练模型的数据、设置其格式并让数据直观呈现出来。
我们将从为您托管的 JSON 文件中加载“cars”数据集。它包含与每辆指定汽车有关的多个不同特征。在本教程中,我们只希望提取有关马力和每加仑英里数的数据。
将以下代码添加到您的
script.js 文件中
/*** Get the car data reduced to just the variables we are interested* and cleaned of missing data.*/async function getData() {const carsDataResponse = await fetch('https://storage.googleapis.com/tfjs-tutorials/carsData.json');const carsData = await carsDataResponse.json();const cleaned = carsData.map(car => ({mpg: car.Miles_per_Gallon,horsepower: car.Horsepower,})).filter(car => (car.mpg != null && car.horsepower != null));return cleaned;}
这样还会移除尚未定义每加仑的英里数或马力的所有条目。让我们以散点图的形式绘制这些数据,以查看其呈现样式。
将以下代码添加到
script.js 文件的底部。
async function run() {// Load and plot the original input data that we are going to train on.const data = await getData();const values = data.map(d => ({x: d.horsepower,y: d.mpg,}));tfvis.render.scatterplot({name: 'Horsepower v MPG'},{values},{xLabel: 'Horsepower',yLabel: 'MPG',height: 300});// More code will be added below}document.addEventListener('DOMContentLoaded', run);
刷新页面时,您应该会在页面左侧看到一个面板,其中显示了数据的散点图。应如下所示。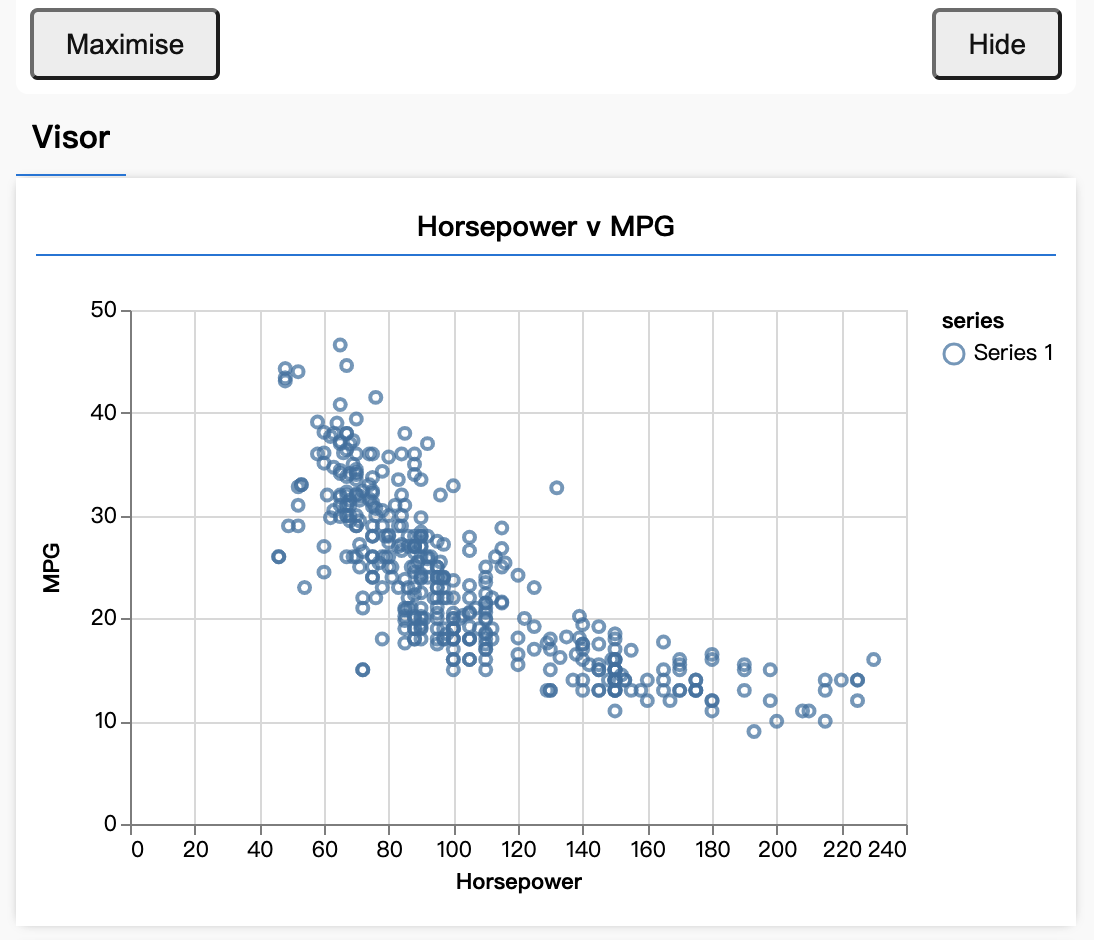
此面板称为 visor,由 tfjs-vis 提供,可便利地直观显示数据形状。
通常,在处理数据时,建议您设法查看数据并在必要时清理这些数据。在本例,我们必须从 carsData 中移除某些不包含所有必填字段的条目。直观呈现数据可让我们了解模型可以学习的数据是否存在任何结构。
从上图中可以看出,马力与 MPG 之间成反比,也就是说,随着马力越大,汽车耗用一加仑汽油能行使的英里数通常越少。
注意:如果数据中不存在任何结构(模式),也就是说数据是随机的,那么模型实际上将学不到任何东西。
形成任务的概念
现在,输入数据将如下所示。
...{"mpg":15,"horsepower":165,},{"mpg":18,"horsepower":150,},{"mpg":16,"horsepower":150,},...
我们的目标是训练一个模型,该模型将获取一个一个数字“马力”,并学习预测一个数字“每加仑的英里数”。请注意,这是一对一的映射,该映射对于下一部分非常重要。
我们将这些样本(马力和 MPG)提供给神经网络,神经网络将通过这些样本学习一个公式(或函数),以预测汽车在指定马力下的 MPG。这种通过从我们提供正确答案的样本来学习的方式称为监督式学习。

若有收获,就点个赞吧
0 人点赞
