1-慢查询
1.1-一条慢查询sql
在电商场景中根据用户id,订单号,订单状态,支付类型来查询一条订单是再正常不过的场景了:
SELECT*FROM`order`WHEREuser_id = 1022AND order_id = 'c82388f1104a43118e3b5cf134c31195'AND STATUS = 1AND pay_type = 1;
注意我们前面的order订单表中现在有1千万条数据,没有任何索引优化。
但是这条sql在数据库中执行了4秒钟,你想想如果所有人在你的app中查询超过4s是个什么感受。
1.2-为什么慢
1.2.1-explain 查看sql的执行计划
EXPLAIN SELECT*FROM`order`WHEREuser_id = 1022AND order_id = 'c82388f1104a43118e3b5cf134c31195'AND STATUS = 1AND pay_type = 1;

通过输出的结果来看,这条sql大致扫描了9百万将近1千万行数据,所以执行慢是应该的。
1.2.2-哪里慢
具体看哪里慢可以根据这些字段来具体分析,那么这些字段具体表示什么含义呢?
| id | 查询编号 |
|---|---|
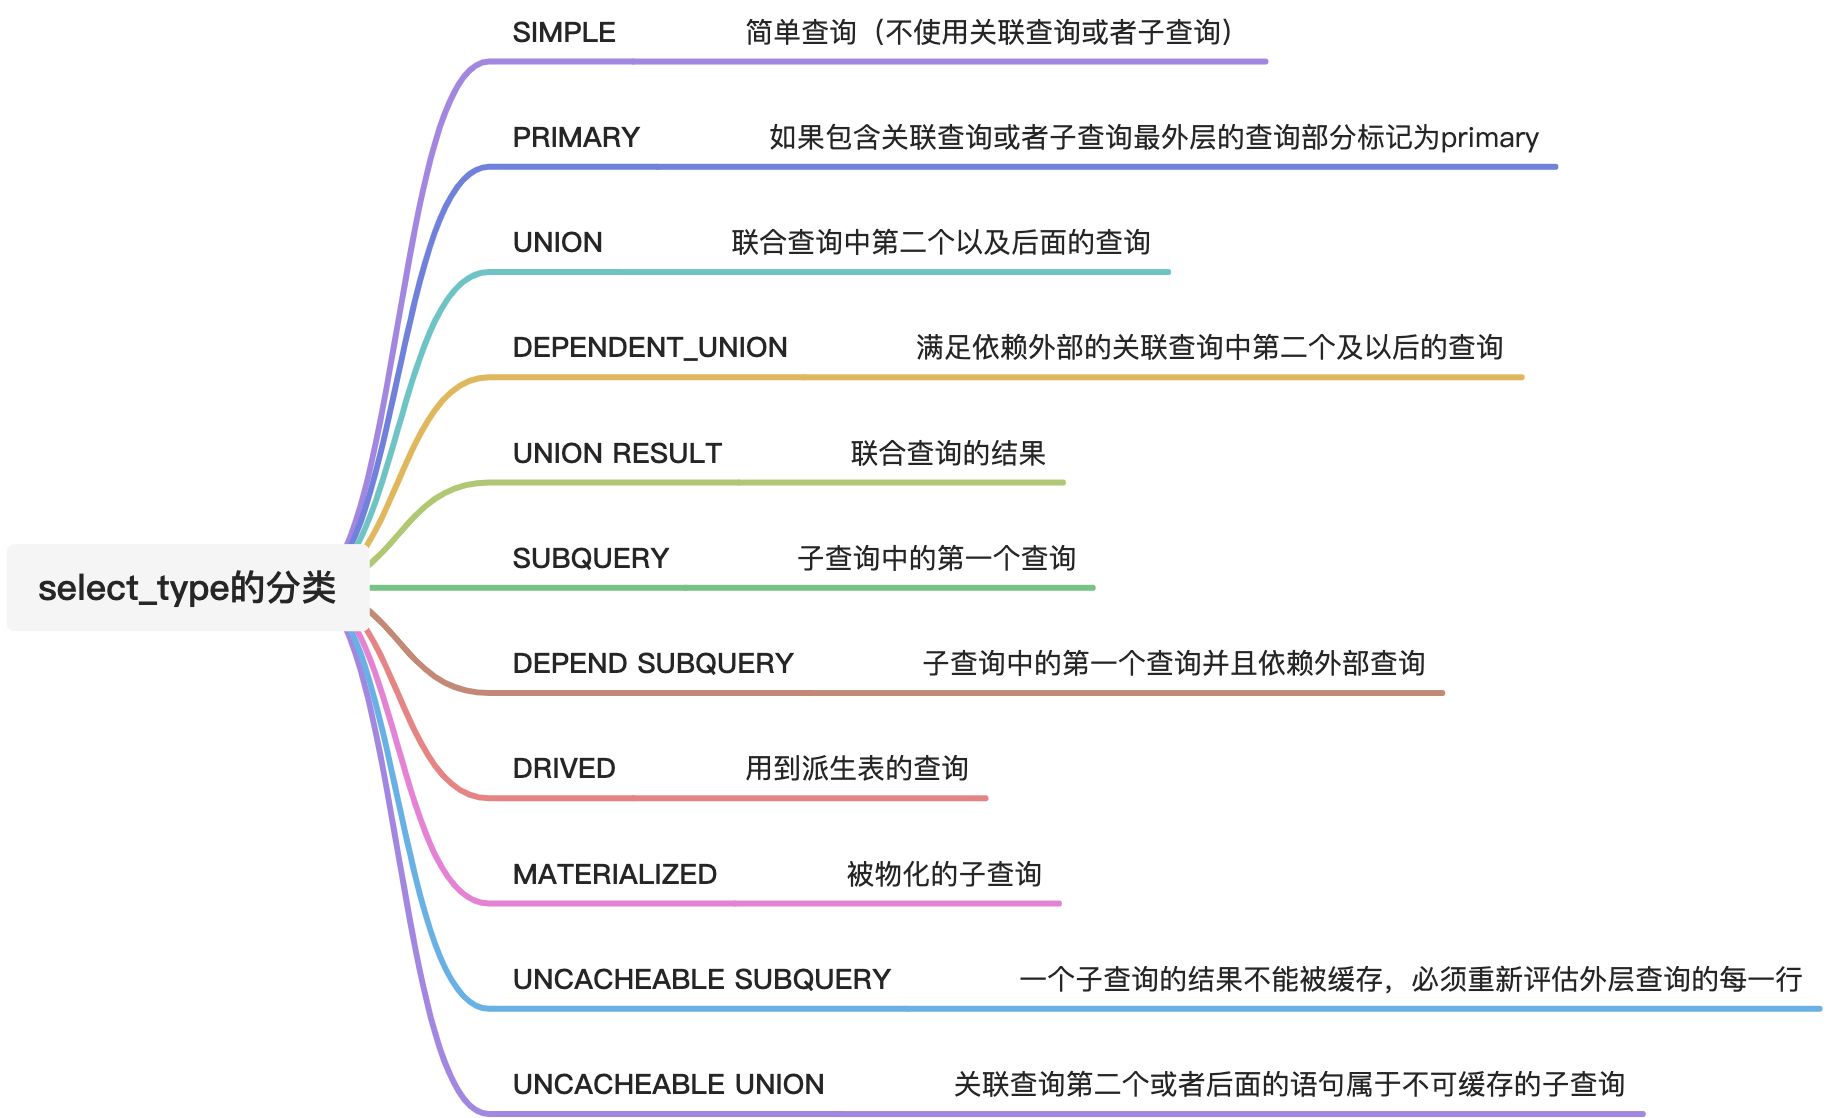
| select_type | 查询类型:显示本行是简单还是复杂查询(这条sql就是简单的查询) |
| table | 涉及到的表 |
| partitions | 匹配的分区:查询将匹配记录所在的分区。仅当使用 partition 关键字时才显示该列。对于非分区表,该值为 NULL。 |
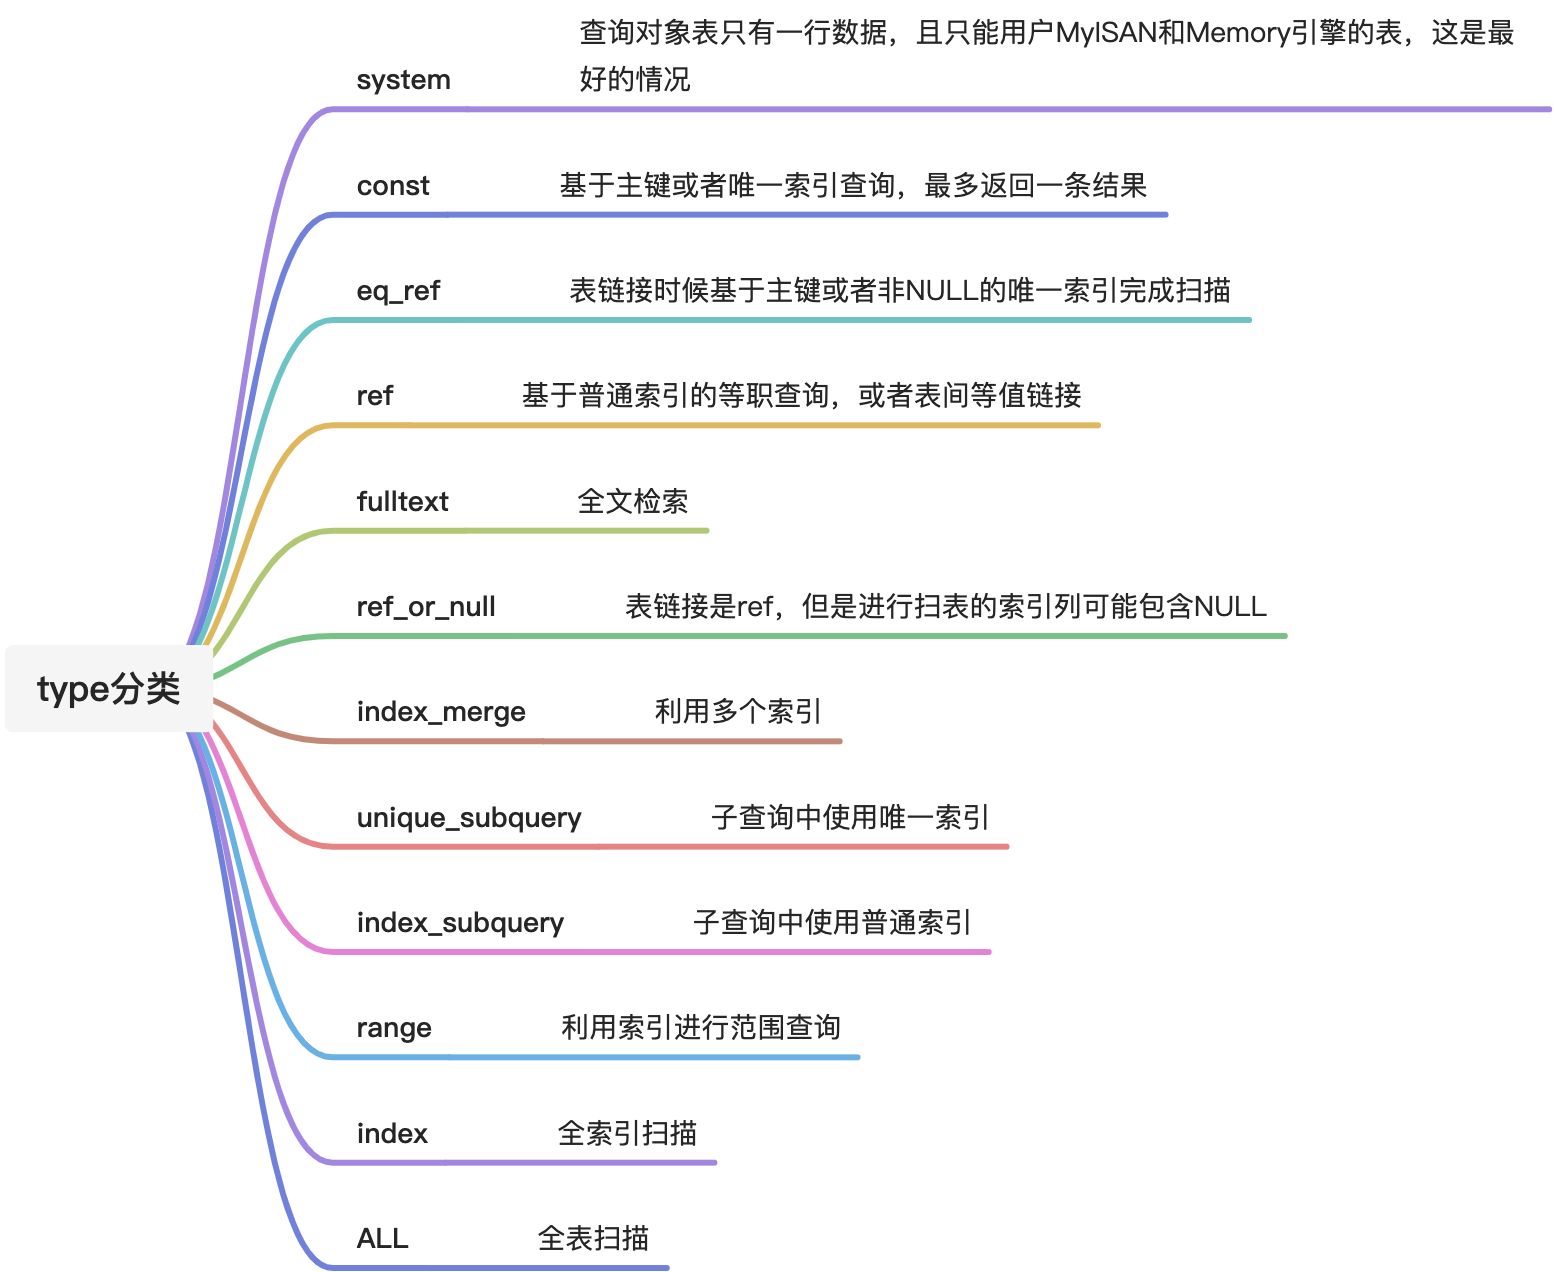
| type | 本次查询的表连接类型 |
| possible_keys | 可能选择的索引 |
| key | 实际选择的索引 |
| key_len | 被选择的索引长度:一般用于判断联合索引有多少列被选择了 |
| ref | 与索引比较的列 |
| rows | 预计需要扫描的行数,对 InnoDB 来说,这个值是估值,并不一定准确 |
| filtered | 按条件筛选的行的百分比 |
| Extra | 附加信息 |
https://dev.mysql.com/doc/refman/8.0/en/explain-output.html#explain_key_len

1.3-捕捉慢查询
1.3.1-配置MySQL慢查询
先看看当前慢查询相关的参数配置
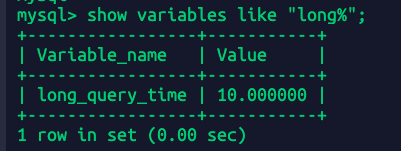
show variables like "slow%";show variables like "long%";
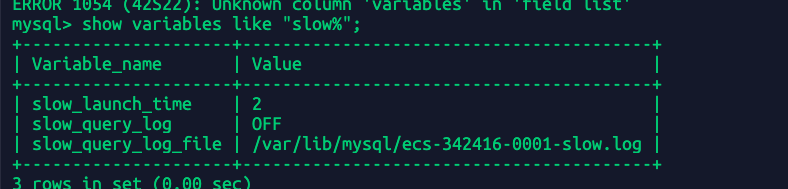
slow_query_log:慢查询状态是否开启
slow_query_log: 慢查询文件位置
long_query_time:慢查询时间阈值
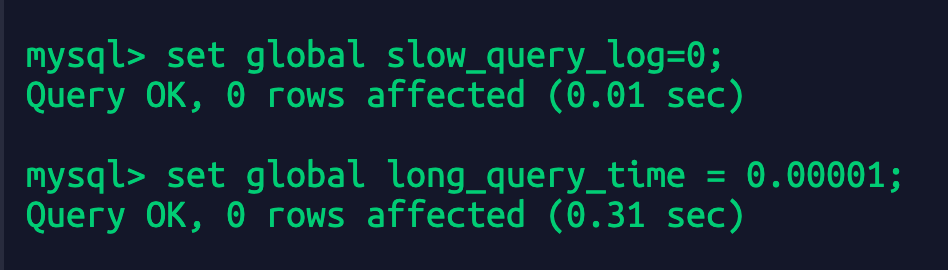
1.3.2-开启慢查询日志
set global slow_query_log = on;//开启慢查询set global long_query_time = 0.00001;//设置慢查询时间为0.00001秒
默认mysql慢查询是不开启;慢查询默认的时间是10s。一般来讲如果线上要求sql执行时间不能超过1s,那么本地测试的时候long_query_time的值可以设置的更小,比如0.5s或者200ms
再次执行之前的sql:
SELECT * from `order` WHERE user_id=1022 and order_id = 'c82388f1104a43118e3b5cf134c31195' and status=1 and pay_type = 1;
查看慢日志
wc ecs-342416-0001-slow.log #查看慢日志的长度cat ecs-342416-0001-slow.log
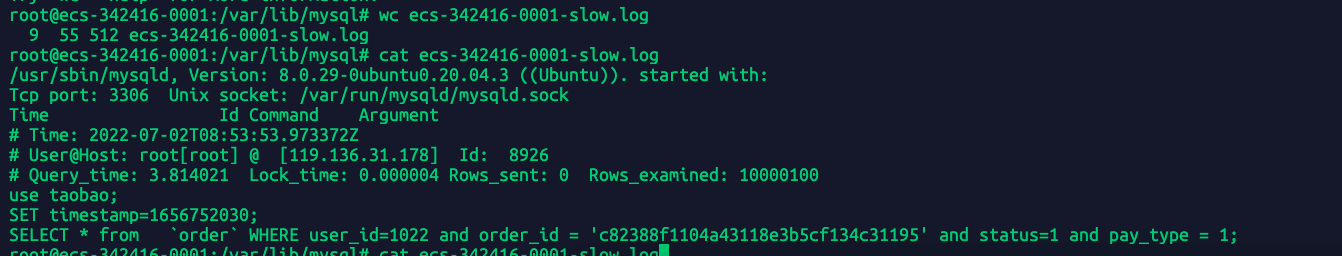
因为整个mysql实例是第一次慢日志,所以目前慢日志数据比较小,可以直接cat查看全部日志内容。 具体地方:/var/lib/mysql/ecs-342416-0001-slow.log
/usr/sbin/mysqld, Version: 8.0.29-0ubuntu0.20.04.3 ((Ubuntu)). started with:Tcp port: 3306 Unix socket: /var/run/mysqld/mysqld.sockTime Id Command Argument# Time: 2022-07-02T08:53:53.973372Z# User@Host: root[root] @ [119.136.31.178] Id: 8926查询时间3.8s 等待锁的时间0.000004秒# Query_time: 3.814021 Lock_time: 0.000004 Rows_sent: 0 Rows_examined: 10000100use taobao;SET timestamp=1656752030;SELECT * from `order` WHERE user_id=1022 and order_id = 'c82388f1104a43118e3b5cf134c31195' and status=1 and pay_type = 1;
Query_time:sql执行时间3.8s
Lock_time:等待锁的时间
Rows_sent:返回的结果行数为0
Rows_examined:扫描的行数量
1.3.3-小数据下也能出现慢查询
在很早之前我觉得数据库基本上百万千万才会出现慢查询,实际上当系统并发高 数据库并发负载高的时候,十几万的数据也可能拖出满查询。当时那个表中只有十几万的数据数据,但是因为那个接口访问的频次很高,估计1000+qps,所以因为我那个接口导致数据库负载变高,进一步导致这条sql变成慢查询。
为了模拟当时的情况,创建了一个订单表trade_order:
CREATE TABLE `trade_order` (`id` int NOT NULL AUTO_INCREMENT,`code` varchar(200) NOT NULL,`third_code` varchar(200) NOT NULL,`status` int NOT NULL,`pay_type` int NOT NULL,`postage` int NOT NULL,`amount` int NOT NULL,`query_request` longtext NOT NULL,`query_response` longtext NOT NULL,`is_delete` int NOT NULL,`create_at` datetime(6) NOT NULL,`update_at` datetime(6) NOT NULL,`coupons_id` int DEFAULT NULL,`user_id` int DEFAULT NULL,PRIMARY KEY (`id`),UNIQUE KEY `code` (`code`),UNIQUE KEY `third_code` (`third_code`),KEY `trade_order_coupons_id_4b2e0ea7_fk_product_coupons_id` (`coupons_id`),KEY `trade_order_user_id_73d6b9d9_fk_user_userprofile_id` (`user_id`),CONSTRAINT `trade_order_coupons_id_4b2e0ea7_fk_product_coupons_id` FOREIGN KEY (`coupons_id`) REFERENCES `product_coupons` (`id`),CONSTRAINT `trade_order_user_id_73d6b9d9_fk_user_userprofile_id` FOREIGN KEY (`user_id`) REFERENCES `user_userprofile` (`id`)) ENGINE=InnoDB AUTO_INCREMENT=119185 DEFAULT CHARSET=utf8mb4 COLLATE=utf8mb4_0900_ai_ci
由于时间问题此时这个表我只生成了138891条数据
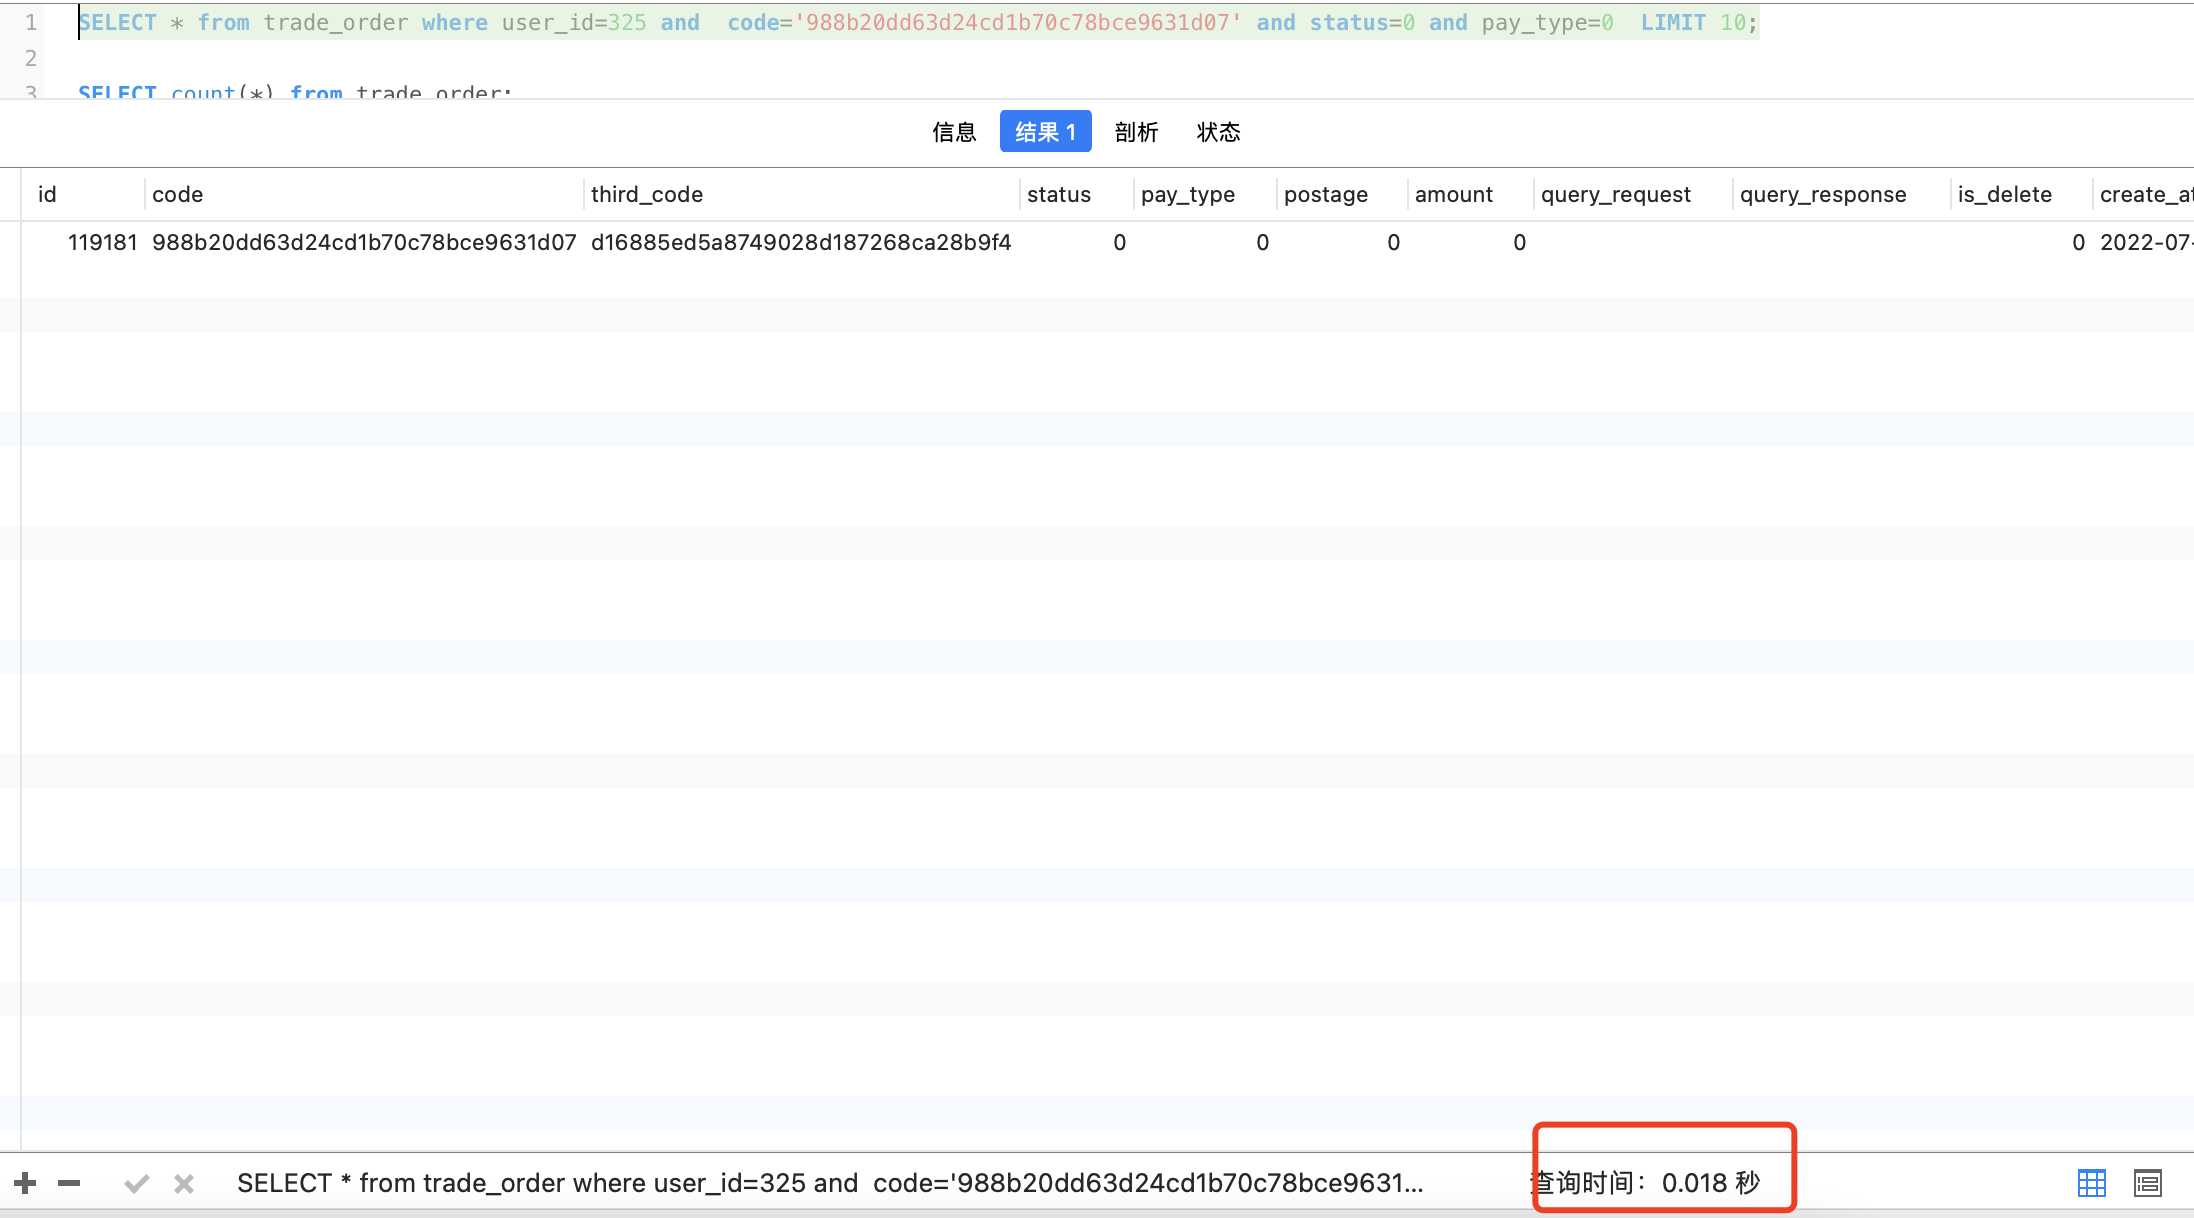
先单独执行sql只花了0.018s
SELECT * from trade_order where user_id=325 and code='988b20dd63d24cd1b70c78bce9631d07' and status=0 and pay_type=0 LIMIT 10;
为了保证到mysql的并发尽量多,我创建了一个django项目对外提供api接口,用k8s部署了10个pod提供了一个订单列表接口:http://xtmall.1400720231.cn/api/v1/orders,并且用压测工具去测试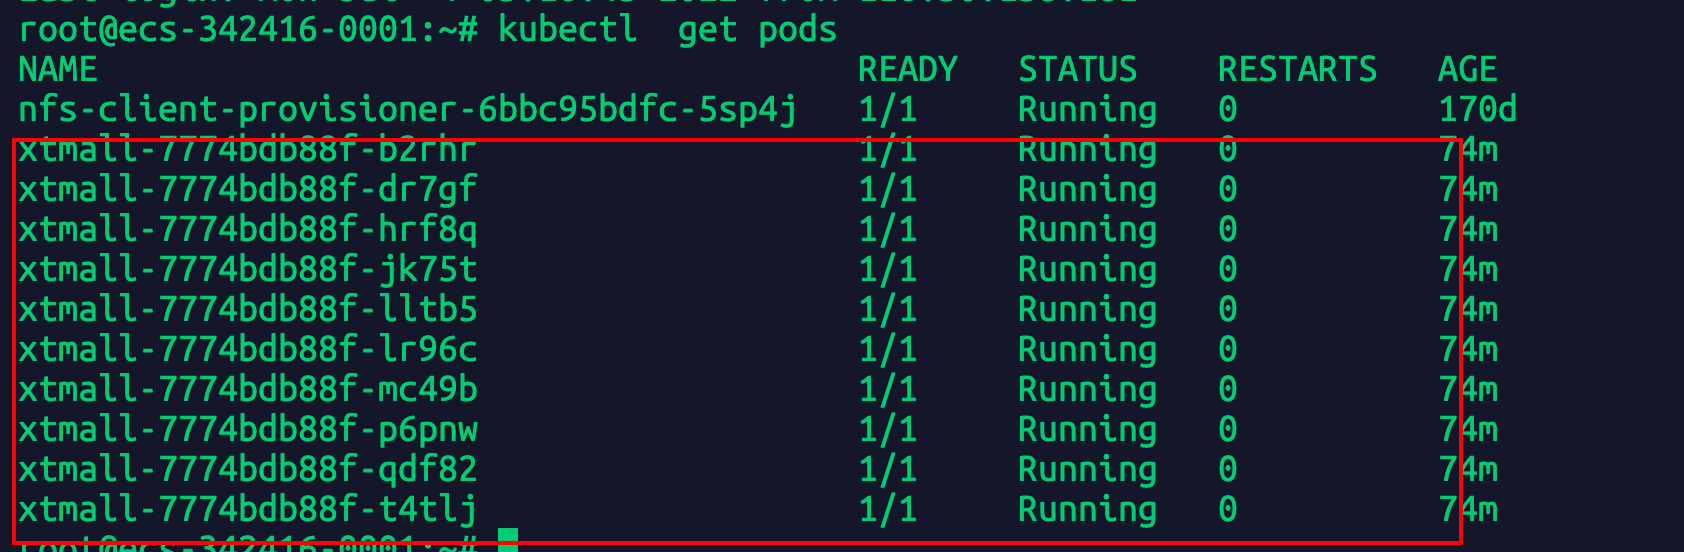
./go-stress-testing-mac -c 2000 -n 200 -d true -u http://xtmall.1400720231.cn/api/v1/orders?code=988b20dd63d24cd1b70c78bce9631d07&status=0&pay_type=0
-c:2000并发 -n 每个协程执行200次,也就是20万次请求。 压测工具地址见GitHub:https://github.com/link1st/go-stress-testing
执行一会后压测结果显示请求失败: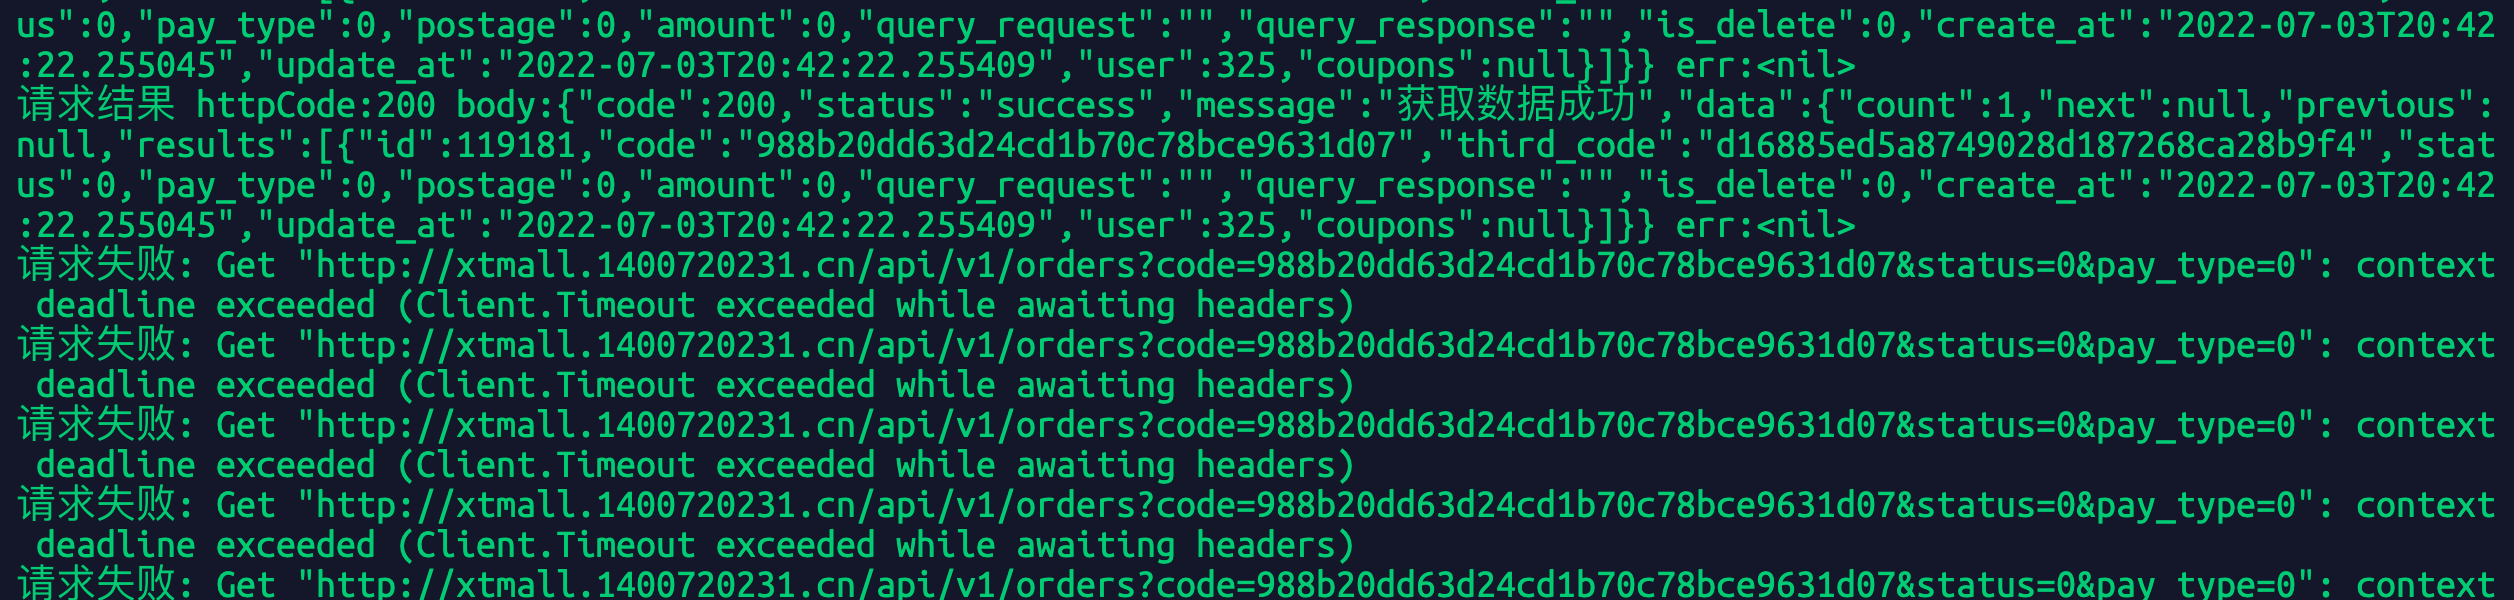
查看慢日志:
wc /var/lib/mysql/ecs-342416-0001-slow.log #不一会已经5000条了,估计全部是这条sqlcat /var/lib/mysql/ecs-342416-0001-slow.log

下载全部日志:
scp root@xxx.xxx.xxx:/var/lib/mysql/ecs-342416-0001-slow.log ./
/usr/sbin/mysqld, Version: 8.0.29-0ubuntu0.20.04.3 ((Ubuntu)). started with:Tcp port: 3306 Unix socket: /var/run/mysqld/mysqld.sockTime Id Command Argument# Time: 2022-07-02T08:53:53.973372Z# User@Host: root[root] @ [119.136.31.178] Id: 8926# Query_time: 3.814021 Lock_time: 0.000004 Rows_sent: 0 Rows_examined: 10000100use taobao;SET timestamp=1656752030;SELECT * from `order` WHERE user_id=1022 and order_id = 'c82388f1104a43118e3b5cf134c31195' and status=1 and pay_type = 1;-------手动分割线,上面是之前的慢sql-----------------/usr/sbin/mysqld, Version: 8.0.29-0ubuntu0.20.04.3 ((Ubuntu)). started with:Tcp port: 3306 Unix socket: /var/run/mysqld/mysqld.sockTime Id Command Argument/usr/sbin/mysqld, Version: 8.0.29-0ubuntu0.20.04.3 ((Ubuntu)). started with:Tcp port: 3306 Unix socket: /var/run/mysqld/mysqld.sockTime Id Command Argument# Time: 2022-07-03T16:56:09.840100Z# User@Host: root[root] @ [121.37.6.127] Id: 9456# Query_time: 0.502543 Lock_time: 0.000002 Rows_sent: 1 Rows_examined: 0use taobao;SET timestamp=1656867369;SELECT COUNT(*) AS `__count` FROM `trade_order`;# Time: 2022-07-03T16:56:09.872293Z# User@Host: root[root] @ [121.37.6.127] Id: 9460# Query_time: 0.550080 Lock_time: 0.000002 Rows_sent: 1 Rows_examined: 0SET timestamp=1656867369;SELECT COUNT(*) AS `__count` FROM `trade_order`;# Time: 2022-07-03T16:56:09.967736Z# User@Host: root[root] @ [121.37.6.127] Id: 9467# Query_time: 0.596039 Lock_time: 0.000002 Rows_sent: 1 Rows_examined: 0SET timestamp=1656867369;
这里出现的慢sql是因为django框架分页自带的返回查询总数需要执行count(*):
SELECT COUNT(*) AS `__count` FROM `trade_order`;
{"code": 200,"status": "success","message": "获取数据成功","data": {"count": 1,//这里需要执行count(*)"next": null,"previous": null,"results": [{"id": 119181,"code": "988b20dd63d24cd1b70c78bce9631d07","third_code": "d16885ed5a8749028d187268ca28b9f4","status": 0,"pay_type": 0,"postage": 0,"amount": 0,"query_request": "","query_response": "","is_delete": 0,"create_at": "2022-07-03T20:42:22.255045","update_at": "2022-07-03T20:42:22.255409","user": 325,"coupons": null}]}}
这不是我想要的例子,但是也从侧面证明了访问大表的时候接口不能频繁count(*),会导致慢查询。
我重新修改api接口不让他执行count(*),只执行目标sql然后重新压力测试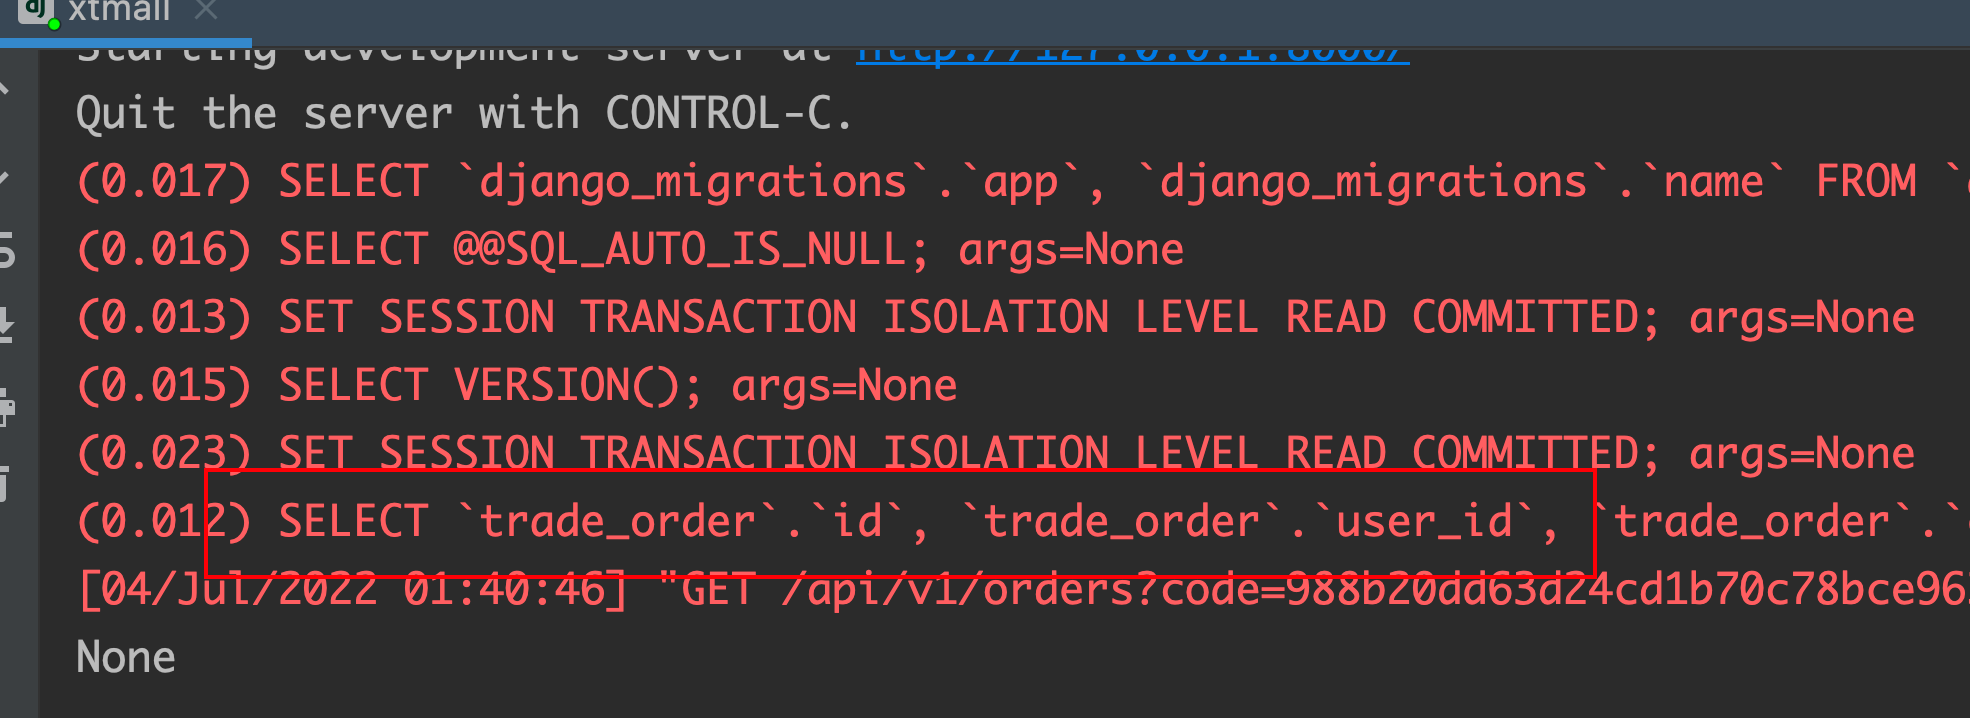
从django的终端输出来看现在是只执行一条sql的,重新打镜像部署k8s,k8s相关不是这的重点,我这里没展开。
{"code": 200,"status": "success","message": "获取数据成功","data": [{"id": 119181,"code": "988b20dd63d24cd1b70c78bce9631d07","third_code": "d16885ed5a8749028d187268ca28b9f4","status": 0,"pay_type": 0,"postage": 0,"amount": 0,"query_request": "","query_response": "","is_delete": 0,"create_at": "2022-07-03T20:42:22.255045","update_at": "2022-07-03T20:42:22.255409","user": 325,"coupons": null}]}
./go-stress-testing-mac -c 2000 -n 200 -d true -u http://xtmall.1400720231.cn/api/v1/orders?code=988b20dd63d24cd1b70c78bce9631d07&status=0&pay_type=0
SELECT COUNT(*) AS `__count` FROM `trade_order`;# Time: 2022-07-03T18:42:39.042713Z# User@Host: root[root] @ [116.30.138.181] Id: 131390# Query_time: 0.010625 Lock_time: 0.000000 Rows_sent: 0 Rows_examined: 0SET timestamp=1656873759;commit;#提交超时进入慢sql# Time: 2022-07-03T18:42:43.179633Z# User@Host: root[root] @ [116.30.138.181] Id: 131382# Query_time: 0.010447 Lock_time: 0.000000 Rows_sent: 0 Rows_examined: 0SET timestamp=1656873763;commit;# Time: 2022-07-03T18:42:43.182241Z# User@Host: root[root] @ [116.30.138.181] Id: 131385# Query_time: 0.010630 Lock_time: 0.000000 Rows_sent: 0 Rows_examined: 0SET timestamp=1656873763;commit;# Time: 2022-07-03T18:42:43.182253Z# User@Host: root[root] @ [116.30.138.181] Id: 131392# Query_time: 0.010310 Lock_time: 0.000000 Rows_sent: 0 Rows_examined: 0SET timestamp=1656873763;commit;
压测试的同时,我写了一个脚本测试写入数据是否正常。
查询也会被拖慢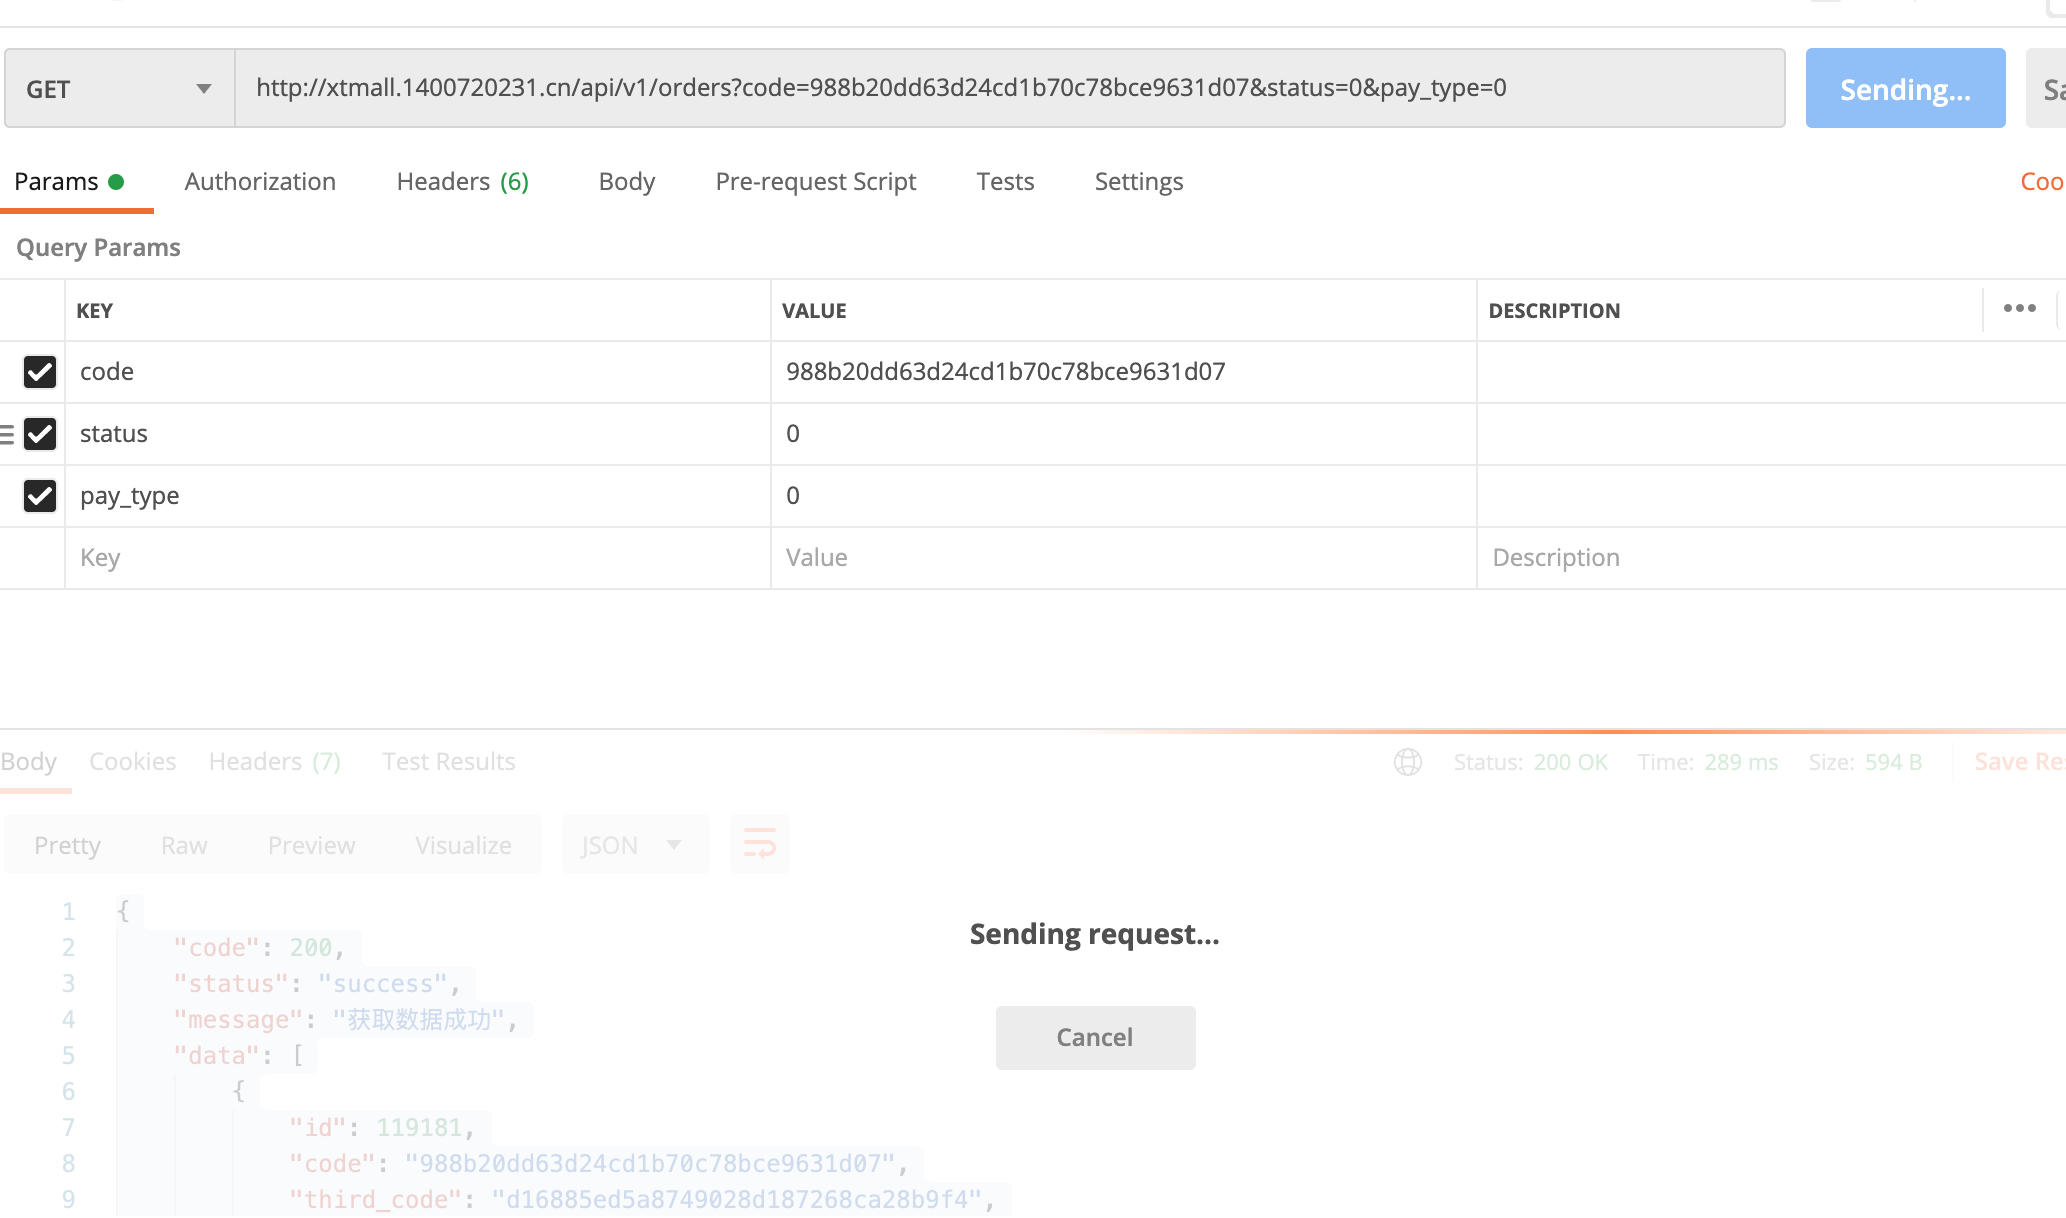
继续测试发现2条我期望的目标慢sql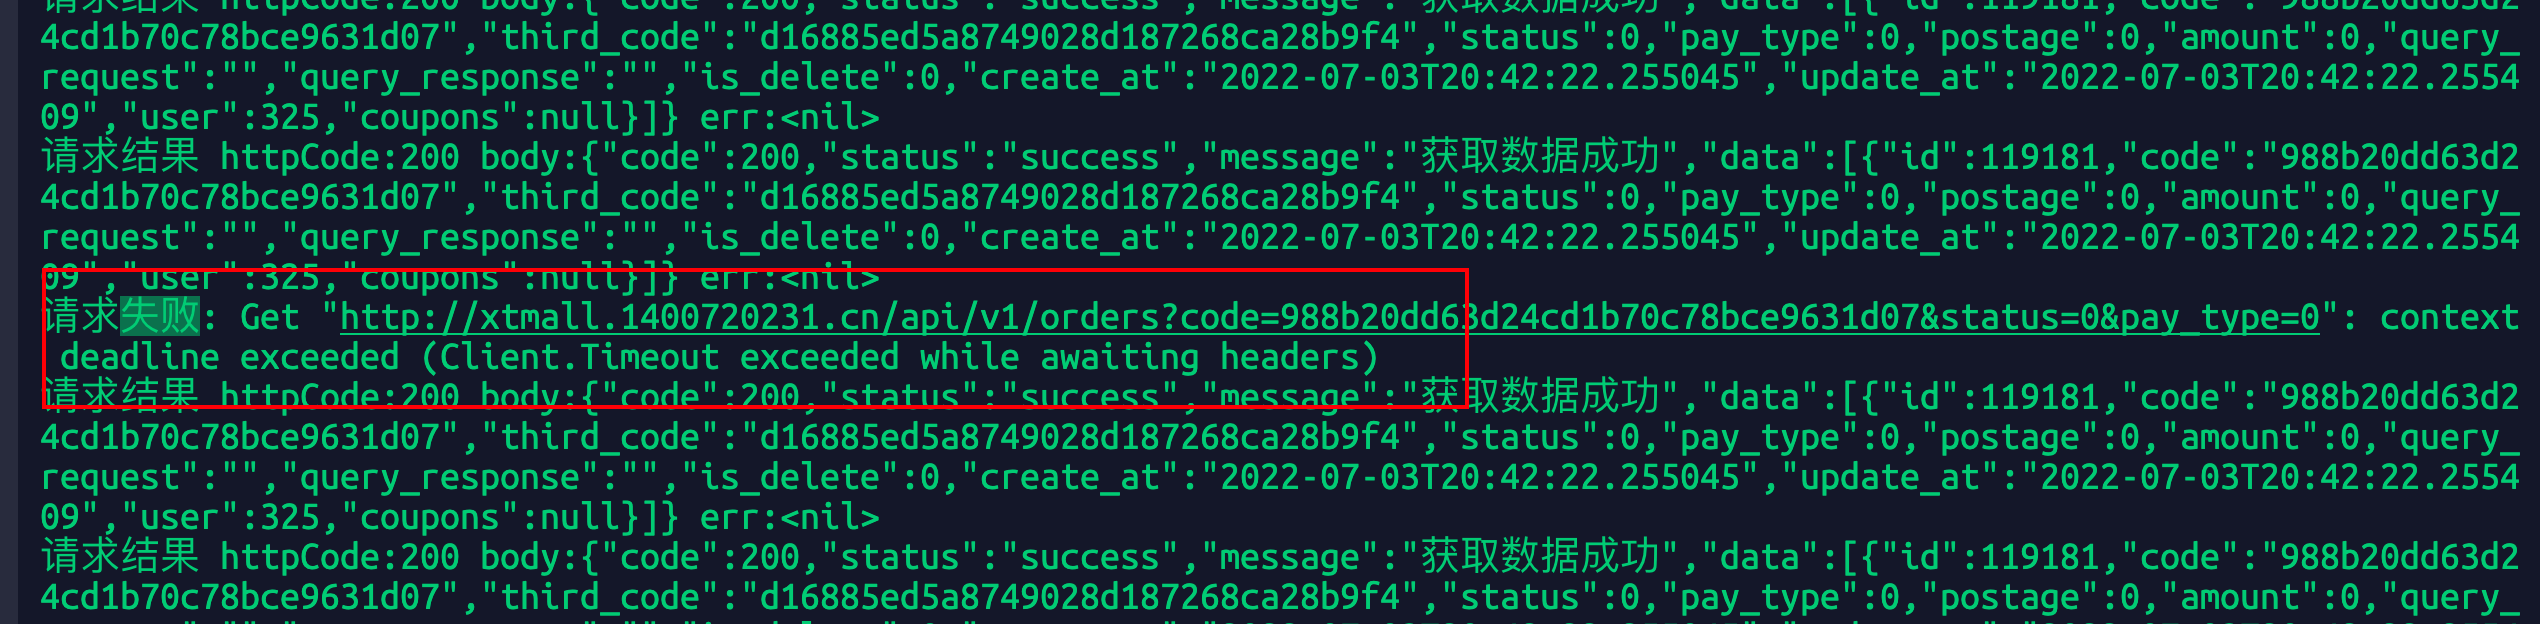
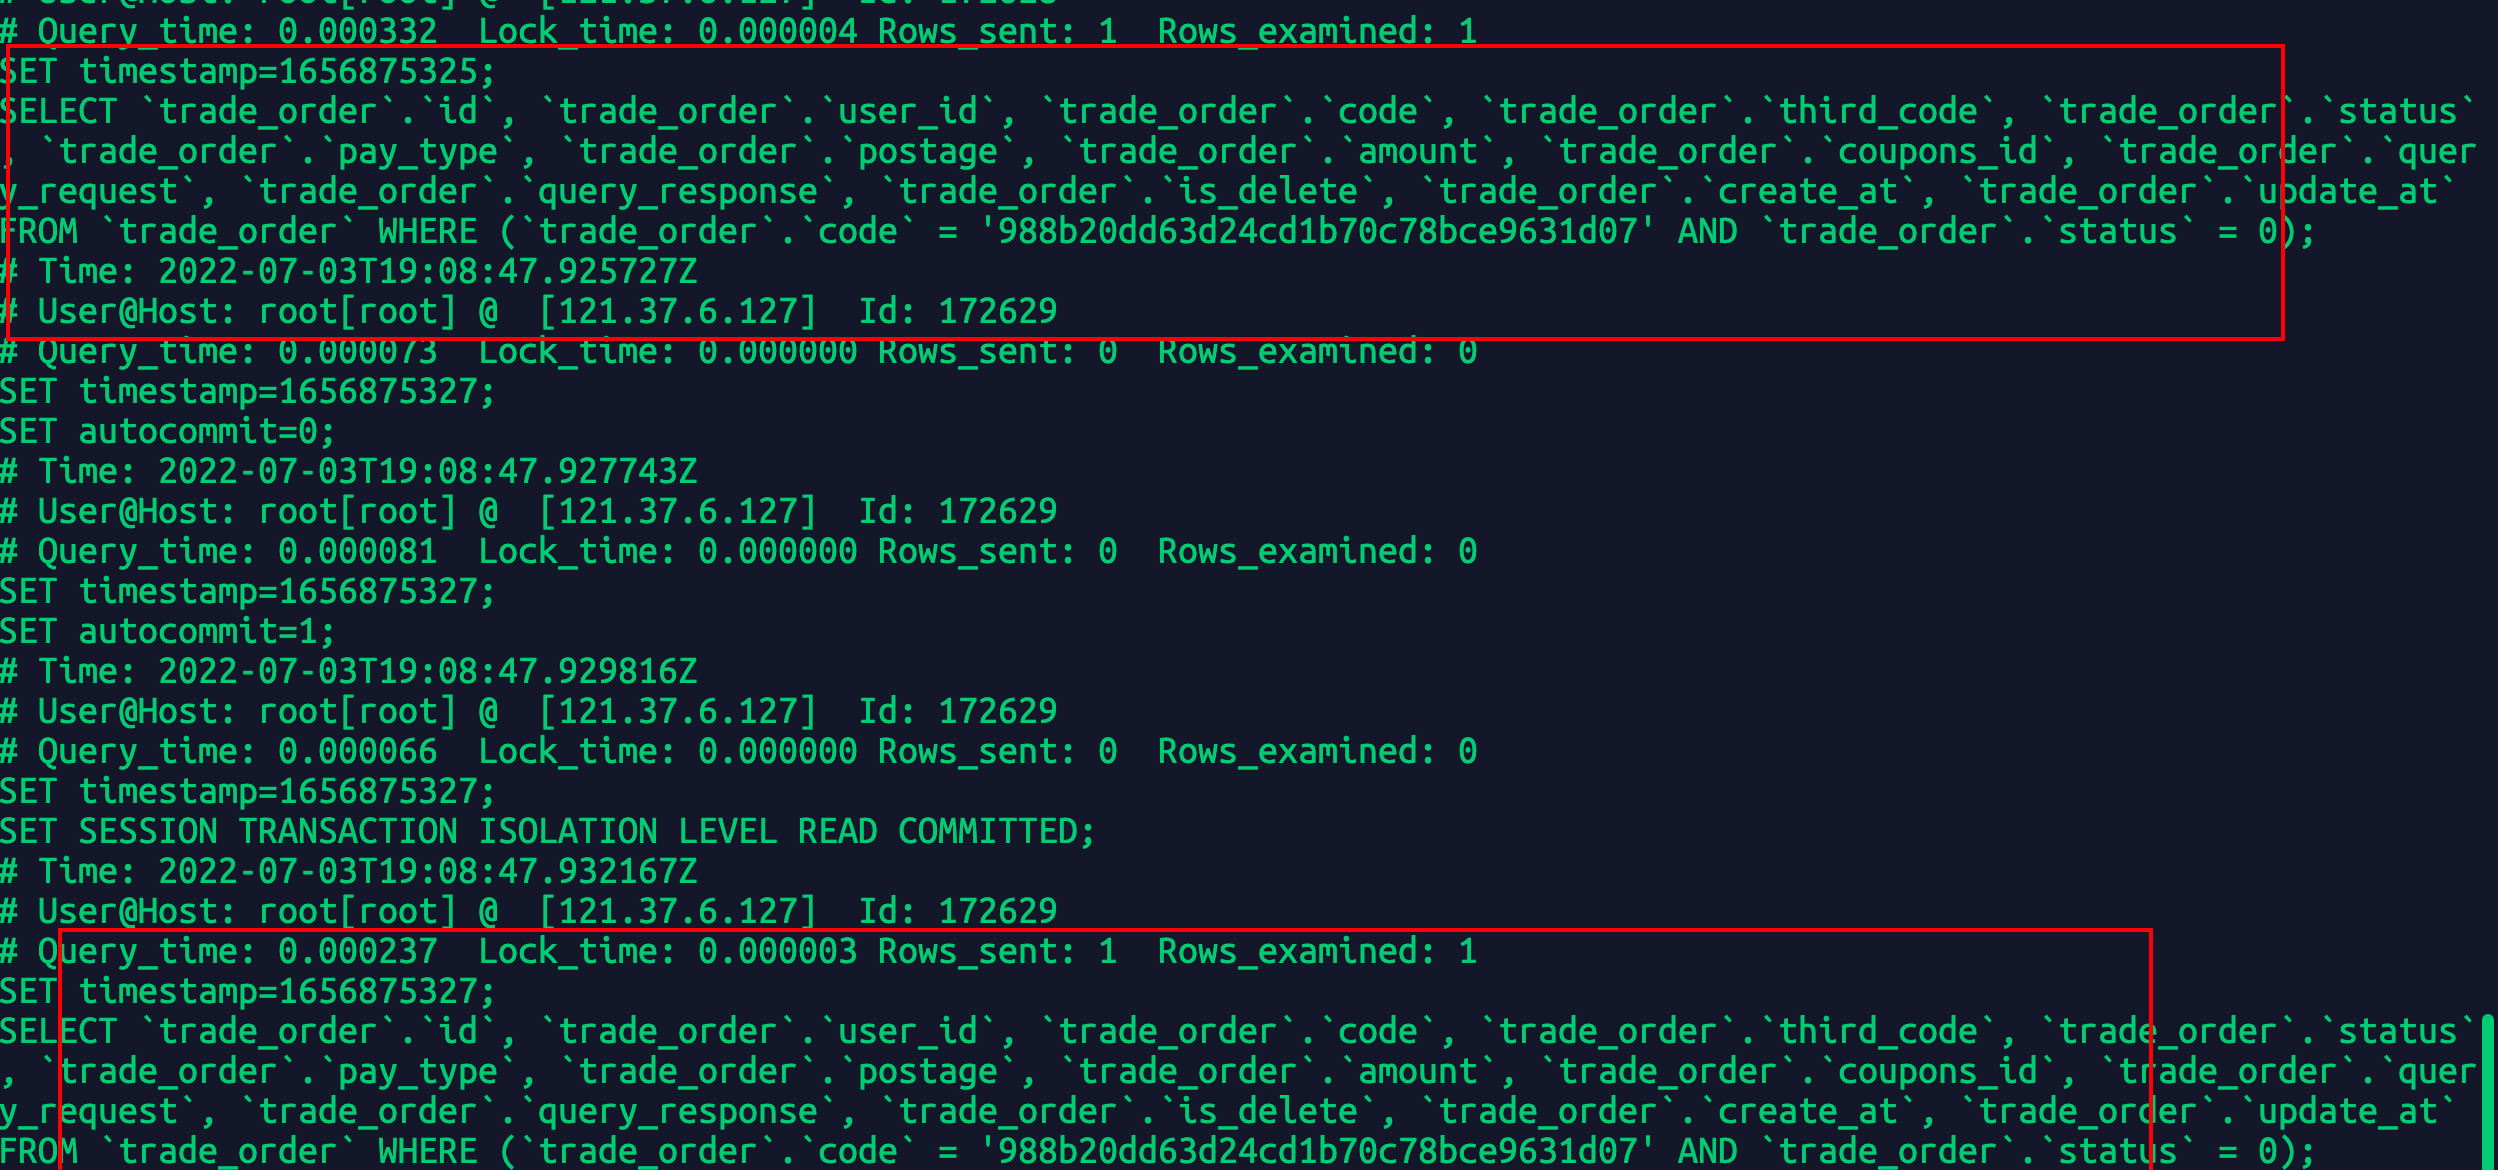
这基本上复现了我当时的场景:1万多条数据的表由于访问过高导致被拖入慢查询,导致cpu飙高,马上创建索引数据库就直接恢复了。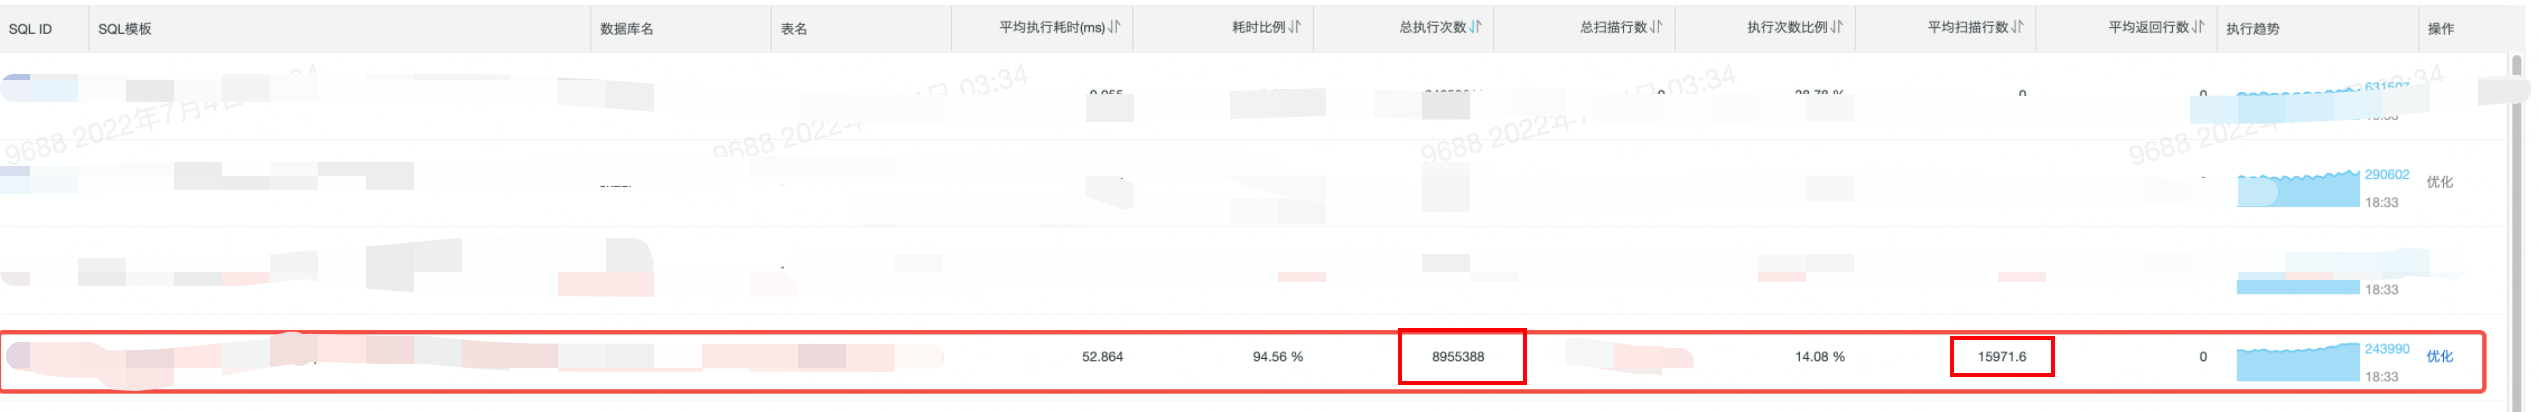
这是当时线上的截图。这条sql 2个月被执行900万次,平均扫描1万5千行,还没有我测试的数据多,而且当时mysql服务器配置比较高,但是还是被拖进了慢查询。 而且当时还出现了几条sql比我的这条sql扫描次数还多都没有对系统造成影响,确实是因为我的那个接口访问的业务频次太多了。
1.3.4-添加联合索引
alter table trade_order add index order_index(`user_id`,`code`,`status`,`pay_type`);

基于当前的设置后续继续设置短时间内没有再出现慢查询,索引还是有效的。

若有收获,就点个赞吧
0 人点赞
