可视化面板,功能齐全的度量仪表盘和图形编辑器,支持 Graphite、zabbix、InfluxDB、Prometheus、OpenTSDB、Elasticsearch 等作为数据源,比 Prometheus 自带的图表展示功能强大太多,更加灵活,有丰富的插件,功能更加强大。
部署
注意点:
- 使用最新版本的镜像 https://github.com/grafana/grafana
- 通过环境变量设置管理员账户密码
- GF_SECURITY_ADMIN_USER
- GF_SECURITY_ADMIN_PASSWORD
- 通过设置securityContext的方式让grafana进程使用root启动
- 数据挂载到本地
- 配置ingress暴露访问入口
deployment
apiVersion: apps/v1kind: Deploymentmetadata:name: grafananamespace: monitorspec:selector:matchLabels:app: grafanatemplate:metadata:labels:app: grafanaspec:volumes:- name: storagehostPath:path: /data/grafana/nodeSelector:app: prometheussecurityContext:runAsUser: 0containers:- name: grafanaimage: grafana/grafana:7.1.1imagePullPolicy: IfNotPresentports:- containerPort: 3000name: grafanaenv:- name: GF_SECURITY_ADMIN_USERvalue: admin- name: GF_SECURITY_ADMIN_PASSWORDvalue: adminreadinessProbe:failureThreshold: 10httpGet:path: /api/healthport: 3000scheme: HTTPinitialDelaySeconds: 60periodSeconds: 10successThreshold: 1timeoutSeconds: 30livenessProbe:failureThreshold: 3httpGet:path: /api/healthport: 3000scheme: HTTPperiodSeconds: 10successThreshold: 1timeoutSeconds: 1resources:limits:cpu: 150mmemory: 512Mirequests:cpu: 150mmemory: 512MivolumeMounts:- mountPath: /var/lib/grafananame: storage
service
kind: Servicemetadata:name: grafananamespace: monitorspec:type: ClusterIPports:- port: 3000selector:app: grafana
Ingress
apiVersion: extensions/v1beta1kind: Ingressmetadata:name: grafananamespace: monitorspec:rules:- host: grafana.luffy.comhttp:paths:- path: /backend:serviceName: grafanaservicePort: 3000
配置数据源
如何丰富Grafana监控面板:
导入dashboard
安装相应的插件
自定义监控面板
导入Dashboard的配置
dashboard: https://grafana.com/grafana/dashboards
Node Exporter https://grafana.com/grafana/dashboards/8919
Prometheus: https://grafana.com/grafana/dashboards/8588
DevOpsProdigy KubeGraf插件的使用
除了直接导入Dashboard,我们还可以通过安装插件的方式获得,Configuration -> Plugins可以查看已安装的插件,通过 官方插件列表 我们可以获取更多可用插件。
Kubernetes相关的插件:
grafana-kubernetes-app
devopsprodigy-kubegraf-app
DevOpsProdigy KubeGraf 是一个非常优秀的 Grafana Kubernetes 插件,是 Grafana 官方的 Kubernetes 插件的升级版本,该插件可以用来可视化和分析 Kubernetes 集群的性能,通过各种图形直观的展示了 Kubernetes 集群的主要服务的指标和特征,还可以用于检查应用程序的生命周期和错误日志。
# 进入grafana容器内部执行安装$ kubectl -n monitor exec -ti grafana-594f447d6c-jmjsw bashbash-5.0# grafana-cli plugins install devopsprodigy-kubegraf-app 1.4.1installing devopsprodigy-kubegraf-app @ 1.4.1from: https://grafana.com/api/plugins/devopsprodigy-kubegraf-app/versions/1.4.1/downloadinto: /var/lib/grafana/plugins✔ Installed devopsprodigy-kubegraf-app successfullyRestart grafana after installing plugins . <service grafana-server restart>bash-5.0# grafana-cli plugins install grafana-piechart-panelinstalling grafana-piechart-panel @ 1.5.0from: https://grafana.com/api/plugins/grafana-piechart-panel/versions/1.5.0/downloadinto: /var/lib/grafana/plugins✔ Installed grafana-piechart-panel successfullyRestart grafana after installing plugins . <service grafana-server restart># 也可以下载离线包进行安装# 重建pod生效$ kubectl -n monitor delete po grafana-594f447d6c-jmjsw
登录grafana界面,Configuration -> Plugins 中找到安装的插件,点击插件进入插件详情页面,点击 [Enable]按钮启用插件,点击 Set up your first k8s-cluster 创建一个新的 Kubernetes 集群:
- Name:luffy-k8s
- URL:https://kubernetes.default:443
- Access:使用默认的Server(default)
- Skip TLS Verify:勾选,跳过证书合法性校验
Auth:勾选TLS Client Auth以及With CA Cert,勾选后会下面有三块证书内容需要填写,内容均来自~/.kube/config文件,需要对文件中的内容做一次base64 解码
- CA Cert:使用config文件中的certificate-authority-data对应的内容
- Client Cert:使用config文件中的client-certificate-data对应的内容
- Client Key:使用config文件中的client-key-data对应的内容
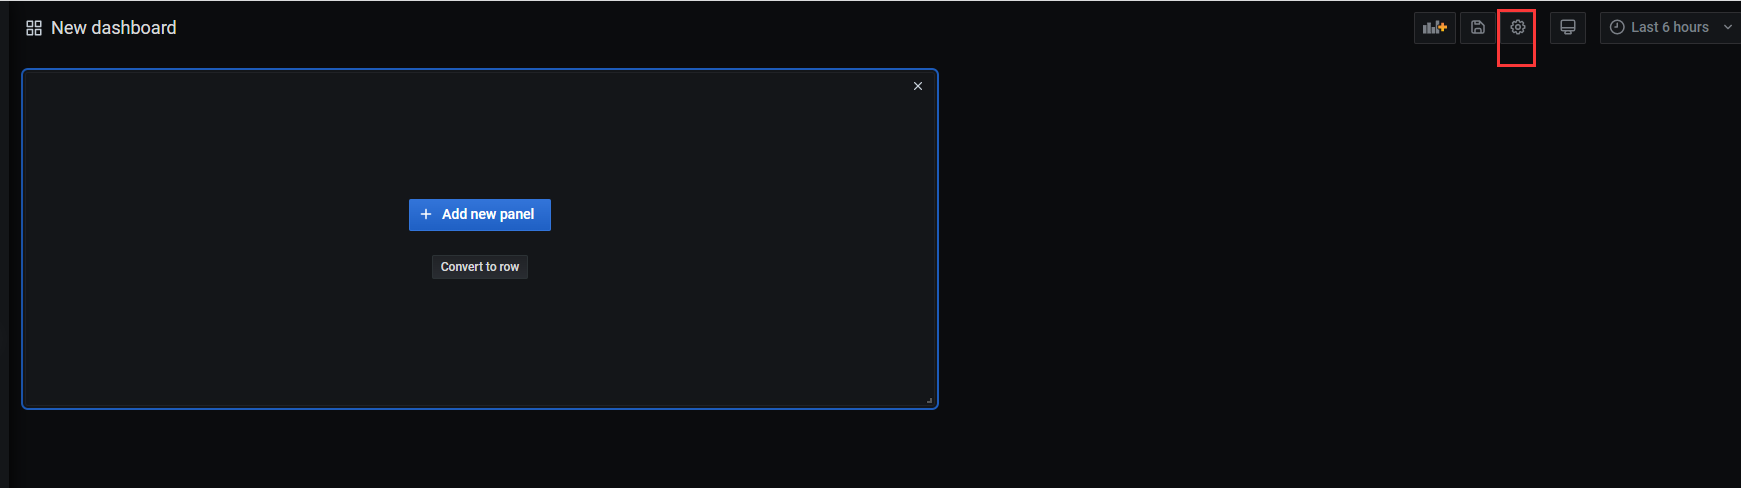
自定义监控面板
通用的监控需求基本上都可以使用第三方的Dashboard来解决,对于业务应用自己实现的指标的监控面板,则需要我们手动进行创建。
调试Panel:直接输入Metrics,查询数据。
如,输入node_load1来查看集群节点最近1分钟的平均负载,直接保存即可生成一个panel
如何根据字段过滤,实现联动效果?
比如想实现根据集群节点名称进行过滤,可以通过如下方式:
设置 -> Variables -> Add Variable,添加一个变量node,
- Name:node
- Label:选择节点
- Data Source:Prometheus
- Query:kube_node_info,可以在页面下方的Preview of values查看到当前变量的可选值
- Regex:/.node=\”(.+?)\”./
- Refresh:On Dashboard Load
- Multi-value:true
- Include All Options:true


修改Metrics,$namespace和变量名字保持一致,意思为自动读取当前设置的节点的名字
再添加一个面板,使用如下的表达式:
container_memory_rss{namespace=$namespace,pod=$pod}

若有收获,就点个赞吧
0 人点赞
