已安装python
pip install numpy scipy matplotlib ipython scikit-learn pandas -i https://pypi.tuna.tsinghua.edu.cn/simple
1.scikit-learn 项目正在不断地开发和改进中,它的用户社区非常活 跃。它包含许多目前最先进的机器学习算法,每个算法都有详细的文档(http://scikit-learn. org/stable/documentation)。scikit-learn 是一个非常流行的工具,也是最有名的 Python 机 器学习库。(scikit-learn 是基于 NumPy 和 SciPy 科学计算库的。)
2.scikit-learn 依赖于另外两个 Python 包:NumPy 和 SciPy。若想绘图和进行交互式开发, 还应该安装 matplotlib、IPython 和 Jupyter Notebook。
3.Jupyter Notebook 是可以在浏览器中运行代码的交互环境。这个工具在探索性数据分析方面 非常有用,在数据科学家中广为使用。虽然 Jupyter Notebook 支持多种编程语言,但我们 只需要支持 Python 即可。用 Jupyter Notebook 整合代码、文本和图像非常方便,实际上本 书所有内容都是以 Jupyter Notebook 的形式进行编写的。
所有代码示例都可以在 GitHub 下 载(https://github.com/amueller/introduction_to_ml_with_python)
#sklearn(第三方模块)
Iris_dataset(鸢尾花数据集)
In [1]: from sklearn.datasets import load_iris...: iris_dataset = load_iris() #返回iris对象,类似字典In [2]: print("Keys of iris_dataset: \n{}".format(iris_dataset.keys()))Keys of iris_dataset:dict_keys(['data', 'target', 'frame', 'target_names', 'DESCR', 'feature_names', 'filename'])In [3]: print(iris_dataset['target_names'])['setosa' 'versicolor' 'virginica']In [7]: print(iris_dataset['data'][:2])[[5.1 3.5 1.4 0.2][4.9 3. 1.4 0.2]]#data是原有的花的特征数据[花萼宽,花瓣宽,花萼长,花瓣宽],target_name是三种花中的种类
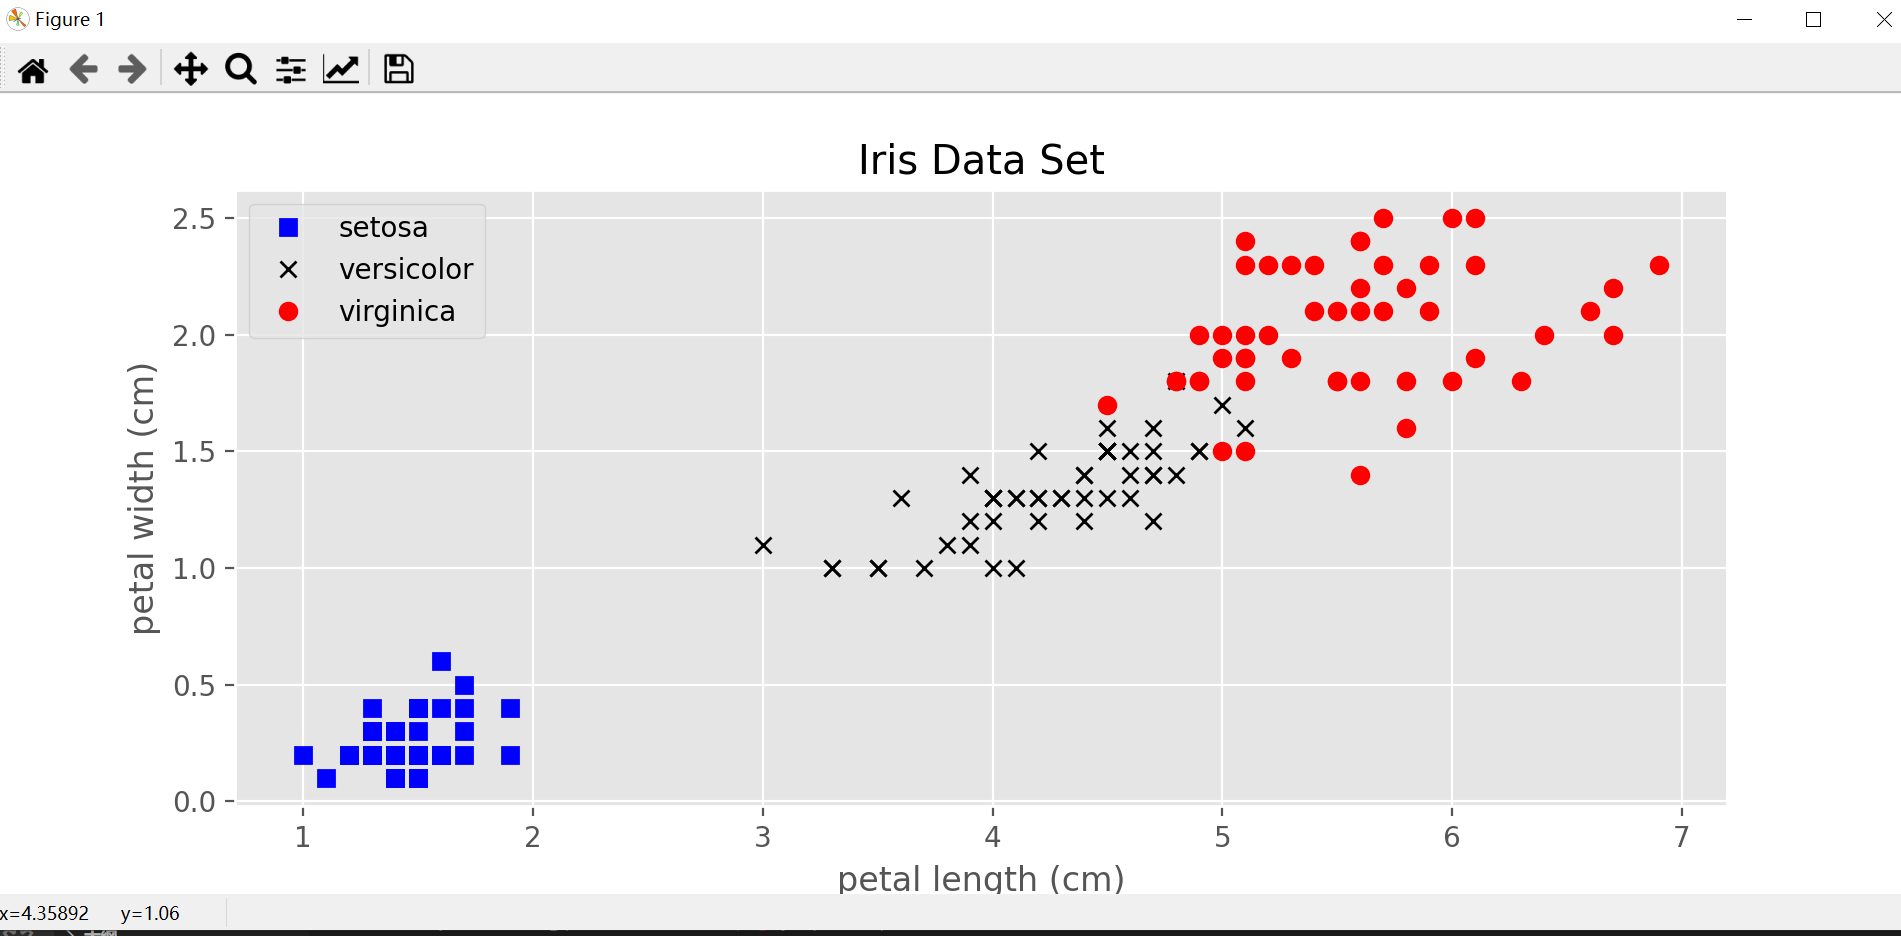
In [12]: from sklearn.datasets import load_iris...: data = load_iris()In [13]: import matplotlib.pyplot as plt...: plt.style.use('ggplot')...:...:...: X = data.data # 只包括样本的特征,150x4...: y = data.target # 样本的类型,[0, 1, 2]...: features = data.feature_names # 4个特征的名称...: targets = data.target_names # 3类鸢尾花的名称,跟y中的3个数字对应...:...: plt.figure(figsize=(10, 4))...: plt.plot(X[:, 2][y==0], X[:, 3][y==0], 'bs', label=targets[0])...: plt.plot(X[:, 2][y==1], X[:, 3][y==1], 'kx', label=targets[1])...: plt.plot(X[:, 2][y==2], X[:, 3][y==2], 'ro', label=targets[2])...: plt.xlabel(features[2])...: plt.ylabel(features[3])...: plt.title('Iris Data Set')...: plt.legend()...: plt.savefig('Iris Data Set.png', dpi=200)...: plt.show()
from sklearn.datasets import load_irisimport matplotlib.pyplot as pltdata = load_iris()plt.style.use('ggplot')X = data.data # 只包括样本的特征,150x4y = data.target # 样本的类型,[0, 1, 2]features = data.feature_names # 4个特征的名称targets = data.target_names # 3类鸢尾花的名称,跟y中的3个数字对应plt.figure(figsize=(10, 4))plt.plot(X[:, 2][y==0], X[:, 3][y==0], 'bs', label=targets[0])plt.plot(X[:, 2][y==1], X[:, 3][y==1], 'kx', label=targets[1])plt.plot(X[:, 2][y==2], X[:, 3][y==2], 'ro', label=targets[2])plt.xlabel(features[2])plt.ylabel(features[3])plt.title('Iris Data Set')plt.legend()plt.savefig('Iris Data Set.png', dpi=200)plt.show()

若有收获,就点个赞吧
0 人点赞
