一、监控
1. provider工程添加依赖
<dependency><groupId>org.springframework.boot</groupId><artifactId>spring-boot-starter-actuator</artifactId></dependency>
2. 配置provider的application.yaml
management:
  endpoints:
    web:
      exposure:
        include: hystrix.stream
3. 创建一个maven项目
por07_spring_cloud_dashboard
1) 加上parent父工程
2) 加入依赖
<dependency>
  <groupId>org.springframework.cloud</groupId>
  <artifactId>spring-cloud-starter-openfeign</artifactId>
</dependency>
4.主启动类上添加@EnableHystrixDashboard
/**
 * @date: 2021/3/5   23:39
 * @author: 易学习
 * @EnableHystrixDashboard: 启用仪表盘监控的功能
 */
@EnableHystrixDashboard
@SpringBootApplication
public class ApplicationDashboard {
    public static void main(String[] args) {
        SpringApplication.run(ApplicationDashboard.class);
    }
}
5. application.yaml 配置
server:
  port: 8000
spring:
  application:
    name: dashboard
二、 查看监控数据
直接查看监控数据本身
- http://localhost:1000/actuator/hystrix.stream
- 说明1: http://localhost:1000 访问的是被监控的 provider 工程
- 说明2: /actuator/hystrix.stream 是固定格式
- 说明3: 如果从 provider 启动开始它的方法没有被访问过,那么显示的数 据只有“ping:”,要实际访问一个带熔断功能的方法才会有实际数据。
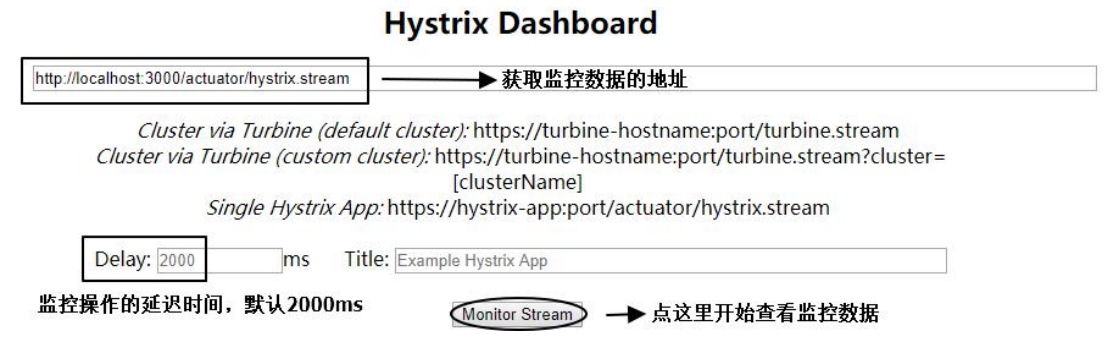
通过仪表盘工程访问监控数据
- 第一步:打开仪表盘工程的首页
- http://localhost:8000/hystrix
- 第二步:填入获取监控数据的地址(上面直接查看时使用的地址)

若有收获,就点个赞吧
0 人点赞
