使用背景
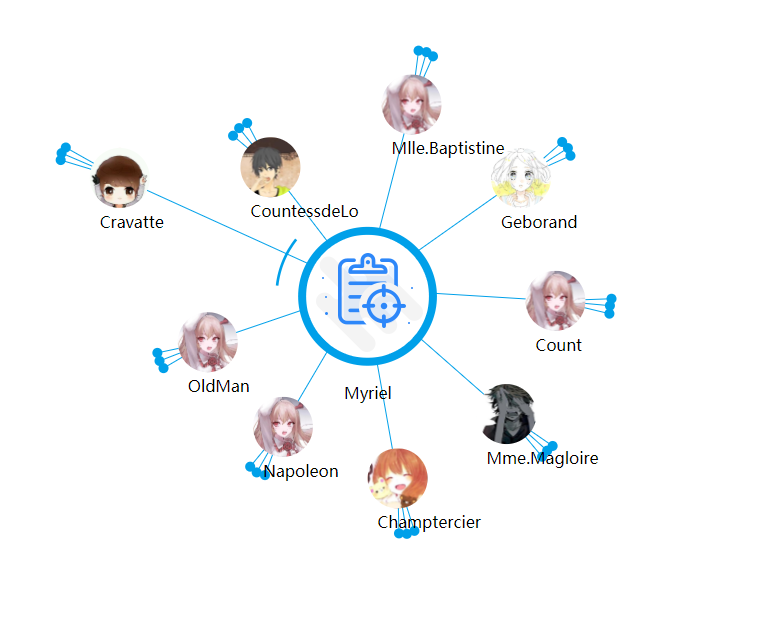
说到前端数据可视化,就不得不提到鼎鼎大名的 d3.js。之前因为公司一直都在用 echarts,所以对 d3 了解的不多。幸好前几个星期有个项目要实现一个人物关系的力导向图,并且人物图片要实现圆形。经过在网上查找资料后发现echarts 并没有这样的功能,所以就想到了用 d3 来实现,下面说说大体的实现思路:
(最终实现效果)
构建力导向图
var width = 1170,height = 800;var imgSize = 60;var svg = d3.select("body").append("svg").attr("width", width).attr("height", height);var simulation = d3.forceSimulation().alpha(0.2).force("link",d3.forceLink().id(function(d) {return d.id;})).force("charge",d3.forceManyBody().distanceMin(200).strength(-250)).force("center", d3.forceCenter(width / 2, height / 2))
首先我们去生成一个 svg 节点,利用 d3 基本的 api 就可以实现,然后根据官方文档的介绍,我们要生成一个 simulation。我们利用 d3.forceSimulation 这个方法生成了一个力的模型,之后我们可以在这个框架上面添加我们需要的节点和连线。
创建节点
svg.append("defs").selectAll("pattern").data(graph.nodes).enter().append("pattern").attr("patternUnits", "objectBoundingBox").attr("patternContentUnits", "userSpaceOnUse").attr("id", d => d.id).attr("width", 1.0).attr("height", 1.0).append("image").attr("width", d => {if (d.main) {console.log(1);return 178;}return imgSize;}).attr("height", d => {if (d.main) {return 178;}return imgSize;}).attr("xlink:href", d => d.image).attr("x", 0).attr("y", d => {if (d.main) {return 10;}return 0;});
d3 选择器的用法和 jQuery 选择器用法类似。如果没有接触过可以自行查看相关文档,下面说下 d3 中常用的两个方法:enter、exit
enter()
返回数组数据相比对应选中节点多余出的那部分数据,示例如下:
d3.selectAll('line').data(data).append('line').attr('stroke','red')
selectAll 选中当前文档中所有line节点,如果line节点的个数为n,data数组长度为m,则 enter 选中的数据为 n-m 长度的 data 集合,以上代码会将少的那部分 line 节点 append 上去。
exit()
返回选中节点数量比数据长度多出的那部分节点集合
d3.select('text').data(data) //data.length==n.exit().remove()
以上代码执行后会将多余的 text 节点删除
创建连线和文字
创建连线和显示文字和创建节点的逻辑基本一样。
创建连线:
var link = svg.append("g").attr("class", "links").selectAll("line").data(graph.links).enter().append("line").attr("stroke", "#00a0e9");
创建文字:
var linkText = svg.append("g").selectAll("circle").enter().append("text").text(d => d.id);
连接节点和连线
simulation.nodes(graph.nodes).on("tick", ticked).force("link").links(graph.links);
在节点和连线都准备好的前提下我们可以将节点和连线关联起来,用 simulation.nodes 和simulation.force(“link”).links() 方法。
在这里要提下 tick 事件,节点和连线每次更新都会触发tick事件,因此我们要给 tick 事件增加回调函数,来更新节点和连线还有文字的位置。
下面是 ticked 代码:
function ticked() {node.attr("cx", d => {if (d.main) {return width / 2;} else if (d.x <= imgSize) {return imgSize;} else if (d.x >= width - imgSize) {return width - imgSize;}return d.x;}).attr("cy", d => {if (d.main) {return height / 2;} else if (d.y <= imgSize) {return imgSize;} else if (d.y >= height) {return height - imgSize;}return d.y;});link.attr("x1", d => {if (d.source.main) {return width / 2;}return d.source.x;}).attr("y1", d => {if (d.source.main) {return height / 2;}return d.source.y;}).attr("x2", d => {if (d.target.x <= imgSize) {return imgSize;} else if (d.target.x >= width - imgSize) {return width - imgSize;}return d.target.x;}).attr("y2", d => {if (d.target.y <= imgSize) {return imgSize;} else if (d.target.y >= height - imgSize) {return height - imgSize;}return d.target.y;});linkText.attr("x", d => {if (d.main) {return width / 2 - 20;} else if (d.x <= imgSize) {return imgSize - 20;} else if (d.x >= width - imgSize) {return width - imgSize - 20;}return d.x-20;}).attr("y", d => {if (d.main) {return height / 2 + 110;} else if (d.y <= imgSize) {return imgSize + 50;} else if (d.y >= height) {return height - imgSize +50;}return d.y+50;});}
这里我检测了下边界值,为了不让节点和连线超出边界,但是现在用这样的方法重置节点和连线的位置在拖拽的时候会非常生硬,在广泛查了资料后还是没有找到比较好的解决方法,希望有办法的同学告知~:)
实现拖拽
实现拖拽需要调用 d3.drag,这里采用 call 方法调用 drag 方法
nodes.call(d3.drag().on("start",dragstarted).on("drag",dragged).on("end",dragended))function dragstarted(d) {if (!d3.event.active) simulation.alphaTarget(0.3).restart();d.fx = d.x;d.fy = d.y;}function dragged(d) {d.fx = d3.event.x;d.fy = d3.event.y;}function dragended(d) {if (!d3.event.active) simulation.alphaTarget(0);d.fx = null;d.fy = null;}
这里绑定了拖拽的三个时间,分别是开始,拖拽中和拖拽结束。在三个事件回调中去更新节点位置。
圆形图片实现
由于初始状态下 nodes 采用的并不是圆形图片,要实现圆形图片需要借助于 svg 中 circle 和 pattern 标签。关于这方面我是参考的这篇文章来做的 svg圆角。
首先对于每一个 node 节点对应生成 pattern 标签,用 g 标签做分组
const timestamp = Date.now()svg.append("defs").data(data.graph).append("pattern").attr("patternUnits","objectBoundingBox").attr("patternContentUnits","userSpaceOnUse").attr("id",d=>d.id+'_'+ timestamp).append("image").attr("xlink:href",d=>d.imageUrl)nodes.selectAll("circle").data(data.graph).append("circle").attr("fill",d=>`url(#${d.id}_${timestamp})`)
这里先缓存一个一个当前时间戳变量,方便后面为 pattern 标签生成唯一的 id ,然后在 svg 中添加一个 defs 标签,defs 标签用法可以参考相关资料,在这里就不多说啦。然后在 defs 中添加多个 pattern ,为每一个 pattern 生成唯一的 id ,方便后面 circle 标签引用。由于需求中提到主节点和其他分支节点的大小不一样,所以我在这里设置为 pattern 设置了 patternUnits 属性,这个属性可以方便用户定义 pattern 大小。
patternUnits
- objectBoundingBox:设置 pattern 大小为相对值,设置范围是0~1
userSpaceOnUser: 设置 pattern 大小为绝对值
patternContentUnits
objectBoundingBox:设置 pattern 中内容大小为相对值,设置范围是0~1
- userSpaceOnUser: 设置 pattern 中内容大小为绝对值
相关资料可以参考 w3cplus 上面相关文章:
https://www.w3cplus.com/svg/svg-pattern-element.html
该效果的主体 内容就这么多,至于图片后面蓝色小点纯粹是为了装饰用,在实际中没有意义。相关实现思路为在每个图片节点后面添加三个小节点数据,然后加上对应的标志,在更新位置与设置样式的时候与其他节点区别对待。
function setEmptyNodes(data, num) {data.nodes.forEach(item => {if (!item.main) {for (let i = 0; i < num; i++) {data.nodes.push({id: `${item.id}_empty_${i}`,name: ``,empty: true,parentNode: item.id});data.links.push({source: item.id,target: `${item.id}_empty_${i}`});}}});console.log(data);}
如此,一个简单的力导向图就大功告成啦。
总结
d3 不愧是前端数据可视化最流行的框架,用了一次就感受到了它无比强大。想比 echarts 来说,d3 更灵活,可以实现更加丰富的效果。最后附上 d3 的官网地址 https://d3js.org/。希望还没有使用过 d3 的小伙伴们可以在今后的工作过程中运用。

