调试是解决程序问题的必备工具,在最早的时候 Node 的调试有些麻烦,社区也有不少工具包辅助,现在 Node 的调试已经比较简单,常用的有几种
Chrome DevTools
Chrome 开发者工具交互通过 V8 Inspector Protoco 调试协议,使用 websocket 和 开发工具交互,提供了图形化的调试界面,操作非常简单
#1 命令行 —inspect-brk
使用命令行 node --inspect-brk YOUR_FILE_PATH.js 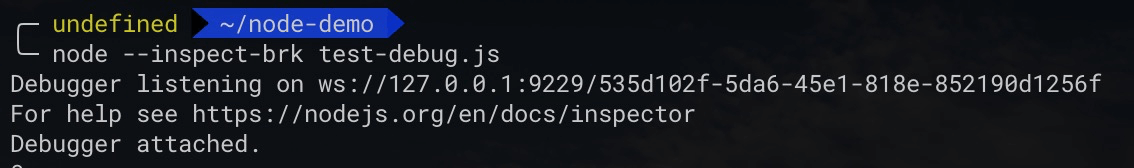
#2 浏览器 inspect 界面
使用 Chrome 打开地址 chrome://inspect ,点击 Remote Target 中调试的文件名 “inspect” 按钮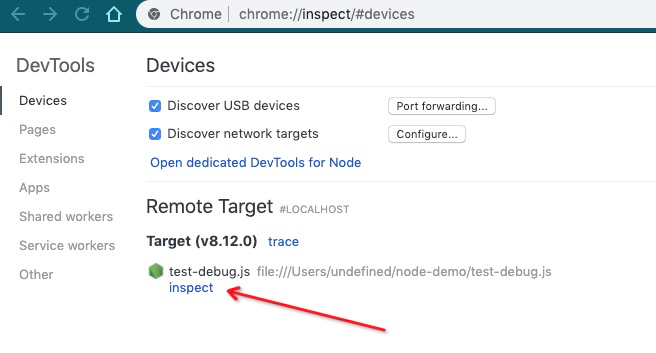
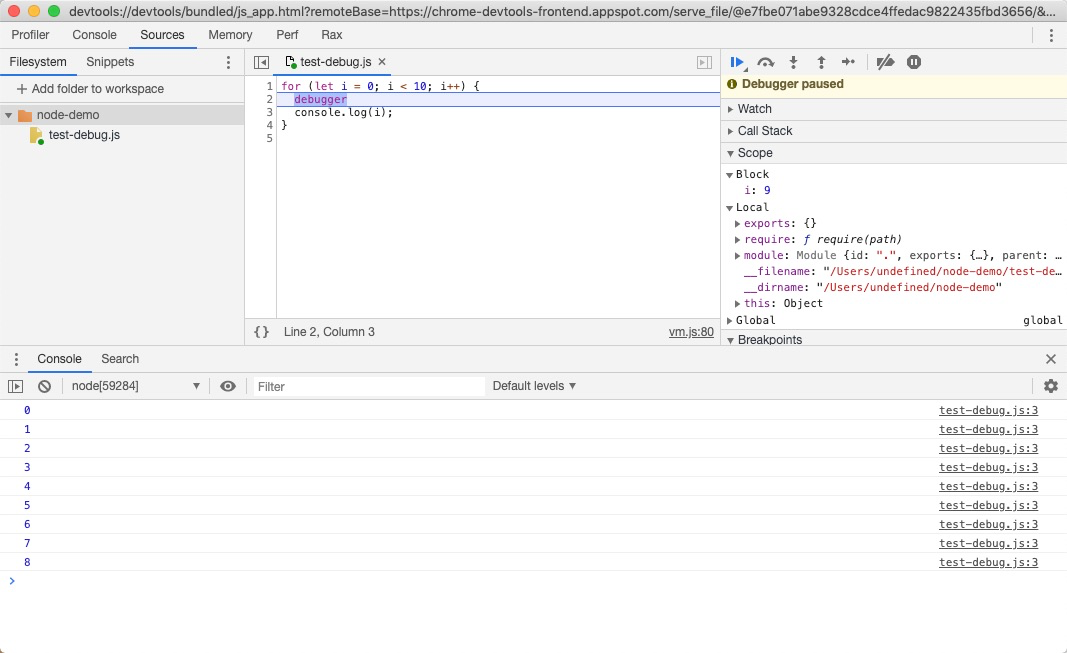
#3 进入 Chrome 调试界面
—inspect-brk 会让用户代码第一行执行前停住,防止没来及 debug 代码就执行结束了,Web 服务脚本会一直在后台运行,使用 —inspect 即可
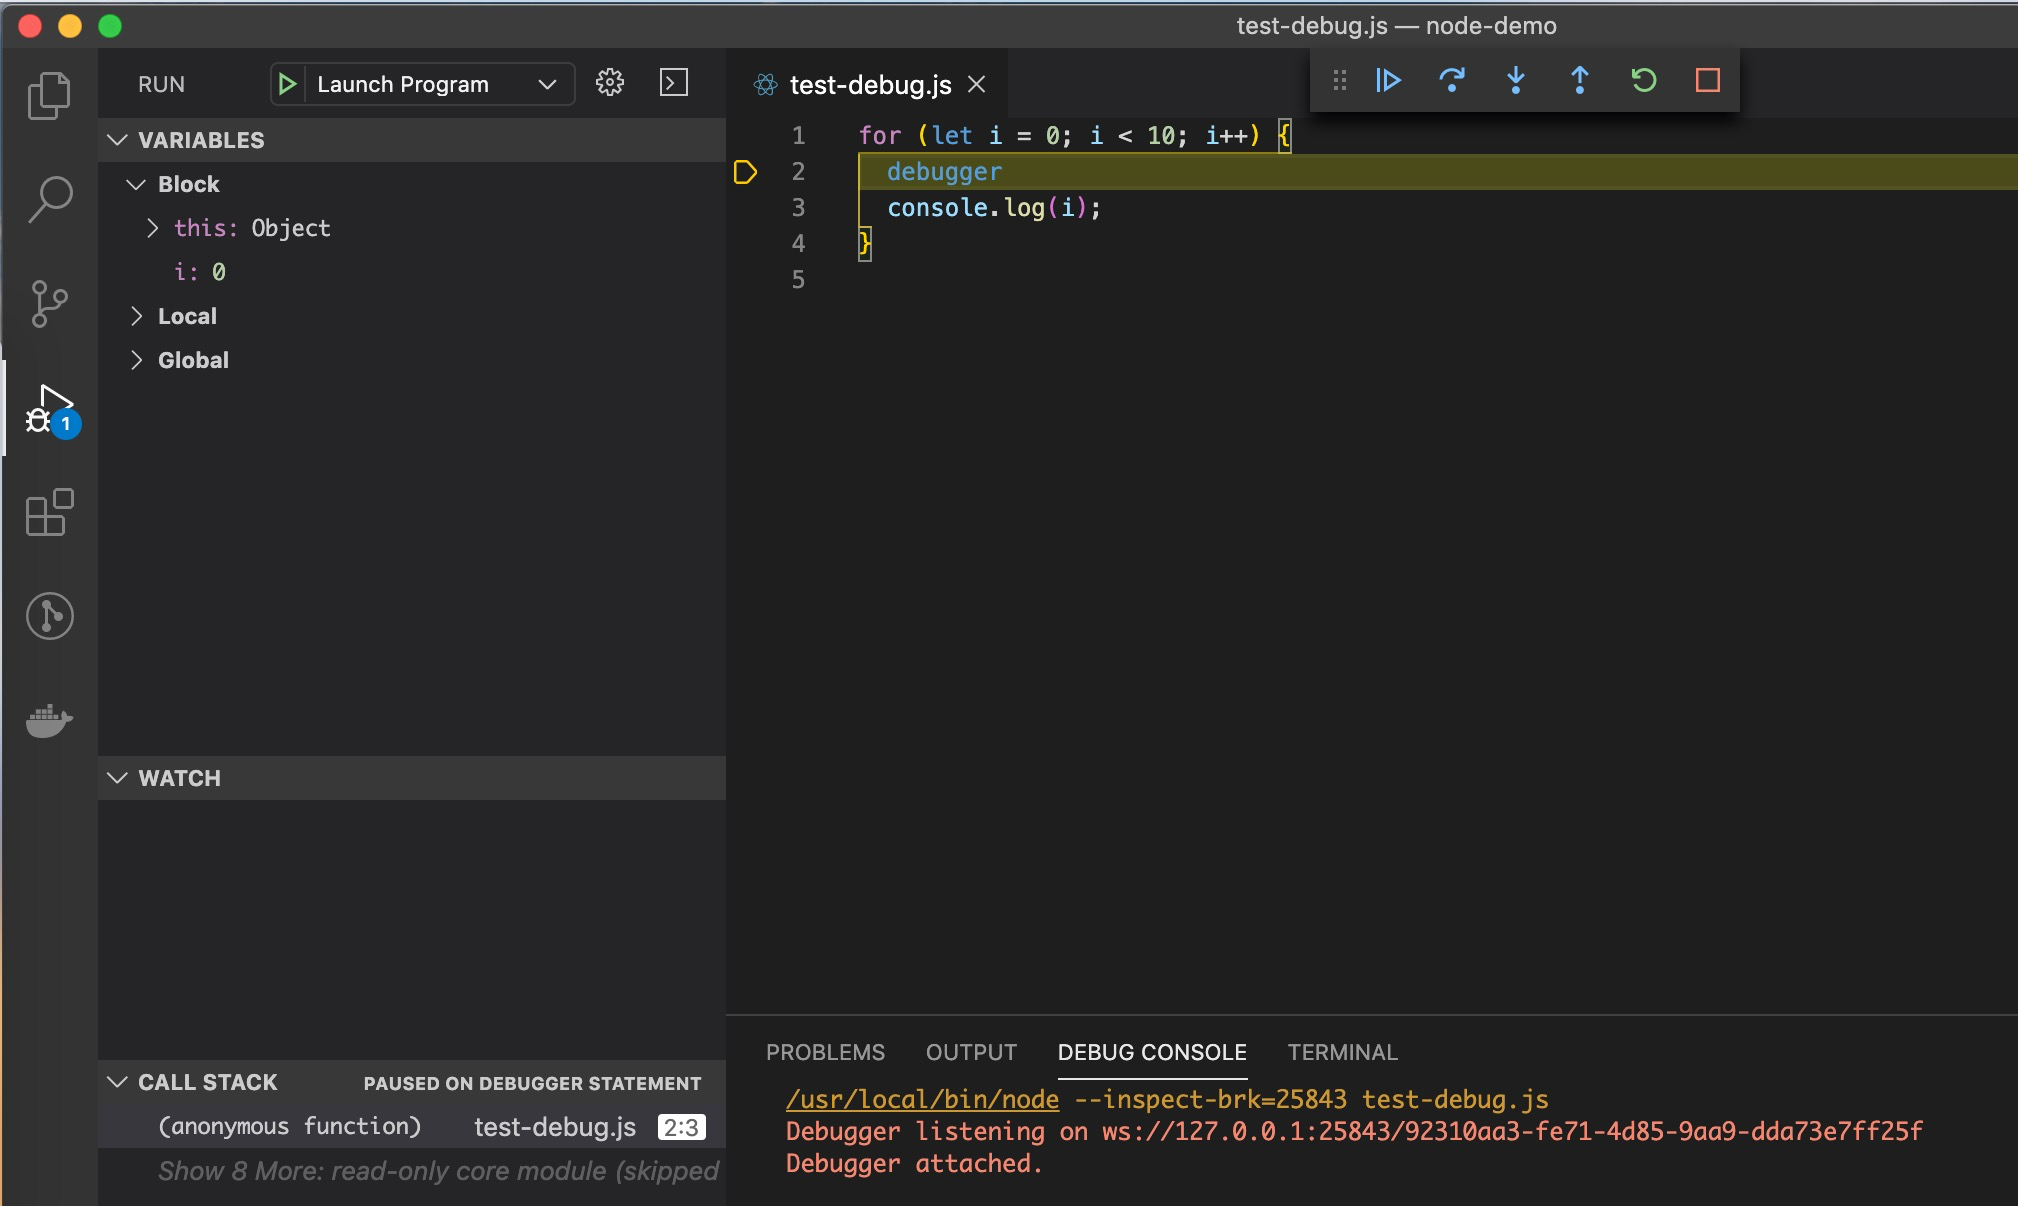
VS Code
上面的操作步骤还是稍微有些麻烦,大部分 IDE 都给封装了调试界面,可以真正做到一键调试,VS Code 几乎是前端的事实标准 IDE,简单介绍一下其调试方法
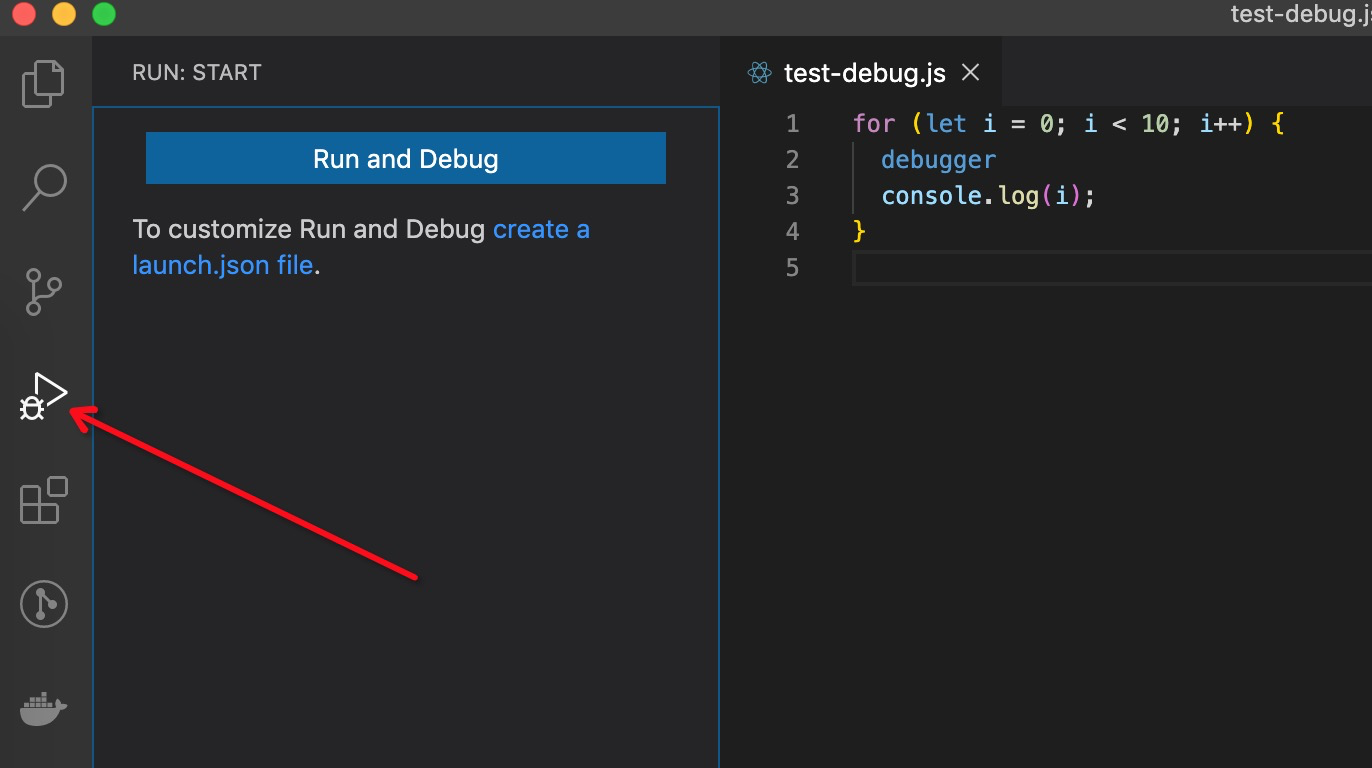
#1 点击调试按钮
#2 创建 launch.json
第一次调试需要创建一个 launch.json 文件,点击后会生成默认值
{// Use IntelliSense to learn about possible attributes.// Hover to view descriptions of existing attributes.// For more information, visit: https://go.microsoft.com/fwlink/?linkid=830387"version": "0.2.0","configurations": [{"type": "node","request": "launch","name": "Launch Program","skipFiles": ["<node_internals>/**"],"program": "${file}"}]}
一般需要修改的就是 program ,通过 program 指定调试文件
${file}调试当前文件${workspaceFolder}\\index.js调试项目目录的 index.js 入口文件
#3 点击 “Launch Program”
具体操作、配置参考 Node.js debugging in VS Code

若有收获,就点个赞吧
0 人点赞
