Prometheus
下载地址:https://github.com/prometheus/prometheus/releases
wget https://github.com/prometheus/prometheus/releases/download/v2.32.1/prometheus-2.32.1.linux-amd64.tar.gztar zxvf prometheus-*.linux-amd64.tar.gz -C /usr/localmv /usr/local/prometheus-*.linux-amd64 /usr/local/prometheuscat >/etc/systemd/system/prometheus.service << EOF[Unit]Description=PrometheusDocumentation=https://prometheus.io/After=network.target[Service]Type=simple # Type设置为notify时,服务会不断重启User=prometheus# --storage.tsdb.path是可选项,默认数据目录在运行目录的./dada目录中ExecStart=/usr/local/prometheus/prometheus --config.file=/usr/local/prometheus/prometheus.yml \--storage.tsdb.path=/home/data/prometheusRestart=on-failure[Install]WantedBy=multi-user.targetEOFgroupadd prometheususeradd -g prometheus -m -d /var/lib/prometheus -s /sbin/nologin prometheusmkdir /home/data/prometheus -p # 数据盘chown prometheus.prometheus -R /usr/local/prometheus /home/data/prometheussystemctl start prometheus && systemctl enable prometheussystemctl status prometheus
基础配置
# 全局配置global:scrape_interval: 15s # 设置抓取间隔,默认为1分钟evaluation_interval: 15s # 估算规则的默认周期,每15秒计算一次规则。默认1分钟scrape_timeout # 默认抓取超时,默认为10s
- job_name: 'linux'static_configs:- targets: ['192.168.0.119:9100']
重载配置
kill -1 `pgrep prometheus`curl -XPOST http://127.0.0.1:9090/-/reload# prometheus.service 添加--web.enable-lifecycle
node-exporter
下载地址: https://github.com/prometheus/node_exporter/releases
用于机器系统数据收集,监控服务器CPU、内存、磁盘、I/O等信息。
二进制安装
wget https://github.com/prometheus/node_exporter/releases/download/v1.3.1/node_exporter-1.3.1.linux-amd64.tar.gztar zxvf node_exporter-*.linux-amd64.tar.gzmv node_exporter-*.linux-amd64/node_exporter /usr/local/bin/cat > /etc/systemd/system/node_exporter.service << EOF[Unit]Description=node_exporterDocumentation=https://prometheus.io/After=network.target[Service]Type=simpleUser=prometheusExecStart=/usr/local/bin/node_exporterRestart=on-failure[Install]WantedBy=multi-user.targetEOFgroupadd prometheususeradd -g prometheus -m -d /var/lib/prometheus -s /sbin/nologin prometheussystemctl start node_exporter && systemctl enable node_exporter
docker启动
docker run -d -p 9100:9100 \-v "/proc:/host/proc:ro" \-v "/sys:/host/sys:ro" \-v "/:/rootfs:ro" \--net="host" \prom/node-exporter
metrics采集接口
Node Exporter默认的抓取地址为http://IP:9100/metrics
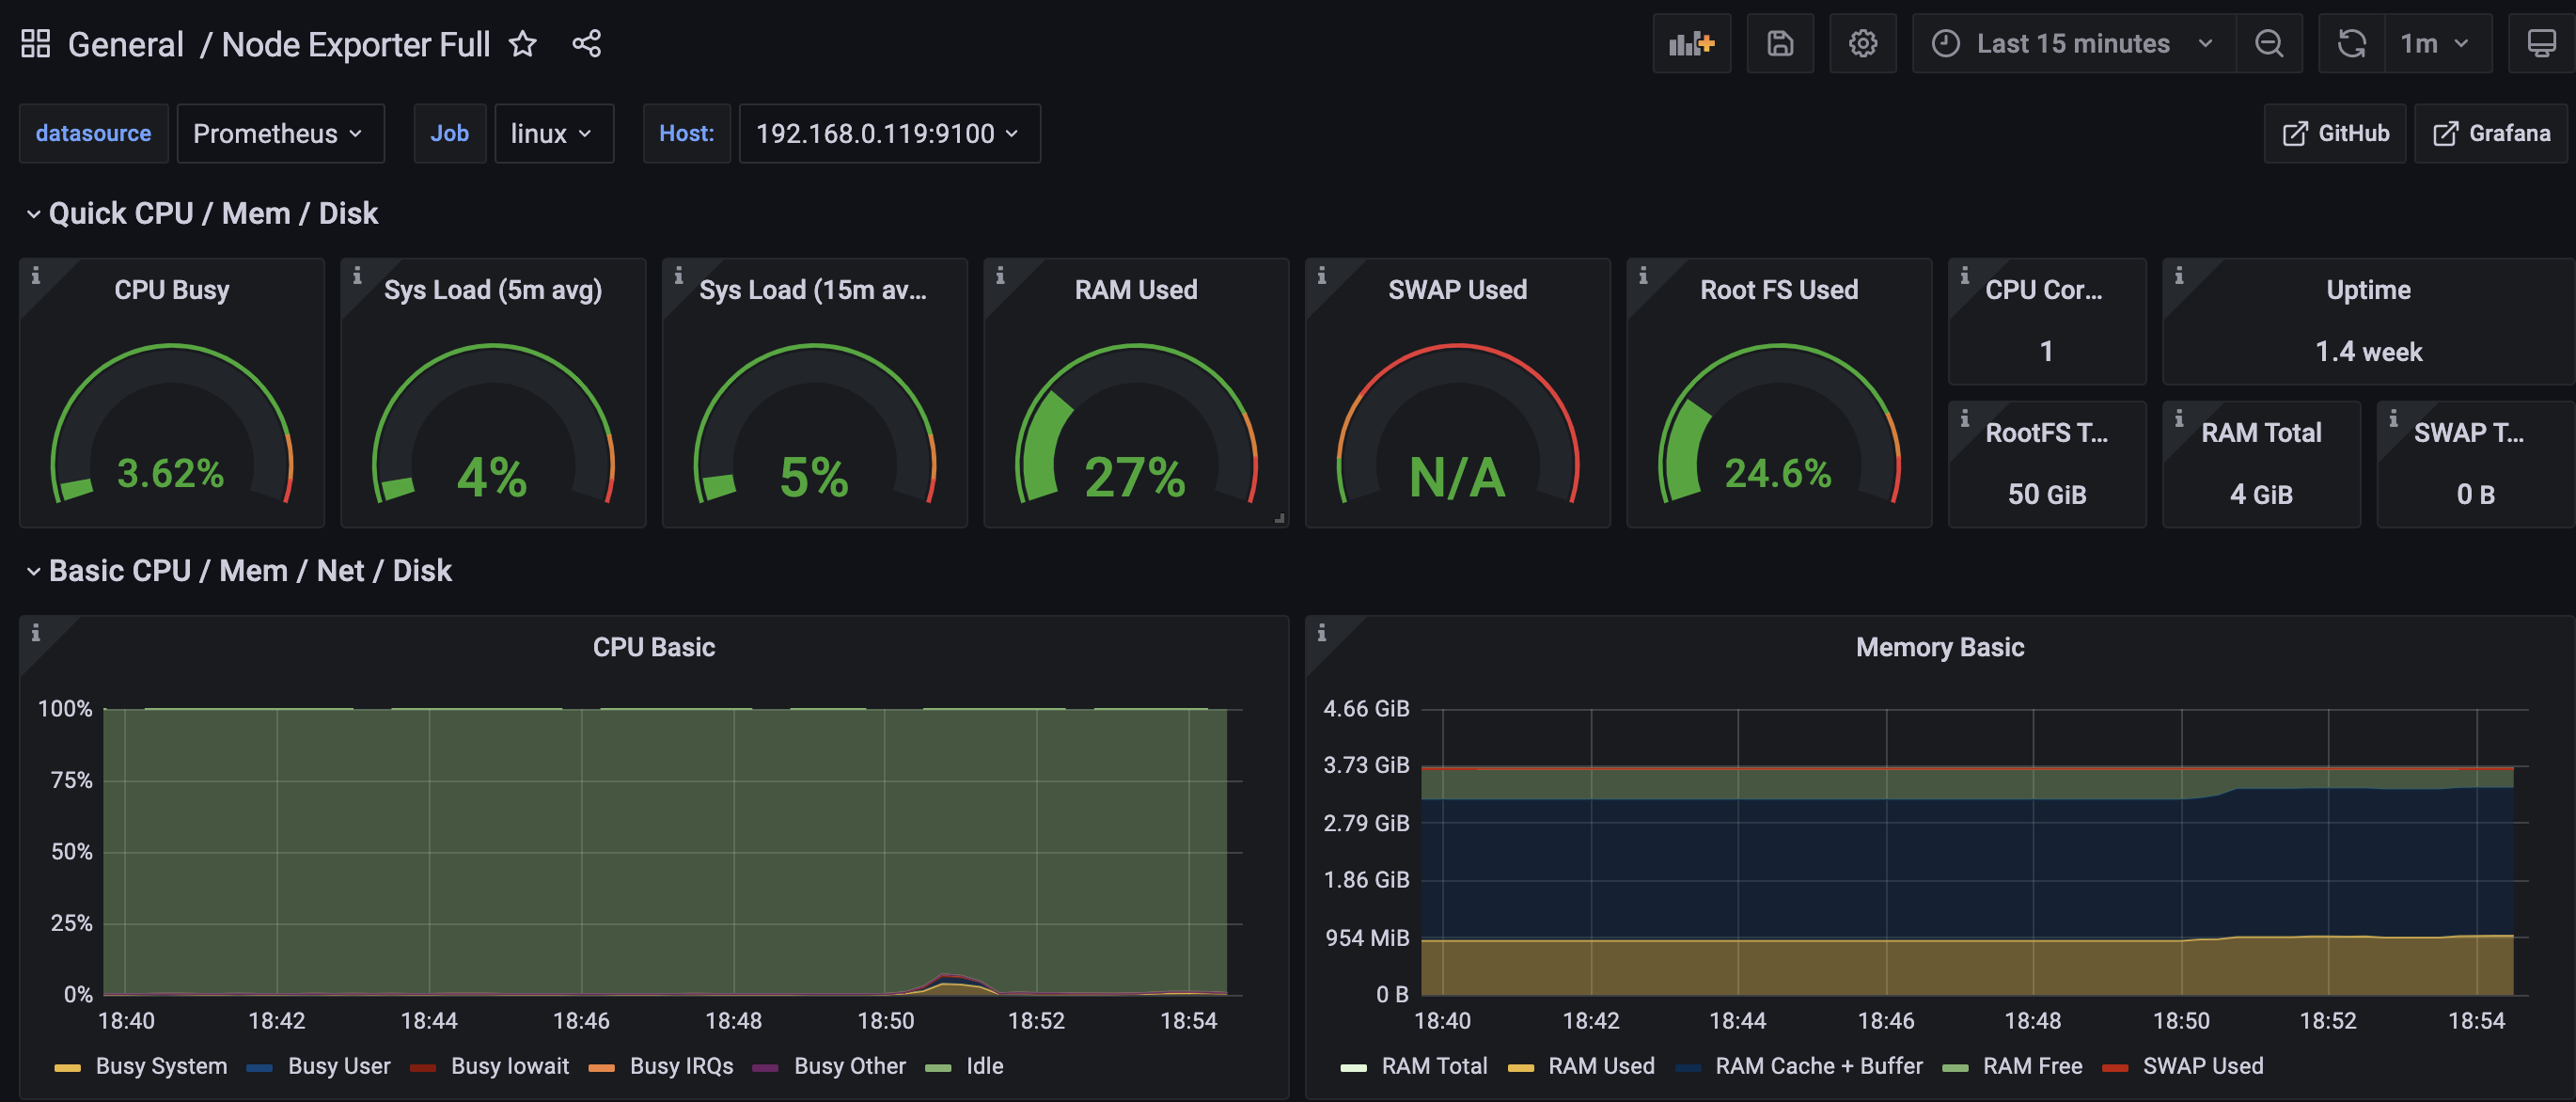
grafana大屏
https://grafana.com/grafana/dashboards/
告警规则
https://awesome-prometheus-alerts.grep.to
https://www.cnblogs.com/heian99/p/15257897.html
consul服务发现
docker run --name consul -d -p 8500:8500 consul
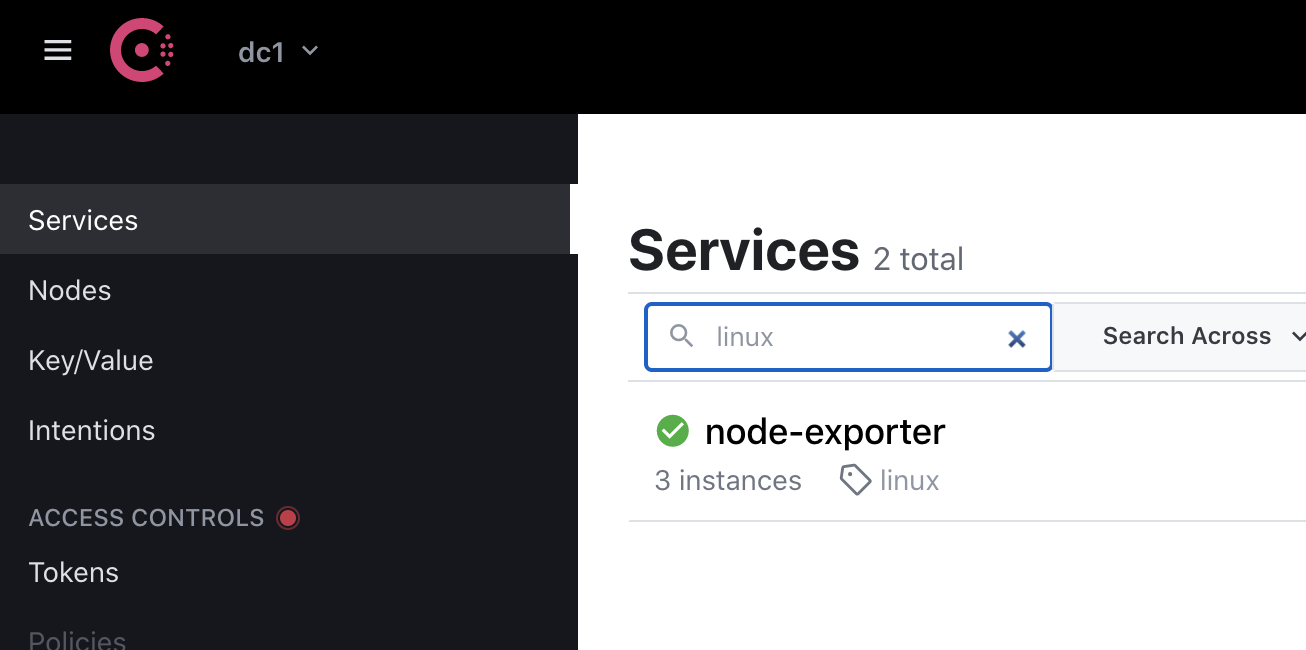
注册实例到consul
curl -X PUT -d '{"id": "host-121","name": "node-exporter","address": "192.168.0.120","port": 9100,"tags": ["linux"],"meta": {"group": "kong","environment": "Pro","project": "API_Platform"},"checks": [ {"http": "http://192.168.0.120:9100/metrics","interval": "5s"}]}' \http://127.0.0.1:8500/v1/agent/service/register
释放consul注册
curl -X PUT http://127.0.0.1:8500/v1/agent/service/deregister/id名称
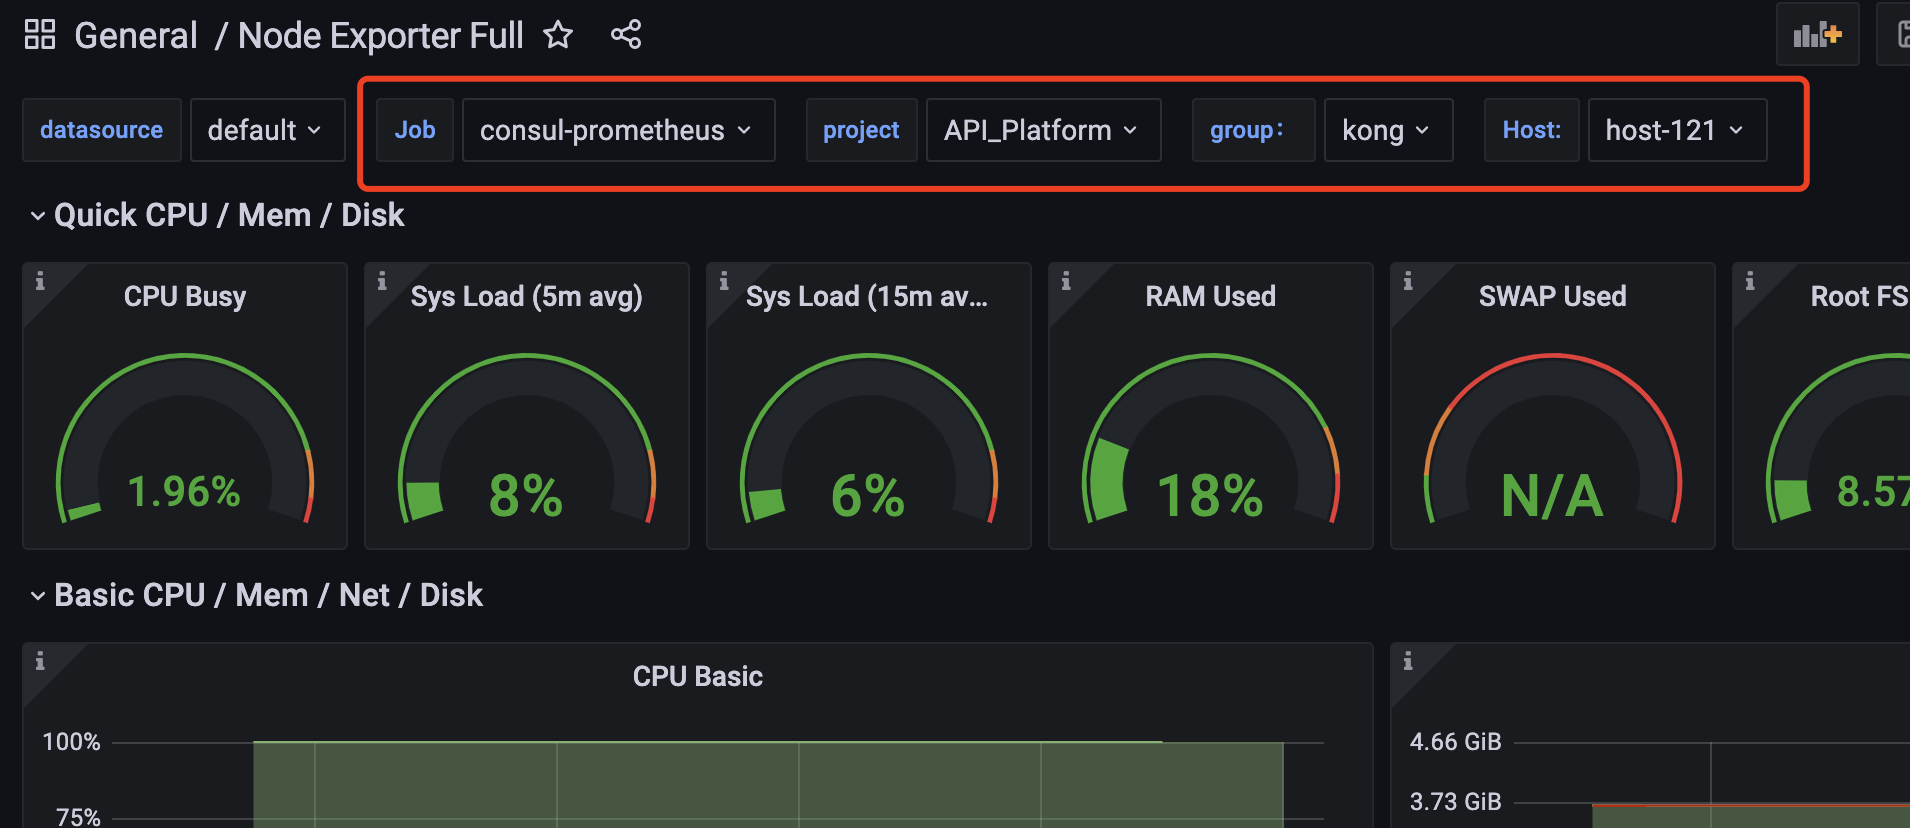
prometheus配置
scrape_configs:# The job name is added as a label `job=<job_name>` to any timeseries scraped from this config.- job_name: 'consul-prometheus'consul_sd_configs: # 配置基于consul的服务发现- server: 192.168.0.119:8500 # consul地址#token: 8dc1eb67-1f5f-4e10-ad9d-5e58b047647c # 自定义的tokenrefresh_interval: 10s # 刷新间隔services: ['node-exporter']relabel_configs: # 对默认的Metadata进行自定义Relabeling- source_labels: [__meta_consul_service_address]target_label: 'ipaddress'- source_labels: [__meta_consul_service_id]target_label: 'instance'- source_labels: [__meta_consul_service_metadata_group]target_label: 'group'- source_labels: [__meta_consul_service_metadata_environment]target_label: 'environment'- source_labels: [__meta_consul_service_metadata_project]target_label: 'project'- source_labels: [__meta_consul_service]target_label: 'service'
效果

若有收获,就点个赞吧
0 人点赞
