1、prometheus服务
prometheus流程图
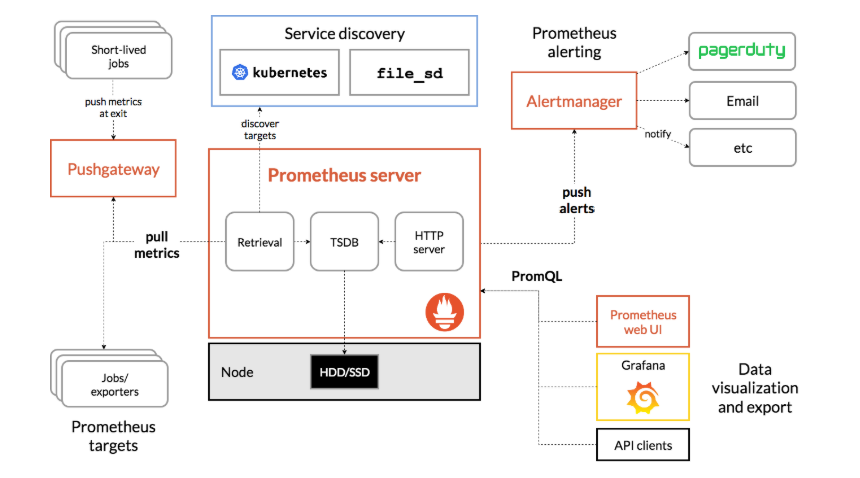
- 多维度数据模型(时序列数据又metrics名和一组key/value组成)
- 灵活的查询语言PromQL
- 不依赖分布式存储,单节点工作
- 通过基于HTTP的pull方式采集数据
- 还可以通过push gateway进行时序列数据推送(pushing)
- 支持grafana多图标展示
- prometheus通过安装在远程机器上的export来监控数据
1.1下载镜像
#下载镜像docker pull prom/prometheus:v2.11.0
1.2编辑配置文件
#创建文件夹mkdir /etc/prometheus#编辑/etc/prometheus/prometheus.yml文件# my global configglobal:scrape_interval: 15s # Set the scrape interval to every 15 seconds. Default is every 1 minute. 设置抓取间隔,默认为1分钟evaluation_interval: 15s # Evaluate rules every 15 seconds. The default is every 1 minute. 估算规则的默认周期,每15秒计算一次规则。默认1分钟# scrape_timeout is set to the global default (10s). 默认抓取超时,默认为10s# Alertmanager configuration Alertmanager相关配置# alerting:# alertmanagers:# - static_configs:# - targets:# # - alertmanager:9093# Load rules once and periodically evaluate them according to the global 'evaluation_interval'. 规则文件列表,使用'evaluation_interval' 参数去抓取rule_files:- "/etc/prometheus/*.rules"# - "second_rules.yml"# A scrape configuration containing exactly one endpoint to scrape:# Here it's Prometheus itself. 抓取配置列表scrape_configs:# The job name is added as a label `job=<job_name>` to any timeseries scraped from this config.- job_name: 'prometheus'# metrics_path defaults to '/metrics'# scheme defaults to 'http'.static_configs:- targets: ['localhost:9090']- job_name: 'server'static_configs:- targets: ['172.31.243.137:9100']alerting: #告警相关配置alertmanagers:- scheme: http- static_configs:- targets: ["172.31.243.137:9093"]
1.3启动prometheus
#启动容器镜像, 此目录/data/prometheus/为本地存储路径docker run -d -p 9090:9090 -v /etc/prometheus/:/etc/prometheus/ -v /data/prometheus/:/prometheus prom/prometheus:v2.11.0#查看启动端口netstat -nltup | grep 9090tcp6 0 0 :::9090 :::* LISTEN 3737/docker-proxy#查看进程docker ps -a | grep prometheus4af17fb8fe53 prom/prometheus:v2.11.0 "/bin/prometheus -..." About an hour ago Up About an hour 0.0.0.0:9090->9090/tcp kind_leakey
打开ip:9090
3、监控node-export服务
vim node_export.yamlapiVersion: extensions/v1beta1kind: DaemonSetmetadata:name: node-exporternamespace: kube-systemlabels:name: node-exporterspec:template:metadata:labels:name: node-exporterspec:hostPID: truehostIPC: truehostNetwork: truecontainers:- name: node-exporterimage: quay.io/prometheus/node-exporter:v0.18.1ports:- containerPort: 9100resources:requests:cpu: 0.15securityContext:privileged: trueargs:- --path.procfs- /host/proc- --path.sysfs- /host/sys- --collector.filesystem.ignored-mount-points- '"^/(sys|proc|dev|host|etc)($|/)"'volumeMounts:- name: devmountPath: /host/dev- name: procmountPath: /host/proc- name: sysmountPath: /host/sys- name: rootfsmountPath: /rootfstolerations:- key: "node-role.kubernetes.io/master"operator: "Exists"effect: "NoSchedule"volumes:- name: prochostPath:path: /proc- name: devhostPath:path: /dev- name: syshostPath:path: /sys- name: rootfshostPath:path: /#启动kubectl apply -f ./node_export.yaml[root@hf-aipaas-172-31-243-137 home]# netstat -nltup |grep 9100tcp6 0 0 :::9100 :::* LISTEN 17093/node_exporter
2、alertmanager服务
2.1 alertmanager下载
#下载镜像docker pull quay.io/prometheus/alertmanager:v0.20.0
2.2 编辑配置文件
vim /etc/alertmanager/config.yml# 全局配置项global:resolve_timeout: 5m #处理超时时间,默认为5minsmtp_smarthost: 'smtp.sina.com:25' # 邮箱smtp服务器代理smtp_from: '******@sina.com' # 发送邮箱名称smtp_auth_username: '******@sina.com' # 邮箱名称smtp_auth_password: '******' # 邮箱密码或授权码smtp_require_tls: false# 定义模板信息templates:- 'template/*.tmpl'# 定义路由树信息route:group_by: ['alertname'] # 报警分组依据group_wait: 10s # 最初即第一次等待多久时间发送一组警报的通知group_interval: 1m # 在发送新警报前的等待时间repeat_interval: 1m # 发送重复警报的周期 对于email配置中,此项不可以设置过低,否则将会由于邮件发送太多频繁,被smtp服务器拒绝receiver: 'mail-receiver' # 发送警报的接收者的名称,以下receivers name的名称# 定义警报接收者信息receivers:- name: 'mail-receiver' #名字email_configs: #配置- to: 'ycli15@iflytek.com' # 接收警报的email配置html: '{{ template "test.html" . }}' # 设定邮箱的内容模板headers: { Subject: "[WARN] 报警邮件"} # 接收邮件的标题#webhook_configs: # webhook配置#- url: 'http://127.0.0.1:5001'#send_resolved: true# 一个inhibition规则是在与另一组匹配器匹配的警报存在的条件下,使匹配一组匹配器的警报失效的规则。两个警报必须具有一组相同的标签。inhibit_rules:- source_match:severity: 'critical'target_match:severity: 'warning'equal: ['alertname', 'dev', 'instance']#模板vim /etc/alertmanager/template/test.tmpl{{ define "test.html" }}<table border="1"><tr><td>报警项</td><td>实例</td><td>报警阀值</td><td>开始时间</td></tr>{{ range $i, $alert := .Alerts }}<tr><td>{{ index $alert.Labels "alertname" }}</td><td>{{ index $alert.Labels "instance" }}</td><td>{{ index $alert.Annotations "value" }}</td><td>{{ $alert.StartsAt }}</td></tr>{{ end }}</table>{{ end }}
2.3启动alertmanager服务
docker run -d -p 9093:9093 -v /etc/alertmanager/:/etc/alertmanager/ quay.io/prometheus/alertmanager:v0.20.0 --config.file=/etc/alertmanager/config.yml
2.4配置prometheus告警规则
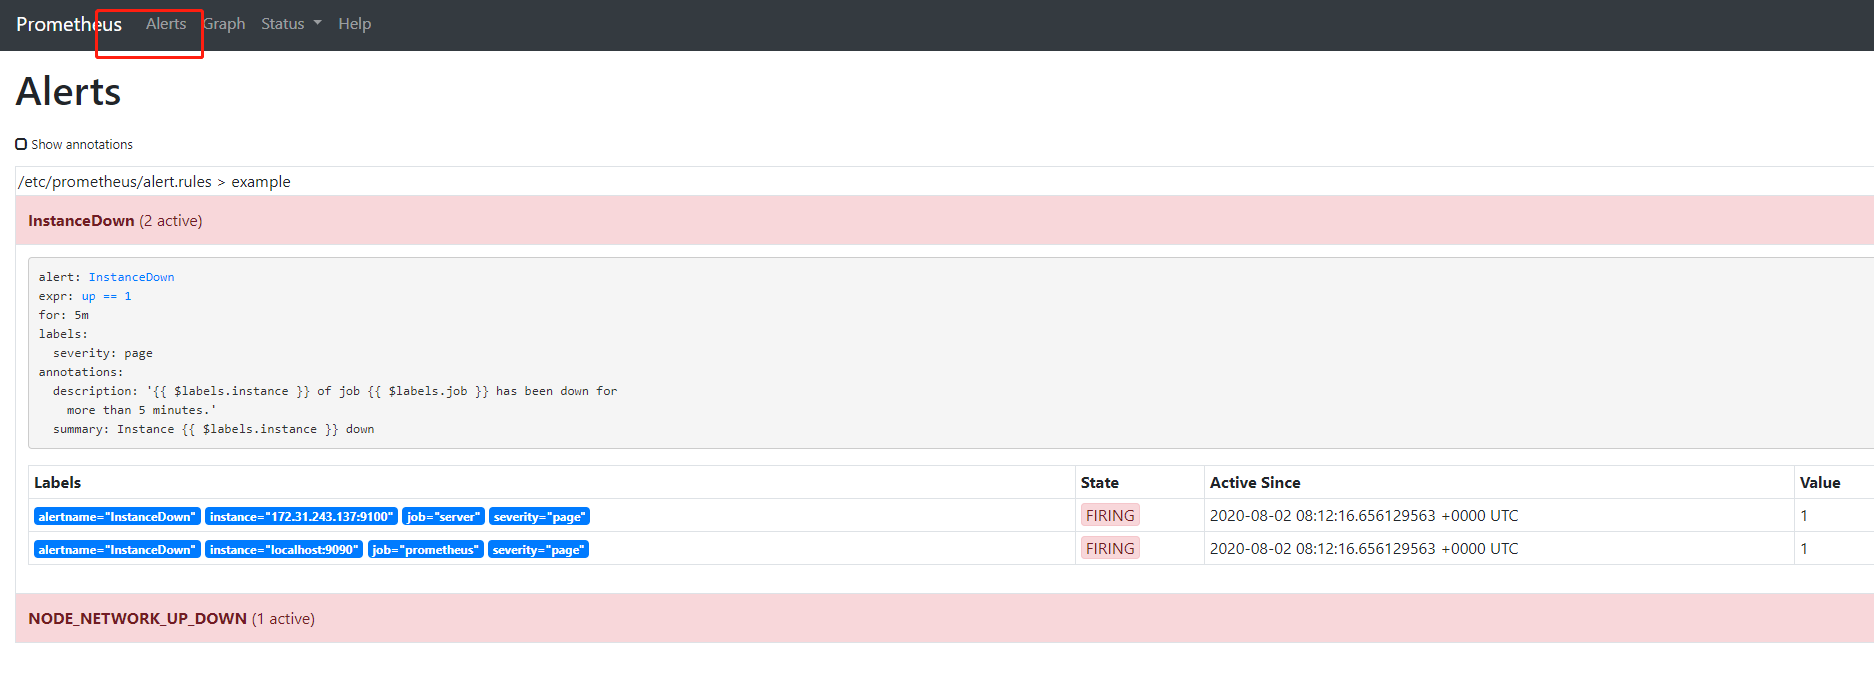
vim /etc/prometheus/alert.rulesgroups:- name: examplerules:# Alert for any instance that is unreachable for >5 minutes.- alert: InstanceDownexpr: up == 1for: 5mlabels:severity: pageannotations:summary: "Instance {{ $labels.instance }} down"description: "{{ $labels.instance }} of job {{ $labels.job }} has been down for more than 5 minutes."# Alert for any instance that has a median request latency >1s.- alert: NODE_NETWORK_UP_DOWNexpr: node_network_up{device="docker0",instance="172.31.243.137:9100",job="server"} > 0for: 10mannotations:summary: "High request latency on {{ $labels.instance }}"description: "{{ $labels.instance }} has a median request latency above 1s (current value: {{ $value }}s)"
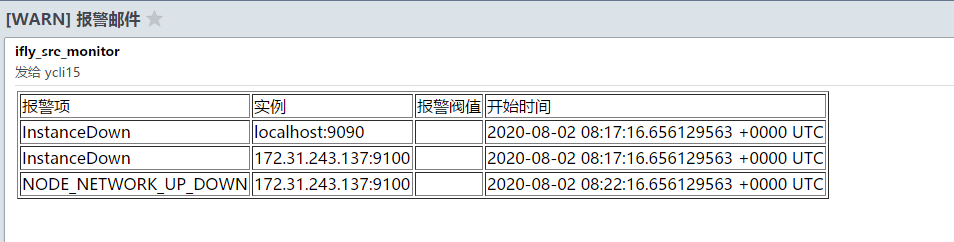
触发告警
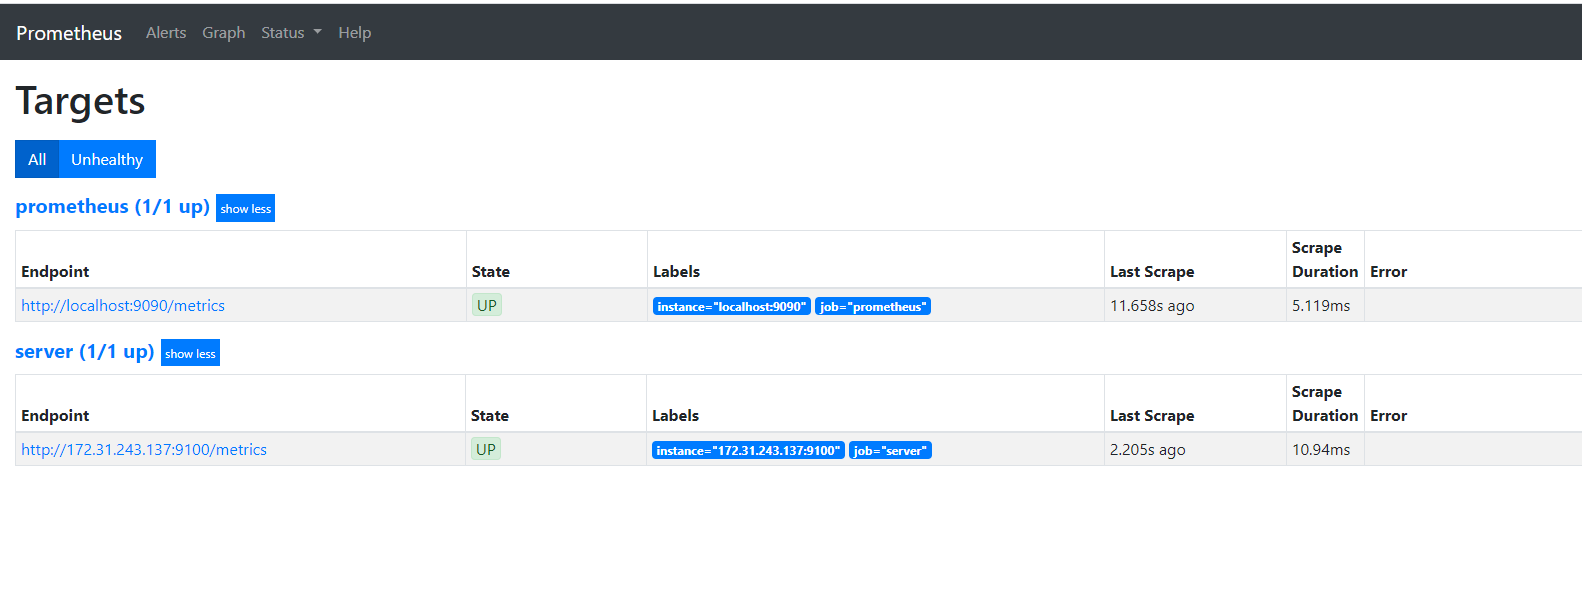
查看prometheus界面Ip:9090
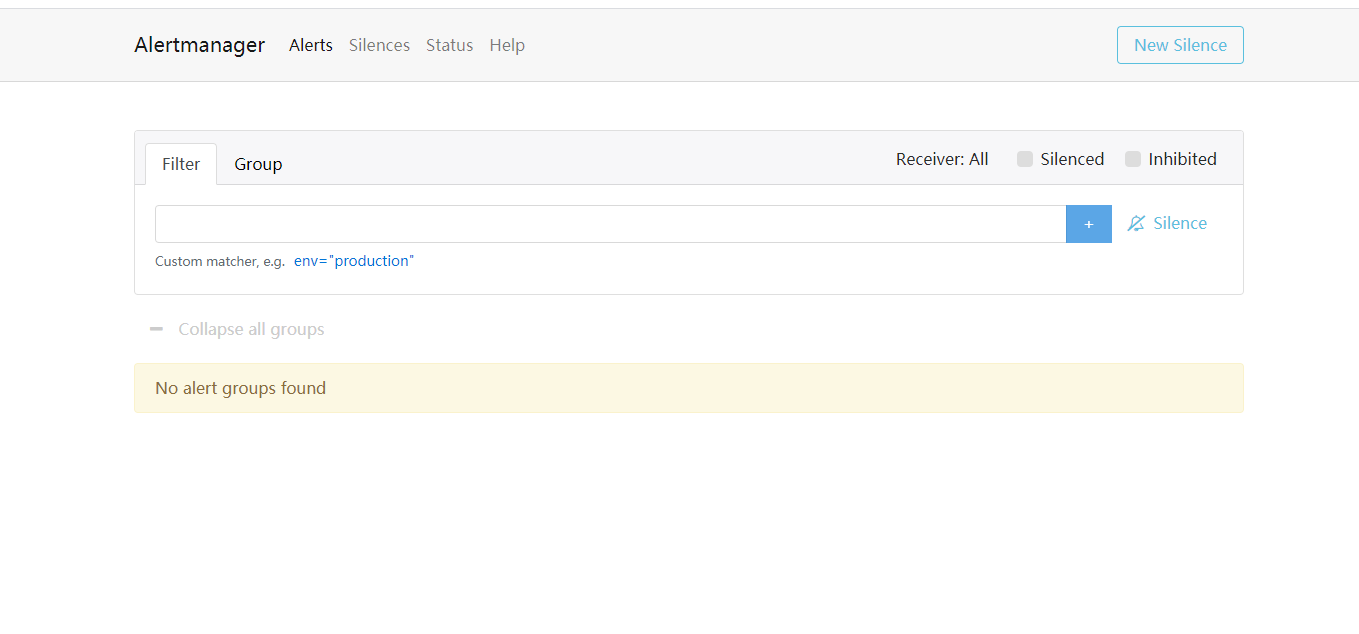
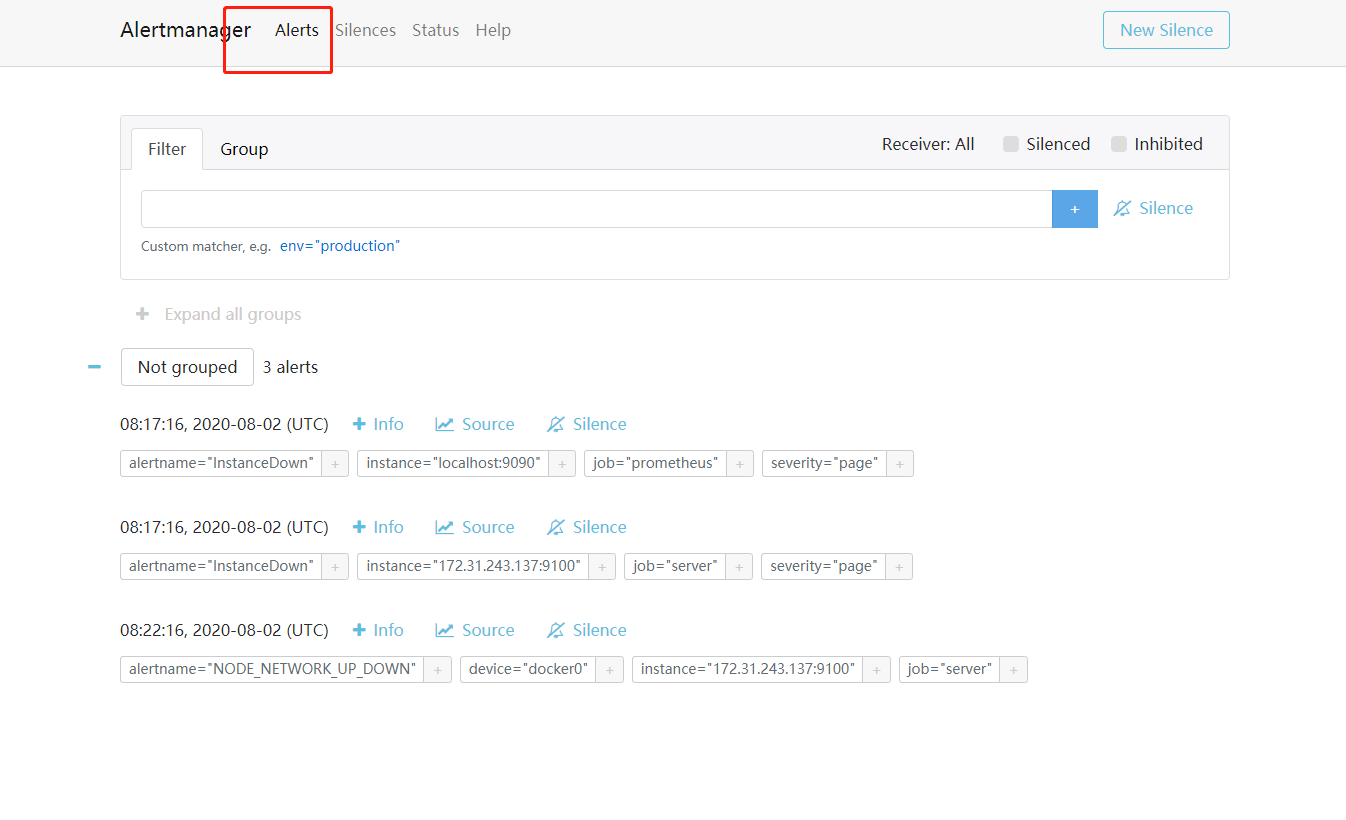
查看alertmanager告警
3、pushgateway服务
3.1 pushgateway下载
docker pull prom/pushgateway:v1.2.0
3.2 安装部署
docker run -d --name=pg -p 9091:9091 prom/pushgateway:v1.2.0
3.2 配置prometheus
增加scrapeconfigs配置:job->pushgateway
记得重启prometheus容器_
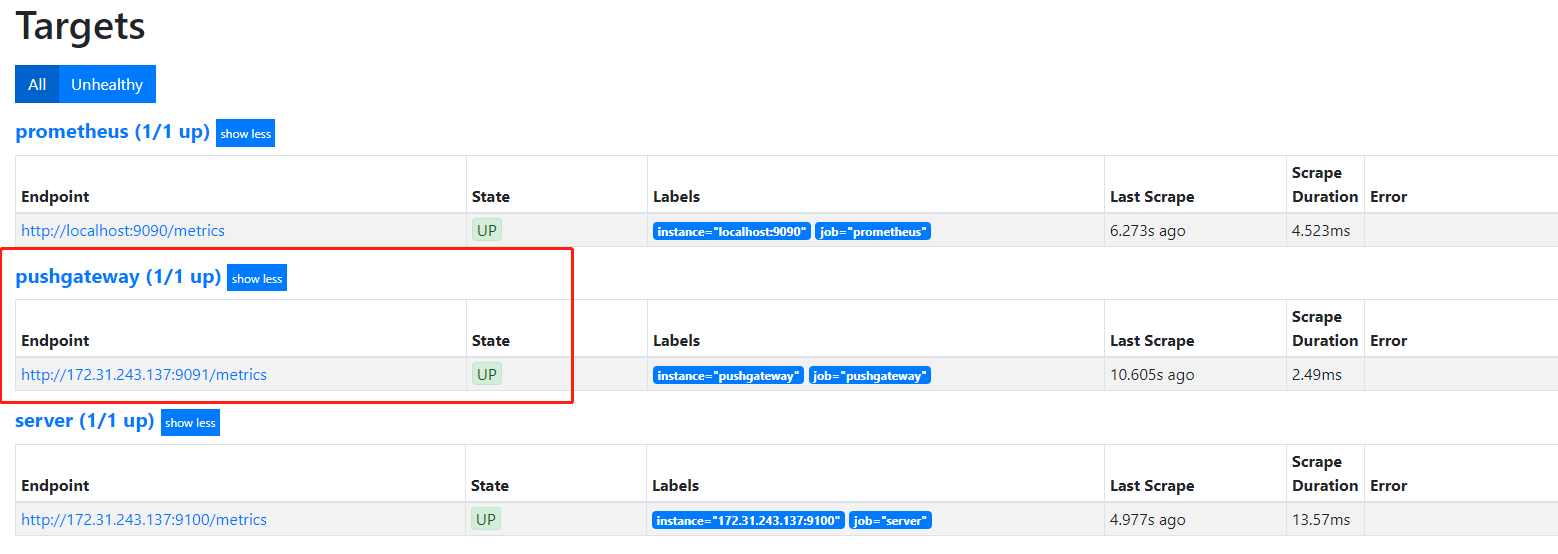
scrape_configs:# The job name is added as a label `job=<job_name>` to any timeseries scraped from this config.- job_name: 'prometheus'# metrics_path defaults to '/metrics'# scheme defaults to 'http'.static_configs:- targets: ['localhost:9090']- job_name: 'server'static_configs:- targets: ['172.31.243.137:9100']- job_name: pushgatewaystatic_configs:- targets: ['172.31.243.137:9091']labels:instance: pushgateway
查看prometheus监控界面IP:9090
3.3 pushgateway抛送数据举例
使用curl的post功能抛送数据
cat <<EOF | curl --data-binary @- http://172.31.243.137:9091/metrics/job/some_job/instance/some_instance> # TYPE some_metric counter> some_metric{label="val1"} 42> # TYPE another_metric gauge> # HELP another_metric Just an example.> another_metric 2398.283> EOF
查看页面


若有收获,就点个赞吧
0 人点赞
